1811
The role of high-resolution apparent diffusion coefficient histogram analysis in evaluating tumor response of locally advanced rectal cancer after neoadjuvant chemeradiotherapy1West China Hospital, Chengdu, China
Synopsis
This study analyzed both pre- and post-chemoradiotherapy ADC map of rectal cancer to evaluate tumor regression by using histogram metrics. The ADC map was generated from high-resolution DWI using read-out segmented echo-plannar imaging sequence, with less distortion and susceptibility artifact. Our study did not find any added value of histogram metrics of ADC map in assessing tumor response, and post-treatment mean ADC value alone may be enough in clinical.
Objectives
the purpose of this study was to evaluate the value of histogram analysis of ADC map calculated from DWI using read-out segmented echo-plannar imaging (rs-EPI) before and after neoadjuvant chemoradiotherapy (CRT) in identifying pathological complete response (pCR) in locally advanced rectal cancer (LARC).Methods
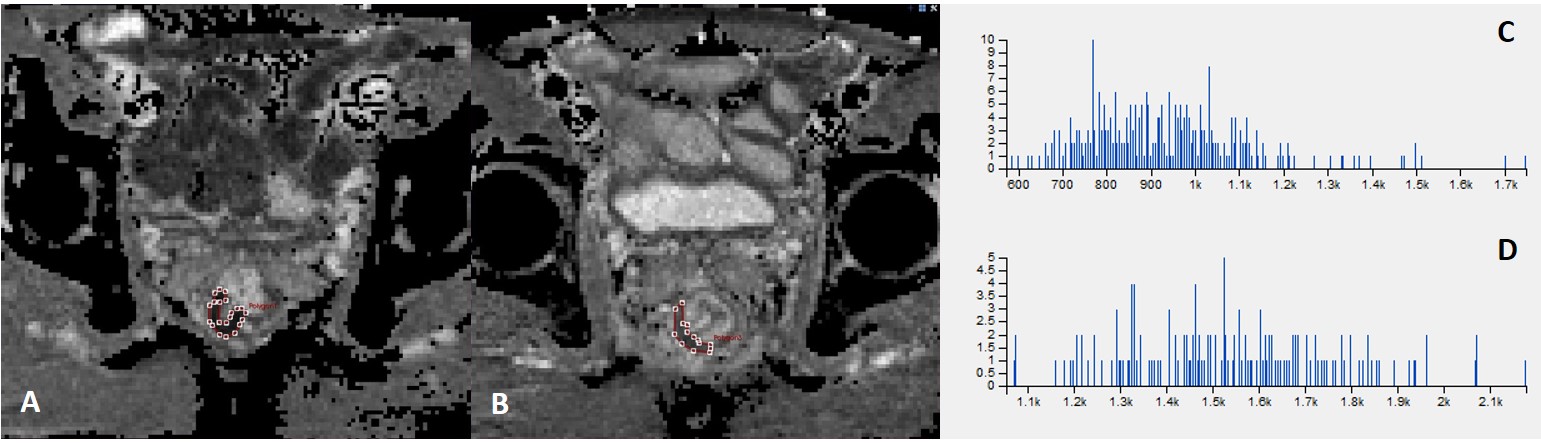
63 patients with LARC who have received neoadjuvant CRT and subsequent surgery were enrolled in this retrospective study. All of them underwent both pre- and post-CRT MR examinations, including DWI using rs-EPI sequence. Pathological results served as the reference standard, and patients were divided into pCR (TRG0) and non-pCR (TRG1-3) group according to tumor regression grade (TRG). Histogram analysis was performed on pre- and post-CRT ADC map. Two radiologists manually drew regions of interest covering the whole tumor independently. Interobserver variability was analyzed by calculating the intraclass correlation coefficient (ICC). Respective mean value, quantile 5%, 25%, 50%, 75% and 90% of ADC value distribution and the percentage changes were calculated and compared between two groups. Receiver operating characteristic (ROC) curves were generated and compared to evaluate the diagnostic performance of imaging parameters.Results
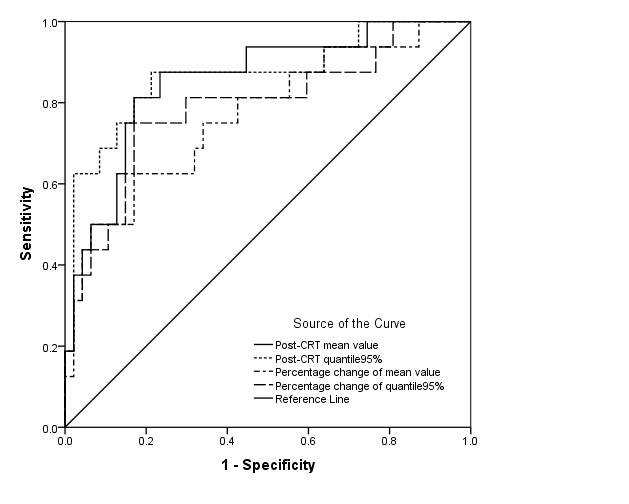
16 (25.4%) of patients had pCR and 47 (74.6%) had non-pCR. Overall interobserver agreement was good for both pre- and post-CRT ADC map histogram analysis (ICC=0.543-0.998). Post-CRT mean value and all quantile values were significant higher in the pCR group (all P<0.001). The pCR group also showed a higher percentage change of mean and all quantile values than non-pCR group (all P<0.001). Pre-CRT ADC map had a higher energy (P=0.025) and a lower entropy (P=0.025) in pCR group, but the ADC value showed no difference between two groups (P=0.4-0.994). ROC curves results revealed that histogram values of ADC map had no added value to mean value, including post-CRT ADC value and percentage change (all P>0.05). Post-CRT ADC map also showed a comparative good diagnostic ability to percentage change in identifying pCR (all P>0.05). When using the cut-off value 1.345´10-3mm2/s of post-CRT mean ADC value, it showed a good diagnostic power of pCR (AUCs=0.855), with a sensitivity of 83%, specificity of 81.3%, PPV of 92.9% and NPV of 61.9%.Conclusions
Patients who achieved pCR had a less heterogeneous pre-CRT ADC map, and a higher post-CRT mean and quantile ADC values, as well as a larger percentage changes. Histogram analysis had no added value over mean ADC value on evaluating pCR. Post-CRT mean ADC value alone may be clinical sufficient to assessing tumor response in rectal cancer.Acknowledgements
No acknowledgement found.References
1. Maas M, Nelemans PJ, Valentini V, et al. Long-term outcome in patients with a pathological complete response after chemoradiation for rectal cancer: a pooled analysis of individual patient data. Lancet Oncol 2010; 11:835-844
2. Beets GL, Figueiredo NF, and Beets-Tan RG. Management of Rectal Cancer Without Radical Resection. Annu Rev Med 2017; 68:169-182
3. Smith JJ and Garcia-Aguilar J. Advances and challenges in treatment of locally advanced rectal cancer. J Clin Oncol 2015; 33:1797-1808
4. Beets-Tan RGH, Lambregts DMJ, Maas M, et al. Magnetic resonance imaging for clinical management of rectal cancer: Updated recommendations from the 2016 European Society of Gastrointestinal and Abdominal Radiology (ESGAR) consensus meeting. Eur Radiol 2018; 28:1465-1475
5. Xie H, Sun T, Chen M, et al. Effectiveness of the apparent diffusion coefficient for predicting the response to chemoradiation therapy in locally advanced rectal cancer: a systematic review and meta-analysis. Medicine (Baltimore) 2015; 94:e517
6. Ryan JE, Warrier SK, Lynch AC, and Heriot AG. Assessing pathological complete response to neoadjuvant chemoradiotherapy in locally advanced rectal cancer: a systematic review. Colorectal Dis 2015; 17:849-861
7. Pham TT, Liney GP, Wong K, and Barton MB. Functional MRI for quantitative treatment response prediction in locally advanced rectal cancer. The British Journal of Radiology 2017; 90:20151078
8. Choi MH, Oh SN, Rha SE, et al. Diffusion-weighted imaging: Apparent diffusion coefficient histogram analysis for detecting pathologic complete response to chemoradiotherapy in locally advanced rectal cancer. J Magn Reson Imaging 2016; 44:212-220
9. Chidambaram V, Brierley JD, Cummings B, et al. Investigation of volumetric apparent diffusion coefficient histogram analysis for assessing complete response and clinical outcomes following pre-operative chemoradiation treatment for rectal carcinoma. Abdom Radiol (NY) 2017; 42:1310-1318 10. Porter DA and Heidemann RM. High resolution diffusion-weighted imaging using readout-segmented echo-planar imaging, parallel imaging and a two-dimensional navigator-based reacquisition. Magn Reson Med 2009; 62:468-475
11. DeLong ER, DeLong DM, and Clarke-Pearson DL. Comparing the areas under two or more correlated receiver operating characteristic curves: a nonparametric approach. Biometrics 1988; 44:837-845
12. Padhani AR, Liu G, Koh DM, et al. Diffusion-weighted magnetic resonance imaging as a cancer biomarker: consensus and recommendations. Neoplasia 2009; 11:102-125
13. Lambrecht M, Vandecaveye V, De Keyzer F, et al. Value of diffusion-weighted magnetic resonance imaging for prediction and early assessment of response to neoadjuvant radiochemotherapy in rectal cancer: preliminary results. Int J Radiat Oncol Biol Phys 2012; 82:863-870
14. Intven M, Reerink O, and Philippens MEP. Diffusion-weighted MRI in locally advanced rectal cancer. Strahlentherapie und Onkologie 2013; 189:117-122
15. Xu Q, Xu Y, Sun H, et al. Quantitative intravoxel incoherent motion parameters derived from whole-tumor volume for assessing pathological complete response to neoadjuvant chemotherapy in locally advanced rectal cancer. J Magn Reson Imaging 2018; 48:248-258
16. De Felice F, Magnante AL, Musio D, et al. Diffusion-weighted magnetic resonance imaging in locally advanced rectal cancer treated with neoadjuvant chemoradiotherapy. Eur J Surg Oncol 2017; 43:1324-1329
17. Ha HI, Kim AY, Yu CS, Park SH, and Ha HK. Locally advanced rectal cancer: diffusion-weighted MR tumour volumetry and the apparent diffusion coefficient for evaluating complete remission after preoperative chemoradiation therapy. European Radiology 2013; 23:3345-3353
18. Kim SH, Lee JY, Lee JM, Han JK, and Choi BI. Apparent diffusion coefficient for evaluating tumour response to neoadjuvant chemoradiation therapy for locally advanced rectal cancer. European Radiology 2011; 21:987-995
19. Intven M, Reerink O, and Philippens ME. Diffusion-weighted MRI in locally advanced rectal cancer : pathological response prediction after neo-adjuvant radiochemotherapy. Strahlenther Onkol 2013; 189:117-122
20. Blazic IM, Lilic GB, and Gajic MM. Quantitative Assessment of Rectal Cancer Response to Neoadjuvant Combined Chemotherapy and Radiation Therapy: Comparison of Three Methods of Positioning Region of Interest for ADC Measurements at Diffusion-weighted MR Imaging. Radiology 2017; 282:418-428
21. Just N. Improving tumour heterogeneity MRI assessment with histograms. Br J Cancer 2014; 111:2205-2213
22. Enkhbaatar NE, Inoue S, Yamamuro H, et al. MR Imaging with Apparent Diffusion Coefficient Histogram Analysis: Evaluation of Locally Advanced Rectal Cancer after Chemotherapy and Radiation Therapy. Radiology 2018; 288:129-137
Figures