1809
Assessment of the Prognostic Factors for Rectal Cancer Treated with Neoadjuvant Chemoradiation: Utilizing Whole-Tumor Histogram Analysis of Diffusion Kurtosis ImagingSun Yiqun1, Tong Tong1, Fu Caixia2, Yan Xu3, Peng Weijun1, and Gu Yajia1
1Fudan University Shanghai Cancer Center, Shanghai, China, 2MR Applications Development, Siemens Shenzhen Magnetic Resonance Ltd., Shenzhen, China, 3MR Collaboration NE Asia, Siemens Healthcare, Shanghai, China
Synopsis
We assess the prognostic factors for rectal cancer treated with neoadjuvant chemoradiation utilizing whole-tumor histogram analysis of diffusion kurtosis imaging. Our study demonstrated that whole-tumor histogram analysis of diffusion kurtosis imaginghas potential to be a predictor for DFS and provide evidence for individualized follow-up and treatment of locally advanced rectal cancer patients.
Purpose
To assess the capability of the whole-tumor histogram analysis of diffusion kurtosis imaging in evaluating the prognostic factors for a local advanced rectal cancer treated with neoadjuvant chemoradiation.Materials and methods
Between June 2016 and November 2017, totally 37 patients with rectal cancer were retrospectively collected and followed in our study. All patients received neoadjuvant chemoradiation followed by total mesorectal excision. The enrolled patients were examined using MRI including DKI sequence at two time points: 1-7 days before neoadjuvant chemoradiation (pre-MRI), within 1-7 days after NCRT (post-MRI). Pretreatment T stage, N stage, mesorectal fascia (MRF),extramural vascular invasion (EMVI), tumor location and length, pretreatmentCEA and CA19-9 levels were recorded. Tumor response, TN stage, circumferential resection margin(CRM), perineural invasion (PNI) and lymphovascular invasion(LVI) were evaluated.The parameters of DKI sequence were as following: b values = 0, 700, 1,400 and 2,100 s/mm2; FOV = 240×180 mm2; scan matrix = 120×120; TE/TR = 4,800/79 ms; bandwidth =1,894 Hz/pixel; ADC map were inline calculated. DKI derived parameter maps were calculated by using the prototype Body Diffusion toolbox (Siemens healthcare, Erlangen, Germany). Whole tumor volume histograms analysis were performed for ADC map and DKI derived parameter maps on a prototype MR Multiple Parameter Analysis software (Siemens healthcare, Erlangen, Germany). The histogram features including Volume, Mean, Standard deviation (SD), Median(Med), Percentiles (75th, 95th), Skewness(Ske), Excess Kurtosis (ExcKur) and Difference Entropy (DiffEnt) were calculated all mentioned parameter maps. Histogram features of the difference between pre-treament and post-treament maps were also generated. The predictor of disease-free survival (DFS)was analyzed by using Cox proportional hazards modelResults
Pre-Treatment D5th was able to discriminate prognosis of DFS and the cut-off value as 0.717×10⁻³mm2/sec, AUC=0.724 (p=0.033) (Figure 1). Pre-treatment N2 (HR=8.417 (1.074-65.975), p=0.043), EMVI(+) (HR=18.929 (2.414-148.432), p=0.005), MRF(+) (HR=3.767 (1.136-12.488), p=0.030), high rectal cancer (HR=4.110 (1.234-13.688), p=0.021), CEA≥5ng/ml (HR=4.129 (1.094-15.584), p=0.036), low pre-treament D5th(HR=14.428 (1.833-113.588), p=0.011), ypT3-4 (HR=6.732 (1.949-23.351), p=0.003) and ypN(+) (HR=6.083 (1.781-30.775), p=0.004) could be associated with worse DFS in univariate analysis. Multivariate analysis identified the ypT3-4 (HR=14.240 (1.485-208.527), p=0.029) (Figure 2) and low pre-treament D5th(HR=61.659 (3.686-1031.500), p=0.004) (Figure 3) were independent risk predictors for worse DFS.Conclusion
Pre-Treatment D5th has potential to be a predictor for DFS and provide evidence for individualized follow-up and treatment of locally advanced rectal cancer patients.Acknowledgements
No acknowledgement found.References
No reference found.Figures
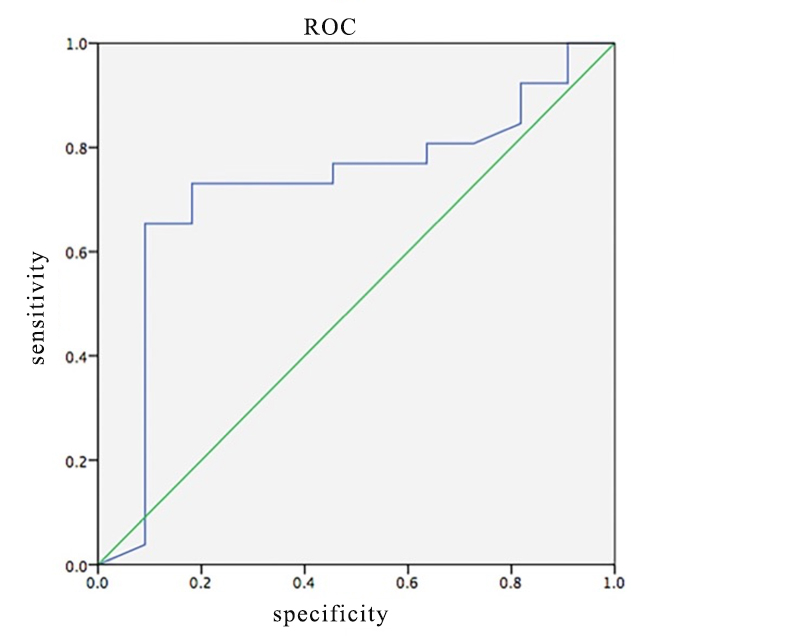
Pre-Treatment D5th was able to discriminate prognosis of DFS and the cut-off value as 0.717×10⁻³mm2/sec, AUC=0.724 (p=0.033), sensitivity and specificity were 65.4%、90.9% respectively.
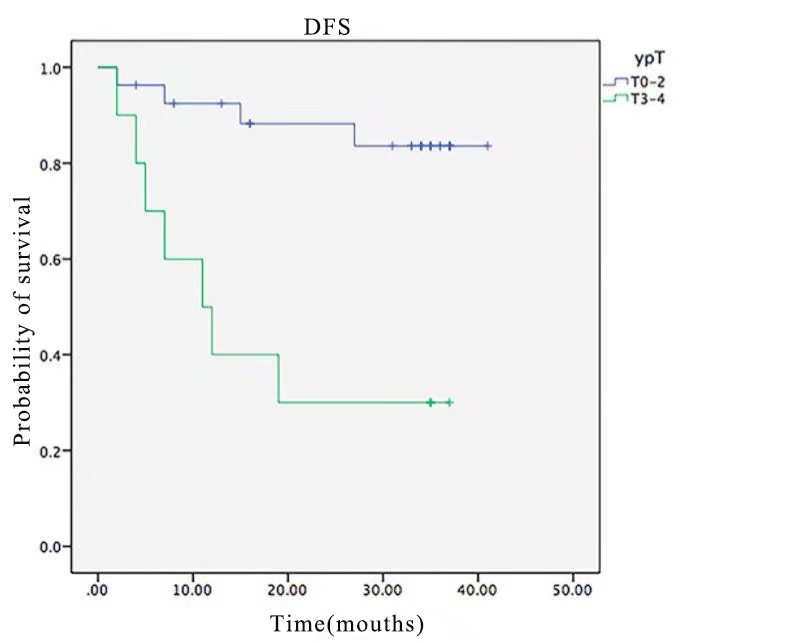
There was significant difference in disease-free survival between the ypT0-2 group and the ypT3-4 group.The ypT3-4 (HR=14.240 (1.485-208.527), p=0.029),were independent risk predictors for worse DFS.
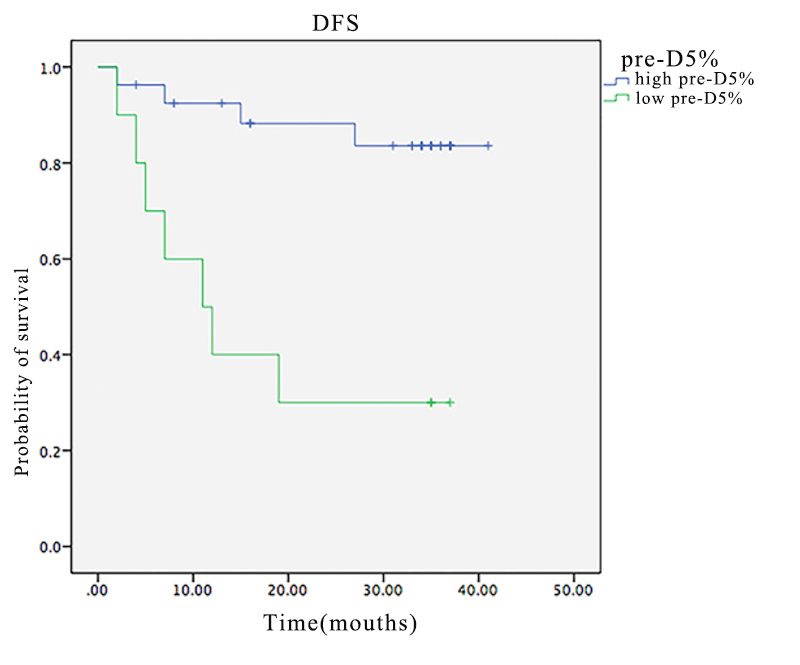
There was significant difference in disease-free survival between the low pre-D5% group and high pre-D5% group.The low pre-D5% (HR=61.659 (3.686-1031.500), p=0.004) were independent risk predictors for worse DFS.