1802
Comparison of Liver Apparent Diffusion Coefficient (ADC) Measurement Using Single-shot and Multi-shot Diffusion-weighted EPI1Department of Diagnostic Radiology, The University of Hong Kong, Hong Kong, Hong Kong
Synopsis
Diffusion-weighted imaging has been shown useful in measuring liver apparent diffusion coefficient (ADC) that can provide valuable information for clinical diagnosis. Single-shot diffusion-weighted echo-planar imaging (ssDW-EPI) is the preferred acquisition technique for ADC measurement on clinical MRI scanner. Recently, a multiplexed sensitivity encoding (MUSE) framework has been developed to reconstruct high-quality multi-shot DW-EPI (msDW-EPI) image in brain. In this study, we aim to evaluate the msDW-EPI technique on liver ADC measurement by quantitatively comparing measured ADC values obtained from either msDW-EPI or ssDW-EPI.
INTRODUCTION
Diffusion-weighted imaging has been shown useful in measuring liver apparent diffusion coefficient (ADC) that can provide valuable information for clinical diagnosis1, 2. Single-shot diffusion-weighted echo-planar imaging (ssDW-EPI) is the preferred acquisition technique for ADC measurement on clinical MRI scanner3, 4. Recently, a multiplexed sensitivity encoding (MUSE) framework has been developed to reconstruct high-quality multi-shot DW-EPI (msDW-EPI) image in brain5, 6. In this study, we aim to evaluate the msDW-EPI technique on liver ADC measurement by quantitatively comparing measured ADC values obtained from either msDW-EPI or ssDW-EPI.METHOD
Participants and experiment: 11 patients (10 men, 1 woman; mean age 59 years, age range 40-74 years) were recruited into our study. Total 8 subject underwent 4 DWI scan: 1) breath-hold ssDW-EPI (scantime = 20 sec), 2) respiratory-triggered ssDW-EPI (scantime = 2:00), 3) 4-shot DW-EPI with 128×128 matrix size (scantime = 2:50), and 4) 4-shot DW-EPI with 192×192 matrix size (scantime = 2:50). The acceleration factor of 2 was used for all ssDW-EPI acquisition. For all msDW-EPI acquisition, the respiratory-triggering was applied to minimize the respiratory motion problem. We acquired the data with two b-values: 0 and 500 s/mm2 in three orthogonal directions. For 4-shot DW-EPI with 128×128 matrix size, 6 subjects were acquired with 1 NEX, 5 with 2 NEX. For 4-shot DW-EPI with 192×192 matrix size, all subjects were acquired with 2 NEX.
Data reconstruction: All multi-shot DW-EPI data were reconstructed with MUSE5 algorithm. First, the inter-shot phase variations were measured from each segment by using SENSE7. Afterward, all phase variation maps were smoothed by using either total variance algorithm (TV)8 or Hanning window filtering. Figure 1 shows that the smoothing of phase variation maps can affect reconstruction performance, where Tol represents the acceptable difference between two successive iteration results, and w represents the size of Hanning window.
ADC measurement: ADC maps were calculated from all data sets for all subjects. Four ROIs were placed on liver avoiding large vessels for liver ADC measurement. The normalized ADC value (nADC = ADCliver/ADCspleen) 9, 10 was calculated that has been proposed to improve the diagnostic detection accuracy for liver fibrosis and cirrhosis. Therefore, the spleen ADC value was also measured from all data. The sample t-tests was used to statistically analyze the differences in measured ADC values using different acquisition sequences. The p-value less than 0.05 is considered to have significant difference.
RESULTS
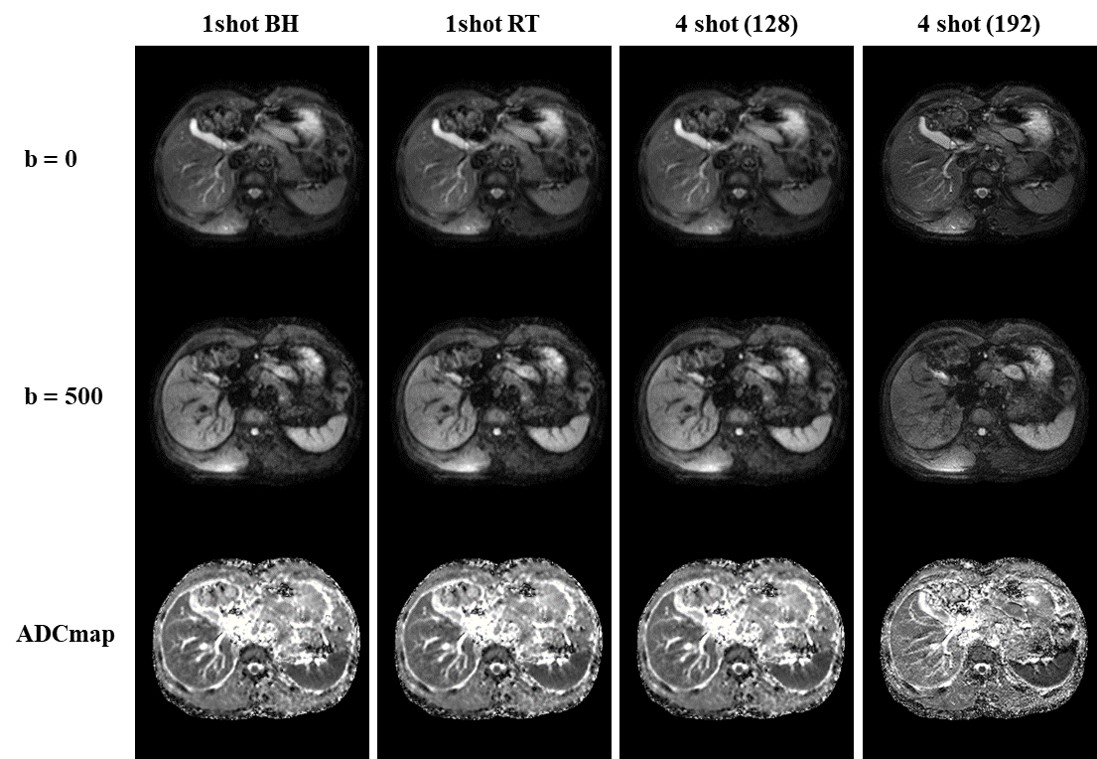
Figure 2 shows representative images and ADC maps for one subject acquired with 4 different sequences (breath-hold ssDW-EPI, respiratory-triggered ssDW-EPI, respiratory-triggered 4-shot DW-EPI with 128x128 matrix, and respiratory-triggered 4-shot DW-EPI with 192x192 matrix). Figure 3 shows the ADC measurements in liver, spleen, and calculated nADC value from all subjects with different acquisition sequences (“*” denotes the significant difference between the pair of data).DISCUSSION
In this study, we have demonstrated that the liver ADC value can be successfully measured with msDW-EPI acquisition with less distortion and image blurring. For liver ADC measurement, it only shows significant difference between breath-hold ssDW-EPI and other three respiratory-triggered sequences (left panel of Figure 3). This suggests that the ADC measurement with respiratory-triggered msDW-EPI technique is comparable to respiratory-triggered ssDW-EPI acquisition. For spleen ADC measurement, it shows significant difference between bread-hold ssDW-EPI and msDW-EPI (middle panel of Figure 3). However, the nADC values can eliminate the significant difference between bread-hold ssDW-EPI and msDW-EPI (right panel of Figure 3). Another important finding in our study is that the smoothing of phase variation maps can significantly affect the image quality of MUSE reconstructed image (artifacts on liver shown in Figure 1). It is because the respiratory motion can induce phase variation with high spatial varying. When using a heavy smoothing parameter, it can destroy the phase information and cause residual artifact after MUSE reconstruction. Thus, for liver ADC measurement using msDW-EPI technique, it should be carefully to select the smoothing parameters for optimizing the SNR performance without inducing undesired artifacts. In conclusion, respiratory-triggered msDW-EPI can offer superior image quality and comparable measured ADC values to routine respiratory-triggered ssDW-EPI acquisition.Acknowledgements
The work was in part supported by grants from Hong Kong Research Grant Council (GRF HKU17138616 and GRF HKU17121517).References
1. Warach S, Chien D, Li W, Ronthal M and Edelman R. Fast magnetic resonance diffusion‐weighted imaging of acute human stroke. Neurology. 1992;42:1717-1717.
2. Porter DA and Heidemann RM. High resolution diffusion‐weighted imaging using readout‐segmented echo‐planar imaging, parallel imaging and a two‐dimensional navigator‐based reacquisition. Magnetic Resonance in Medicine: An Official Journal of the International Society for Magnetic Resonance in Medicine. 2009;62:468-475.
3. Chow LC, Bammer R, Moseley ME and Sommer FG. Single breath‐hold diffusion‐weighted imaging of the abdomen. Journal of Magnetic Resonance Imaging: An Official Journal of the International Society for Magnetic Resonance in Medicine. 2003;18:377-382.
4. Schwartz K, Lane J, Bolster B and Neff B. The utility of diffusion-weighted imaging for cholesteatoma evaluation. American Journal of Neuroradiology. 2011;32:430-436.
5. Chen N-k, Guidon A, Chang H-C and Song AW. A robust multi-shot scan strategy for high-resolution diffusion weighted MRI enabled by multiplexed sensitivity-encoding (MUSE). Neuroimage. 2013;72:41-47.
6. Chu ML, Chang HC, Chung HW, Truong TK, Bashir MR and Chen Nk. POCS‐based reconstruction of multiplexed sensitivity encoded MRI (POCSMUSE): a general algorithm for reducing motion‐related artifacts. Magnetic resonance in medicine. 2015;74:1336-1348.
7. Pruessmann KP, Weiger M, Scheidegger MB and Boesiger P. SENSE: sensitivity encoding for fast MRI. Magnetic resonance in medicine. 1999;42:952-962.
8. Rudin LI and Osher S. Total variation based image restoration with free local constraints. Image Processing, 1994 Proceedings ICIP-94, IEEE International Conference. 1994;1:31-35.
9. Do RK, Chandanara H, Felker E, Hajdu CH, Babb JS, Kim D and Taouli B. Diagnosis of liver fibrosis and cirrhosis with diffusion-weighted imaging: value of normalized apparent diffusion coefficient using the spleen as reference organ. American Journal of Roentgenology. 2010;195:671-676.
10. Zhu J, Zhang J, Gao J-Y, Li J-N, Yang D-W, Chen M, Zhou C and Yang Z-H. Apparent diffusion coefficient normalization of normal liver: Will it improve the reproducibility of diffusion-weighted imaging at different MR scanners as a new biomarker? Medicine. 2017;96.
Figures