1797
Pre-contrast T1 measurement in the liver and spleen for the non-invasive assessment of portal hypertension1Translational and Molecular Imaging Institute, Icahn School of Medicine at Mount Sinai, New York, NY, United States, 2Department of Radiology, Icahn School of Medicine at Mount Sinai, New York, NY, United States, 3Department of Medicine, Icahn School of Medicine at Mount Sinai, New York, NY, United States, 4Department of Pathology, Icahn School of Medicine at Mount Sinai, New York, NY, United States, 5Department of Interventional Radiology, Icahn School of Medicine at Mount Sinai, New York, NY, United States
Synopsis
The purpose of our prospective study was to assess the diagnostic value of liver and spleen T1 for diagnosis of portal hypertension based on hepatic venous pressure gradient (HVPG) in patients with chronic liver disease. We found that mean and median liver T1 were significantly elevated in patients with clinically significant portal hypertension versus those without clinically significant portal hypertension. We conclude that liver T1 is potentially sensitive to parenchymal changes associated with portal hypertension, to be confirmed in a larger number of patients.
Introduction
Portal hypertension (PH), a common complication of liver cirrhosis, results in esophageal varices (which carry high risk of bleeding), ascites and renal dysfunction1. Definitive diagnosis of PH is based on hepatic venous pressure gradient (HVPG) measurement 2-4, an indirect surrogate for portal pressure, which is invasive and not widely available5. We assess the diagnostic value of liver and spleen T1 for diagnosis of PH in patients with chronic liver disease.Methods
Twelve initial patients (M/F 8/4, mean age 61y) with chronic liver disease (liver cirrhosis/ no cirrhosis: 8/4) and suspicion of PH were enrolled in this ongoing prospective IRB-approved study. HVPG measurements and transjugular liver biopsies were performed within 1 month of MRI. All patients underwent multiparametric abdominal MRI at 1.5T (Aera, Siemens Healthineers) including a Look-Locker IR T1 measurement acquired before injection of a gadolinium contrast agent. Our one-breath-hold protocol for T1 measurement in the liver has been previously validated in a phantom study 6. The IR Look-Locker measurement protocol consisted of an inversion-time mapping GRE sequence (“TI Scout”) prospectively gated to the ECG waveform simulator on the scanner, with the simulator R-R interval set to 2000 ms. The IR Look-Locker acquisition (18-20s; TR/TE/FA 41.7 ms/1.27 ms/8°, in-plane resolution 2.1 x 2.1mm2, slice thickness 7 mm, 1-2 slices) measured 32 inversion times (82.5-1417.5 ms, increment 42.5 ms) 6. T1 maps (Fig.1) were generated in MATLAB R 2016 by fitting the signal to the modified Look-Locker equation 6. ROIs were placed on mid-liver T1 maps in the right posterior liver lobe and mid-spleen. Mean and median T1 of histograms of liver and spleen ROI T1 values constrained to the range of 200-2500 ms were obtained. Average ROI size was 1925.5 ± 798.7 voxels for liver and 816.1± 623.5 voxels for spleen. Patients were divided into groups by severity of PH based on HVPG measurements (no PH: HVPG <5 mmHg; PH, PH but no clinically significant PH: HVPG 5-9 mmHg, and clinically significant PH, HVPG ≥ 10 mmHg). Mean and median T1 values were compared between groups using one-way ANOVA and Mann-Whitney tests, and correlated with HVPG using Spearman correlation. Diagnostic performance was assessed by ROC analysis.Results
Mean HVPG was 7.8 ±5.8 mmHg (range 0-17 mmHg; no PH: n=3, PH: n=9, of which 4 had CSPH). One-way ANOVA showed a trend of significant differences between groups in mean liver T1 (Table 1). Mean and median liver T1 were significantly elevated in patients with clinically significant PH versus those with non- clinically significant PH (Table 1, Figure 2; p=0.0159). Mean and median T1 were also elevated in patients with clinically significant PH (HVPG ≥10 mmHg) compared to patients with no PH or non-clinically significant PH (HVPG <10 mmHg; Table 1, Fig. 2, p=0.0162). There were no significant differences between the no PH and PH groups (p>0.5). An AUC of 0.983 (p=0.017) was observed for mean liver T1 for prediction of clinically significant PH. Clinically significant PH was identified with 100% sensitivity and 87.5% specificity for a mean liver T1 threshold of ≥ 570.3 ms. Liver T1 did not significantly correlate with HVPG (Spearman r=0.46, p=0.13), likely due to small sample size. Spleen T1 showed no significant correlation or differences between groups (p>0.3). There were no significant differences between patients based on cirrhosis status (p>0.38).Discussion
Elevated native T1 has been observed in the presence of fibrosis in the liver 7-9 and kidney 10, and has been associated with edema and inflammation 10. Our study is in accordance with previous studies showing elevated liver T1 and positive association with portal pressures in a rat model of liver fibrosis 7 and in patients with chronic liver disease 8,9. With our one breath-hold T1 mapping protocol, we showed excellent diagnostic performance of liver T1 for prediction of clinically significant PH. Unlike a previous study in 30 patients with respiratory-gated IR-SE T1 measurement 8, we did not observe statistically significant correlation between liver T1 or spleen T1 and HVPG. These discrepancies are possibly due to our small initial series of patients.Conclusion
Liver T1, but not spleen T1, seems to be sensitive to the parenchymal changes associated with PH.Acknowledgements
This research was supported by NIDDK grant 1R01DK113272.References
1. Escorsell A, Bosch J. Pathogenesis of bleeding in portal hypertension. Digestion 1998;59 Suppl 2:2-5.
2. Escorsell A, Garcia-Pagan JC, Bosch J. Assessment of portal hypertension in humans. Clinics in liver disease 2001;5(3):575-589.
3. Moitinho E, Escorsell A, Bandi JC, et al. Prognostic value of early measurements of portal pressure in acute variceal bleeding. Gastroenterology 1999;117(3):626-631.
4. Ripoll C, Groszmann R, Garcia-Tsao G, et al. Hepatic venous pressure gradient predicts clinical decompensation in patients with compensated cirrhosis. Gastroenterology 2007;133(2):481-488.
5. Groszmann RJ, Bosch J, Grace ND, et al. Hemodynamic events in a prospective randomized trial of propranolol versus placebo in the prevention of a first variceal hemorrhage. Gastroenterology 1990;99(5):1401-1407.
6. Bane O, Hectors SJ, Wagner M, et al. Accuracy, repeatability, and interplatform reproducibility of T1 quantification methods used for DCE-MRI: Results from a multicenter phantom study. Magnetic resonance in medicine 2018;79(5):2564-2575.
7. Luetkens JA, Klein S, Traber F, et al. Quantification of Liver Fibrosis at T1 and T2 Mapping with Extracellular Volume Fraction MRI: Preclinical Results. Radiology 2018;288(3):748-754.
8. Palaniyappan N, Cox E, Bradley C, et al. Non-invasive assessment of portal hypertension using quantitative magnetic resonance imaging. Journal of hepatology 2016;65(6):1131-1139.
9. Yoon JH, Lee JM, Paek M, et al. Quantitative assessment of hepatic function: modified look-locker inversion recovery (MOLLI) sequence for T1 mapping on Gd-EOB-DTPA-enhanced liver MR imaging. European radiology 2016;26(6):1775-1782.
10. Hueper K, Peperhove M, Rong S, et al. T1-mapping for assessment of ischemia-induced acute kidney injury and prediction of chronic kidney disease in mice. European radiology 2014;24(9):2252-2260.
Figures
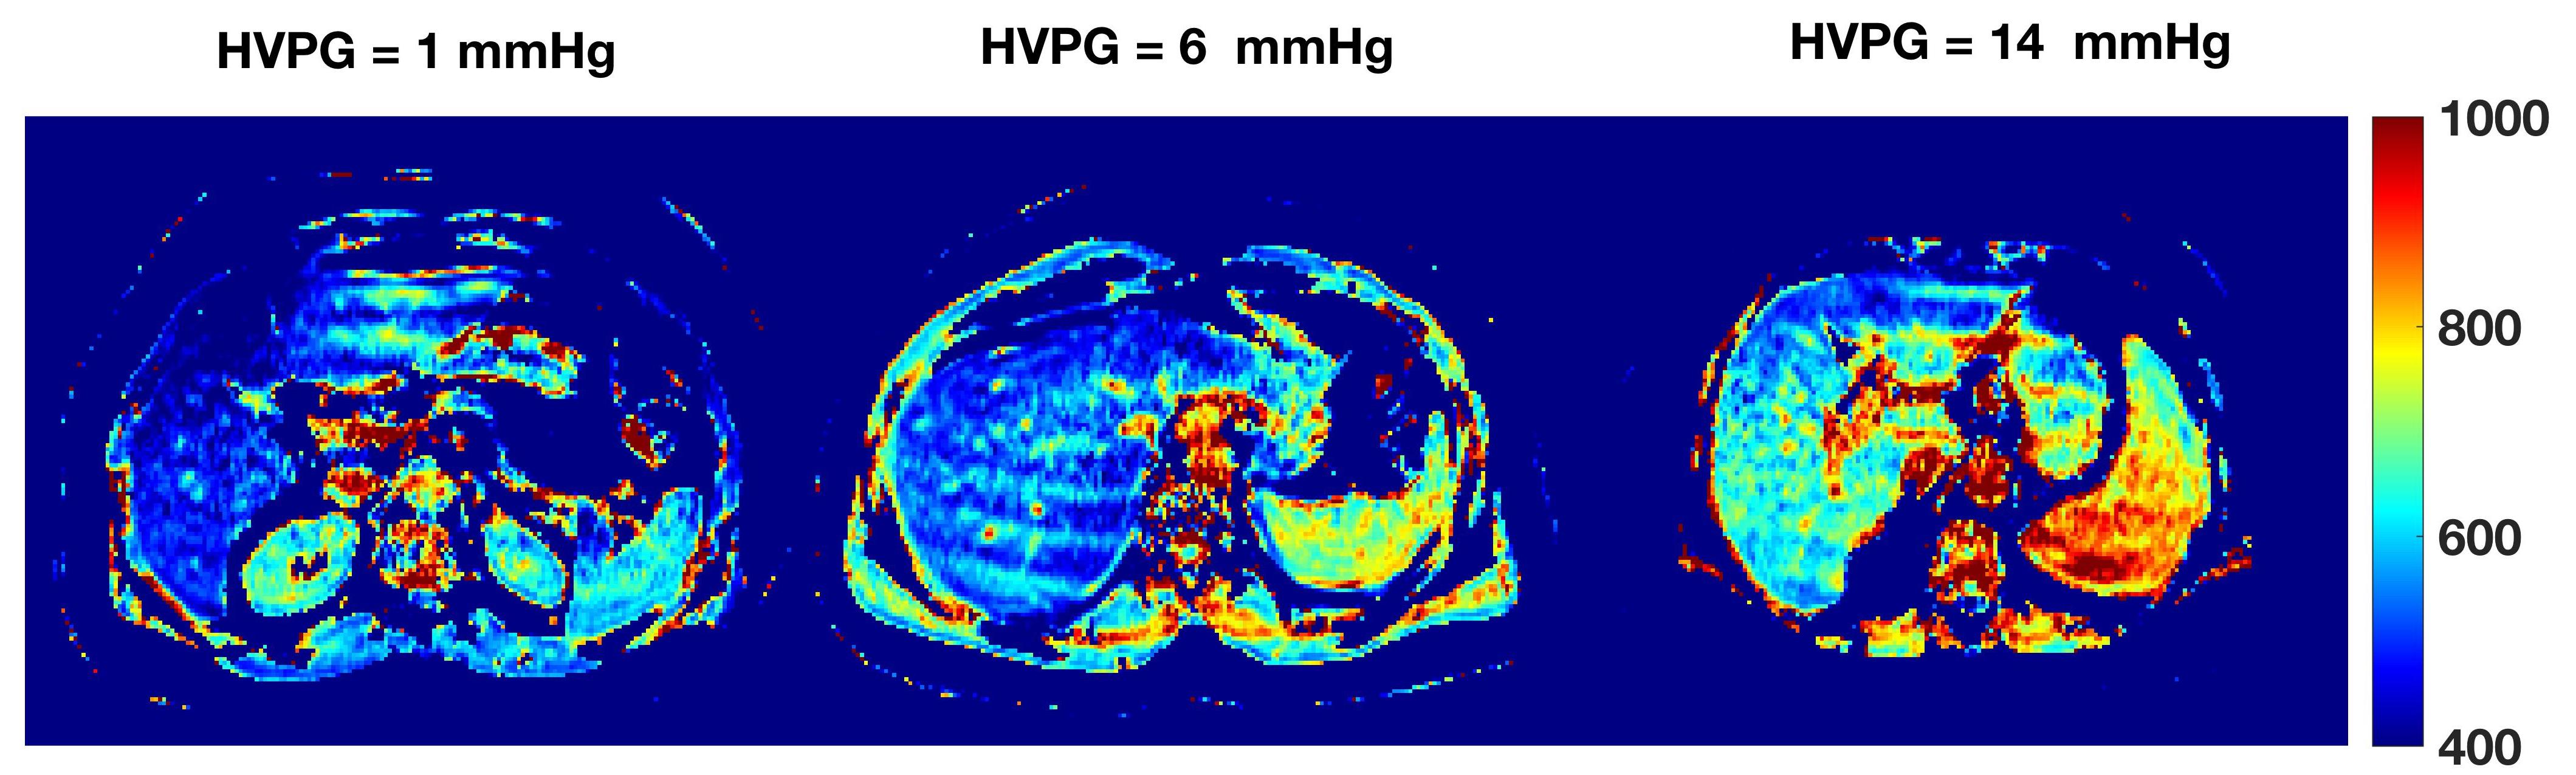
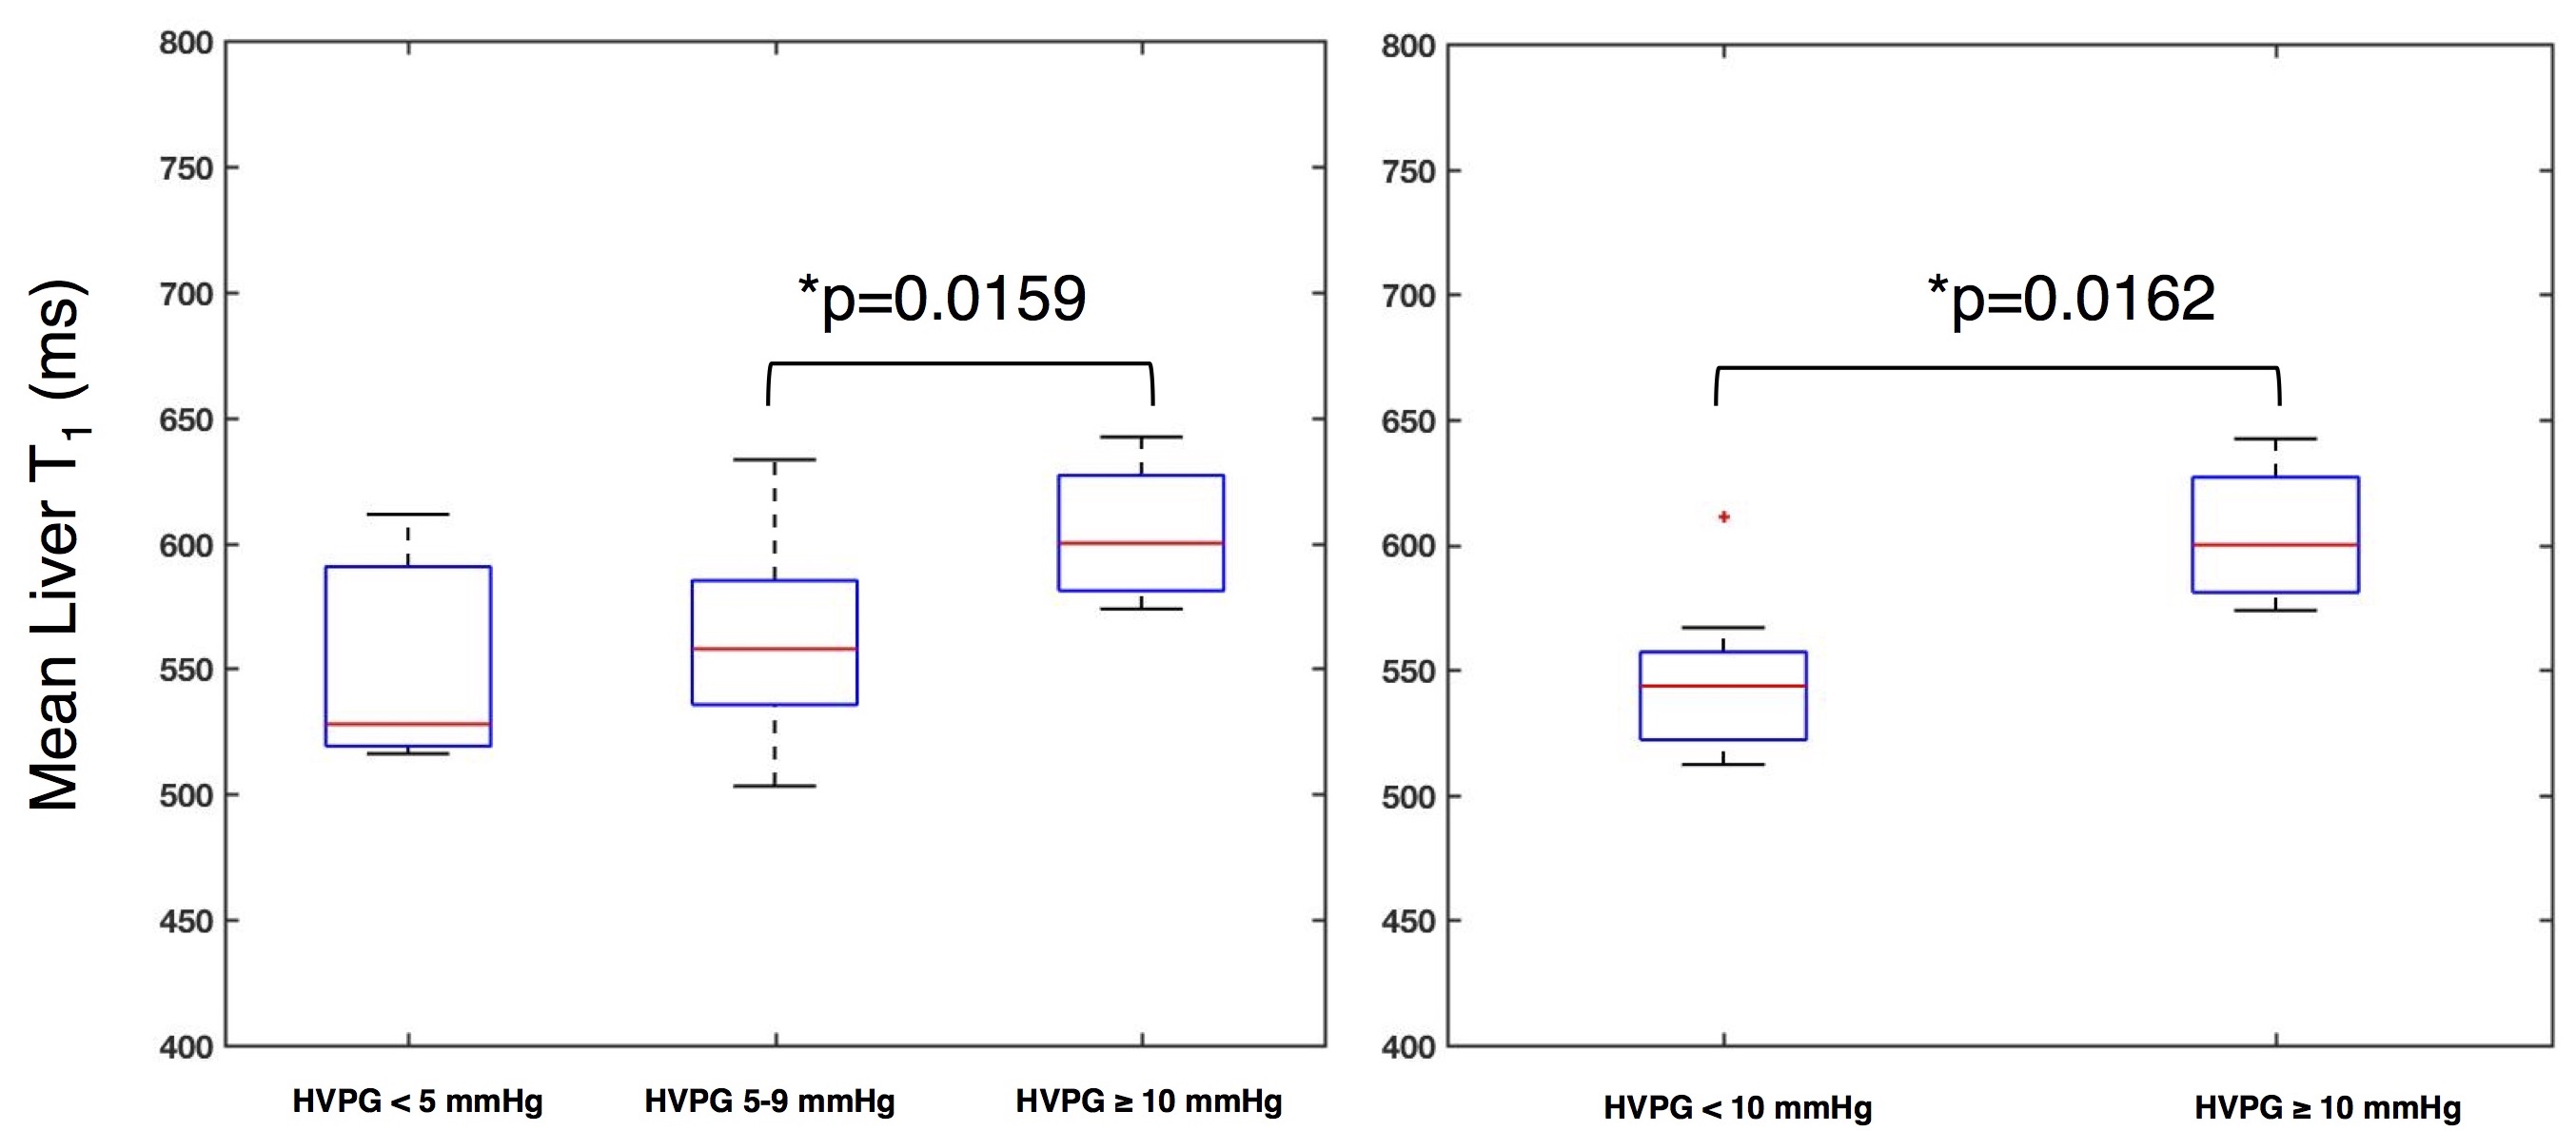
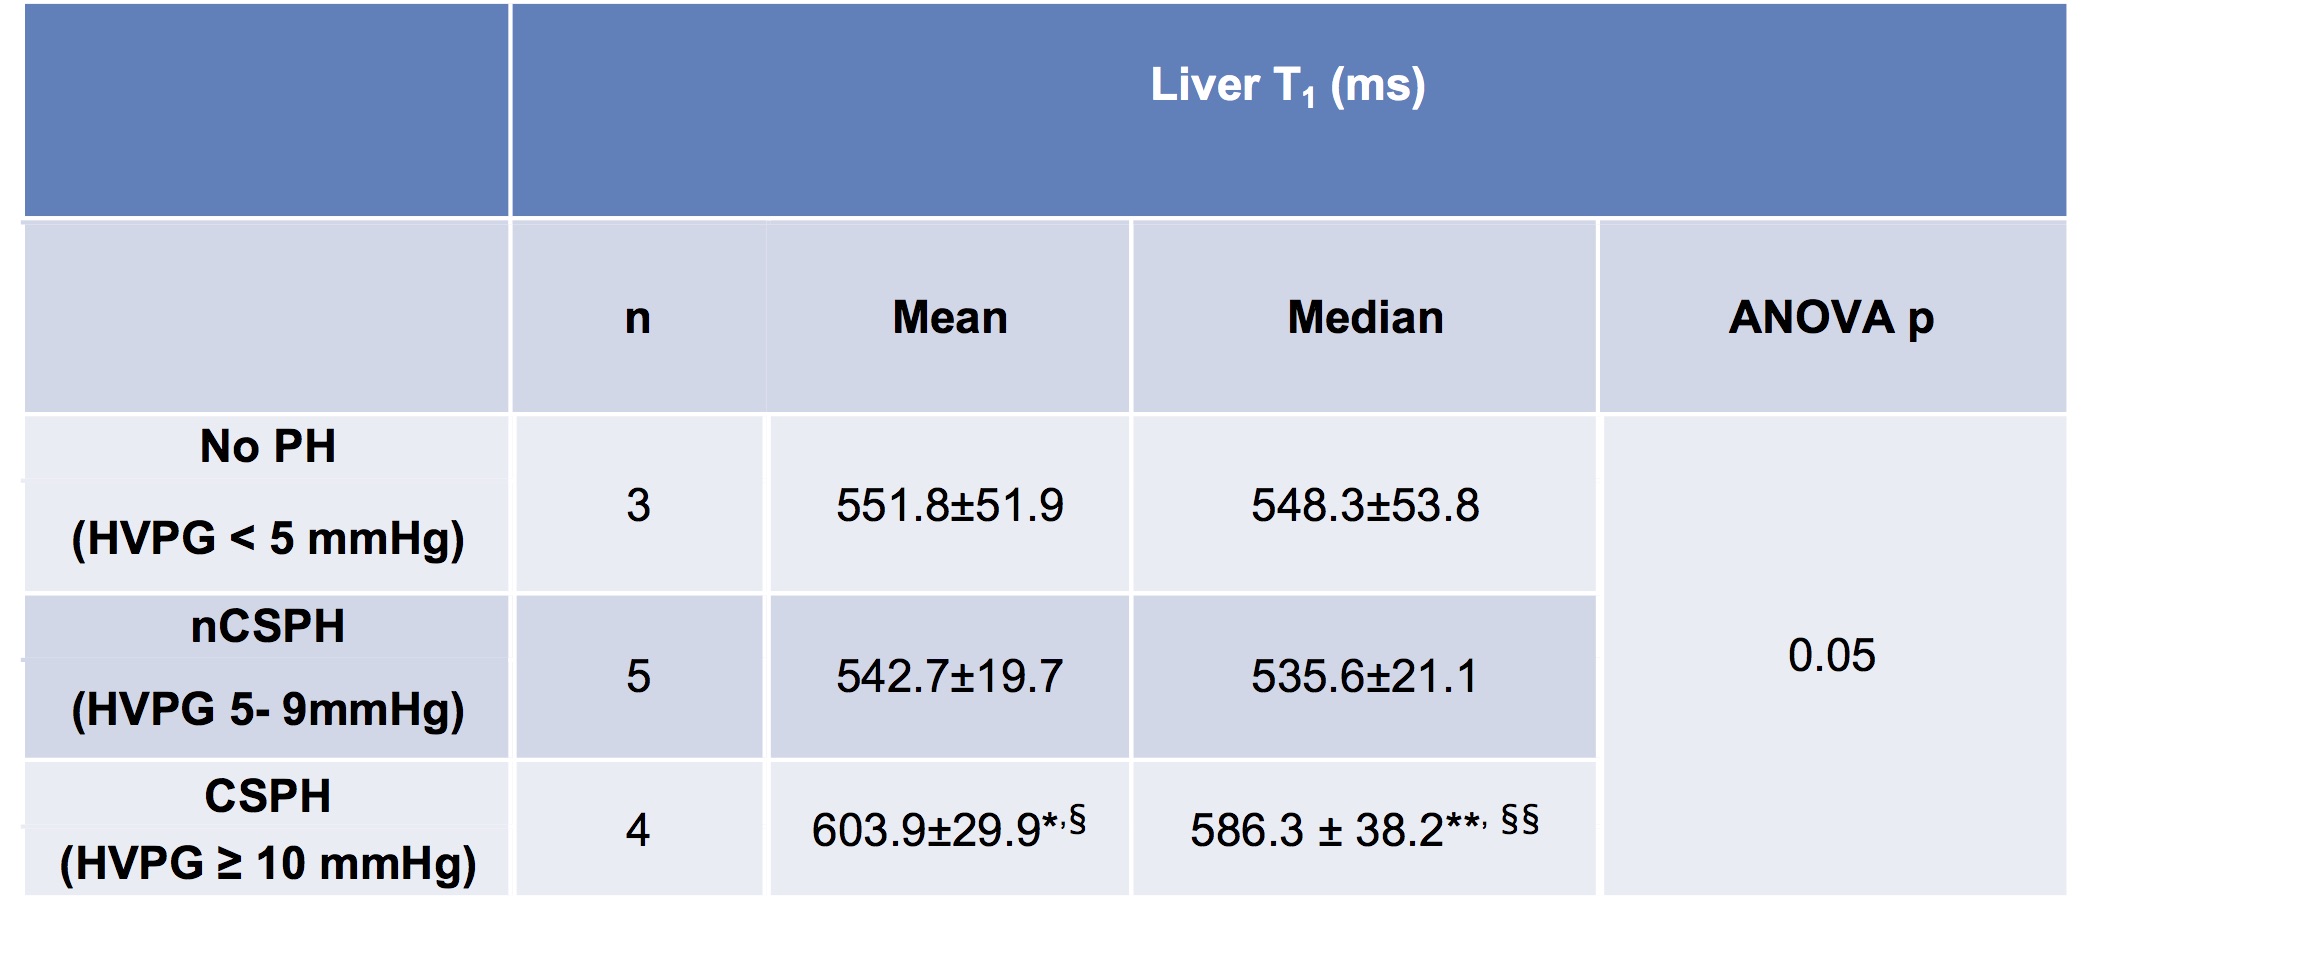
Table 1. Liver T1 values in patients with no portal hypertension (PH), non-clinically significant PH (nCSPH) and clinically significant portal hypertension (CSPH). ANOVA showed trend of significant differences in T1 values between groups.
* HVPG <10 mmHg vs. HVPG ≥10 mmHg (Mann-Whitney): p=0.0162
§ HVPG 5-9 mmHg vs. HVPG ≥10 mmHg (Mann-Whitney): p=0.0159
** HVPG <10 mmHg vs. HVPG ≥10 mmHg (Mann-Whitney): p=0.028
§§HVPG 5-9 mmHg vs. HVPG ≥10 mmHg (Mann-Whitney): p=0.0159