1796
Relationship between Brown Adipose Tissue and Intrahepatic Triglyceride in Children with Non-alcoholic Fatty Liver Disease1Department of Imaging and Interventional Radiology, The Chinese University of Hong Kong, Sha Tin, Hong Kong, 2Russell H Morgan Department of Radiology and Radiological Science, The Johns Hopkins University School of Medicine, Baltimore, MD, United States, 3Department of Paediatrics, The Chinese University of Hong Kong, Sha Tin, Hong Kong, 4Department of Clinical Oncology, The Chinese University of Hong Kong, Sha Tin, Hong Kong
Synopsis
This study reported preliminary results for relationship between brown adipose tissue (BAT) and intrahepatic triglycerides (IHTG) in young subjects and tested whether non-alcoholic fatty liver disease (NAFLD) affected the association among liver fat accumulation and the activity and volume of BAT. Results showed that T2* in BAT was significantly lower in non-NAFLD group possibly due to higher blood flow and iron concentration which further implied the possibility of higher activation state of BAT in non-NAFLD. Correlation analysis also indicated NAFLD possibly changed the association between body weight and accumulation of IHTG as well as the volume and activity of BAT.
INTRODUCTION
To study the relationship between brown adipose tissue (BAT) and intrahepatic triglyceride (IHTG) in young subjects with and without non-alcoholic fatty liver disease (NAFLD).METHODS
Forty-four subjects (female: 23, male: 21, mean age: 12.4 (±3.0), BMI: 22.9 (±5.5)) were recruited. Inclusion criteria were subjects between age of 6-18 years with no known liver diseases and ingestion of medications known to affect liver fat accumulation.
All subjects underwent MRI using a 3.0 T whole-body scanner (Achieva X-series, Philips Medical System, Best, The Netherlands) with a 16-channel SENSE-XL-Torso array coil. Water-fat and T2* images were obtained from the base of the skull to the base of the thoracic cavity for BAT measurement using the 3D spoiled chemical-shift water-fat sequence (TR = 5.7 ms, first TE/echo spacing = 1.2-1.4 (ms)/1.0-1.2 (ms), number of echoes = 6, flip angle = 3°, SENSE acceleration = 2). Image reconstruction was completed online using Philips mDixon product implementation with the seven-peak spectral model of fat to increase accuracy and sensitivity.
1H STEAM MR spectroscopy (TE = 15 ms, TR = 5000 ms, spectral width = 2000 Hz, no water suppression and eight signal averages) was used to obtain spectrum data for the measurement of intrahepatic triglycerides (IHTG). A 30x30x30-mm3 voxel was placed in the right liver lobe for signal acquisition. Data were exported for offline spectral analysis.
BAT at supraclavicular and axillary areas were measured using an in-house algorithm based on Gaussian mixture model (GMM) (1). This algorithm aimed to cluster brown and white adipose tissues independently from their tissues activation state. Two parameters fat-fraction and T2* values were regarded as co-factors to discriminate between BAT and WAT. Data were fit into GMM using expectation–maximization (EM) algorithm and clustered into brown and white adipose tissues for volumetric measurement. This algorithm has been validated and applied in previous studies (1,2).
IHTG was measured using jMRUI software package with the data obtained from 1H MRS (3). Water peak at 4.65 ppm and methylene lipid peak at 1.3 ppm were measured for relative fat signal amplitude in terms of a percentage of the total signal amplitude. IHTG content was calculated as [Ifat/(Ifat+Iwater)]x100 where Ifat and Iwater represented peak amplitudes of fat and water, respectively (4).
NAFLD was defined as IHTG content more than the threshold of 5.56%, alcohol consumption of no more than 30 g/day for males and 20g/day for females, no know liver diseases and no ingestion of medications known to produce hepatic steatosis (5). Based on the IHTG content, subjects were divided into NAFLD and non-NAFLD groups.
Differences between NAFLD and non-NAFLD groups were tested using non-parametric Mann–Whitney U test. Correlations among different variables were tested using Spearman's rank correlation coefficient. The level of significance was set at p<0.05. Continuous variables are expressed in median (IQR).
RESULTS
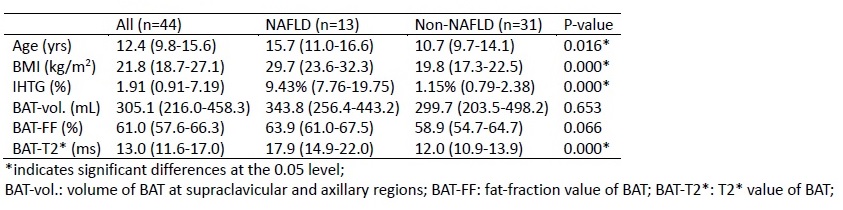
Spectrum analysis indicated that 13 subjects had IHTG content (9.43% (7.76-19.75)) higher than the threshold and were regarded as NAFLD while the other 31 subjects (1.15% (0.79-2.38)) were non-NAFLD. Between group comparisons indicated significant differences were observed in age (p=0.016), BMI (p<0.001), IHTG (p<0.001), and BAT-T2* value (p<0.001) between NAFLD and non-NAFLD groups as shown in Table 1.
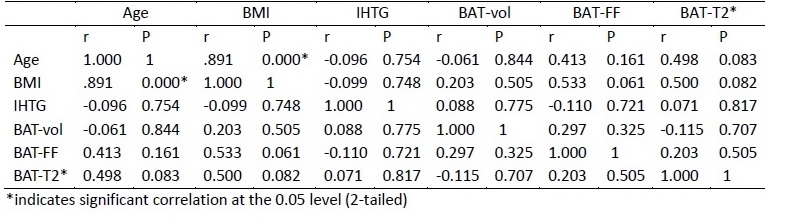
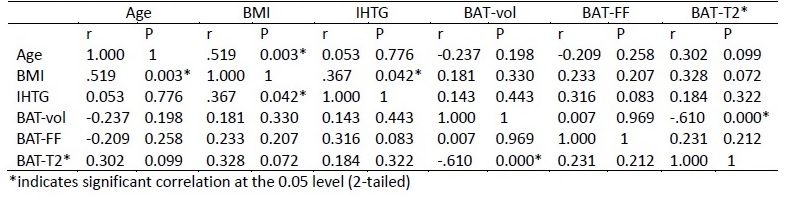
In the NAFLD group, significant linear correlation was observed between age and BMI (R=0.891, p<0.001). In the non-NAFLD group, significant correlations were found between age and BMI (R=0.519, p=0.003), IHTG and BMI (R=0.367, p=0.042) as well as BAT volume and BAT-T2* value (R=-0.610, p<0.001). Results from Spearman’s analysis are shown in Table 2a and 2b for NAFLD and non-NAFLD groups respectively.
DISCUSSION
This study reported preliminary results to investigate the relationship between BAT and IHTG in children with or without NAFLD. Despite no significant differences in BAT volume and fat fraction, significantly lower T2* value of BAT was observed in non-NAFLD as shown in table 1. We suspected that the decrease of T2* was possibly caused by the increase of iron concentration due to higher blood flow in BAT which could be a possible indicator of higher activation state in BAT. Significant differences in BMI and IHTG were expected due to the grouping criteria. Correlations were tested within NAFLD and non-NAFLD groups. IHTG was significantly correlated with BMI in non-NAFLD but not in NAFLD which hinted some mechanism behind NAFLD caused for the loss of relationship between body mass and liver fat accumulation. The inverse relationship between BAT volume and T2* value was observed only in non-NAFLD but not in NAFLD, suggesting BAT might be involved in the mechanism of IHTG accumulation.Acknowledgements
The work described in this paper was partially supported by grants from the Research Grants Council (Project No.: 14206716 and SEG_CUHK02) of the Hong Kong Special Administrative Region.References
1. Hui SCN, Ko JKL, Zhang T, Shi L, Yeung DKW, Wang D, Chan Q, Chu WCW. Quantification of brown and white adipose tissue based on Gaussian mixture model using water-fat and T2* MRI in adolescents. Journal of magnetic resonance imaging : JMRI 2017;46(3):758-768.
2. Hui SCN, Wong SKH, Ai Q, Yeung DKW, Ng EKW, Chu WCW. Observed changes in brown, white, hepatic and pancreatic fat after bariatric surgery: Evaluation with MRI. European radiology 2018.
3. Stefan D, Di Cesare F, Andrasescu A, Popa E, Lazariev A, Vescovo E, Strbak O, Williams S, Starcuk Z, Cabanas M, van Ormondt D, Graveron-Demilly D. Quantitation of magnetic resonance spectroscopy signals: the jMRUI software package. Meas Sci Technol 2009;20(10).
4. van Werven JR, Hoogduin JM, Nederveen AJ, van Vliet AA, Wajs E, Vandenberk P, Stroes ES, Stoker J. Reproducibility of 3.0 Tesla magnetic resonance spectroscopy for measuring hepatic fat content. Journal of magnetic resonance imaging : JMRI 2009;30(2):444-448.
5. Szczepaniak LS, Nurenberg P, Leonard D, Browning JD, Reingold JS, Grundy S, Hobbs HH, Dobbins RL. Magnetic resonance spectroscopy to measure hepatic triglyceride content: prevalence of hepatic steatosis in the general population. American journal of physiology Endocrinology and metabolism 2005;288(2):E462-468.
Figures