1795
Real World Experience Measurement of R2 vs R2 star in HemoglobinopathiesRiad Abou Zahr1, Barbara E U Burkhardt2, Lubaina Ehsan3, Zora R Rogers4, and Tarique Hussain5
1Radiology, University of Texas Southwestern Medical Center, Dallas, TX, United States, 2Universitäts- Kinderspital Zürich – Eleonorenstiftung, Zurich, Switzerland, 3Medical College, Aga Khan University, Karachi, Pakistan, 4Pediatrics (Hematology/Oncology), University of Texas Southwestern Medical Center, Dallas, TX, United States, 5Pediatrics & Radiology, University of Texas Southwestern Medical Center, Dallas, TX, United States
Synopsis
This study is a real world experience comparing liver iron concentration (LIC) estimation by R2* vs R2 method in 107 patients with hemoglobinopathies on chronic transfusion therapy. It demonstrates a strong correlation of R2* with R2 and furthermore highlights the advantageous short scan time of R2* in the pediatric age group.
Background
Non-invasive determination of cardiac and liver iron concentration (LIC) is a valuable tool to guide iron chelation therapy in chronically transfused patients. Multiple methods have been utilized to measure LIC by MRI. Ferriscan analysis of mean transverse relaxation rates R2 (1/T2) is a well-established and accurate method, that is commercially available1. In this study, we compared R2* (1/T2*) to R2 method for clinical (non-research) purpose estimation of LIC.Methods
107 consecutive patients underwent clinical liver and some cardiac MRI scans from April 2016 to May 2018 on a Phillips 1.5 T scanner. Free breathing T2 and T2* weighted images were acquired on each patient. For T2, multi-slice spine echo sequences were obtained with TR 1000 ms and echo times of 6, 9, 12, 15 and 18 ms. For T2*, a single slice fast gradient echo was performed with TR 13 ms, and 10 echo times starting at 0.6 ms with 1.2 ms increments with signal averaging. R2 measurements were performed by Ferriscan analysis utilizing voxel summation of transverse relaxation rates. R2* measurements were performed by quantitative T2* map analysis using Circle Cardiovascular Imaging Inc. software after curve fitting and validation of the original data was performed using Osirix software.Results
107 patients underwent liver scans with the following diagnoses:76 sickle cell anemia, 20 Thalassemia, 9 malignancies and 2 Blackfan Diamond anemia. Mean age was 12.5 ±4.5 years with a range of 2 – 24 years. Nominal scan time for the five R2 sequences was 10 minutes while R2* sequence time was 20 seconds. R2* estimation of LIC correlated closely with R2 with a correlation coefficient of 0.94 and regression slope of 1.01 (Figure 1). Agreement of R2 and R2* was strongest for LIC < 15 mg/g dry weight which is the cut off for severe iron loading. For LIC > 15 mg/g dry weight, the classification error of R2* method was 2.8% giving an accuracy of 97%. Overall bias from Bland-Altman plot was 0.66 with a standard deviation of 2.8 and 95% limits of agreement -4.8 to 6.1 (Figure 2). Twelve patients (11 %) with severe liver iron loading underwent additional cardiac iron quantification via T2* per hospital protocol. Only 2 had T2* < 10 ms indicating severe cardiac iron loading.Conclusion
LIC estimation by R2* correlates well with R2-Ferriscan in the pediatric age group. Some scatter is observed at higher iron levels but with a low R2* classification error rate. R2* method is highly advantageous in children due to the very short scan time which allows imaging of young patients without sedation or anesthesia. Using the same measurement method ensures consistency in guiding chelation therapy. Cardiac involvement in our cohort of children and young adults was uncommon.Acknowledgements
No acknowledgement found.References
1. St Pierre et al. Blood. 2005 Jan 15;105(2):855-61Figures
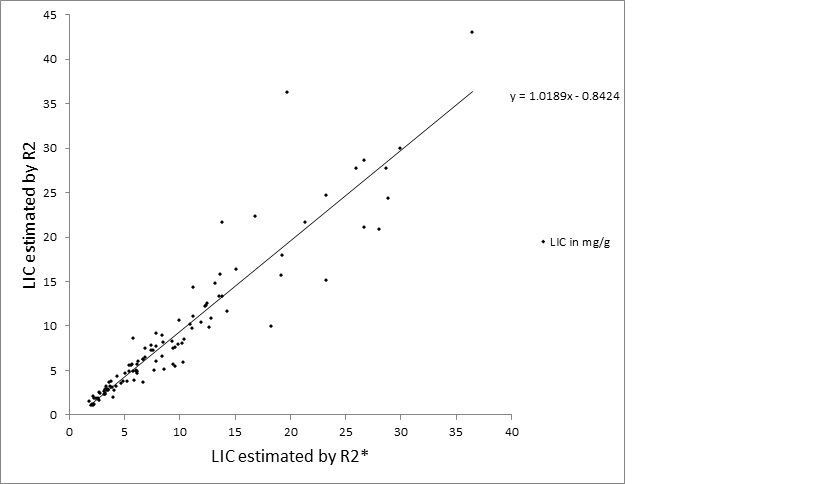
Scatter plot of liver iron concentration (LIC) by R2* vs R2.
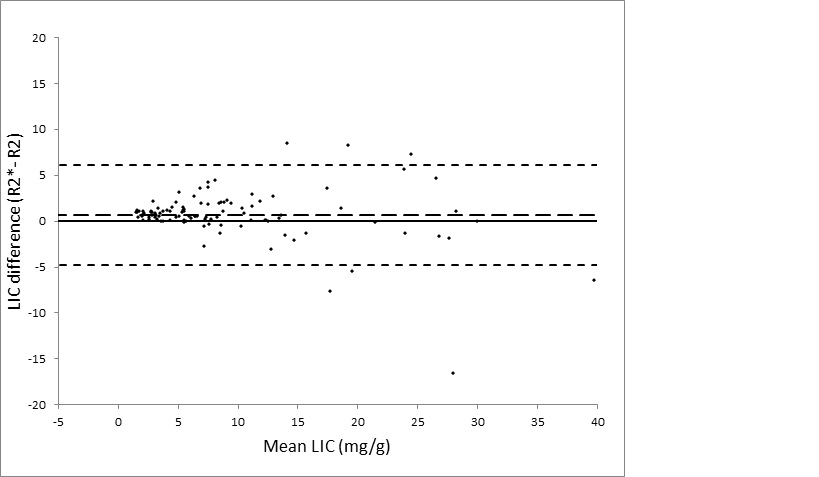
Bland Altman Plot demonstrates the difference between LIC by R2* and LIC by R2.