1794
Patient free-breathing Quantitative T2 Mapping in the Pancreas1Radiology, Lausanne university hospital, Lausanne, Switzerland, 2Advanced Clinical Imaging Technology, Siemens Healthcare AG, Lausanne, Switzerland, 3LTS5, École Polytechnique Fédérale de Lausanne, Lausanne, Switzerland, 4Center for Biomedical Imaging (CIBM), Lausanne, Switzerland, 5Siemens Healthcare GmbH, Erlangen, Switzerland
Synopsis
In this study, we test the feasibility of free-breathing quantitative T2 measurement in the pancreas and we correlate T2-values with demographical and clinical parameters in 88 patients whom were subject to a liver MRI. We found that using a 10-fold accelerated multi-echo-spin-echo MRI prototype sequence at 3T, we were able to measure pancreatic T2-values in a short acquisition time, with low variability and a good inter-reader agreement. We found significant differences in T2-values depending on age, measurement location, main pancreatic duct dilatation and diffuse pancreatic disease.
Introduction
Unlike conventional MR sequences, which evaluate morphological alterations, T2 mapping, or T2 relaxometry, enables the quantification of the transverse relaxation time of the underlying tissues1. This quantitative evaluation is assumed to be more sensitive and reproducible than the visual assessment of T2 weighted MR images for the identification of small contrast changes (e.g. tissue edema)2. Moreover, due to the comparability of the absolute quantitative measures, it is possible to establish normative value ranges for different organsT2 mapping has already been introduced in clinical practice for various organs, e.g. brain3–5, heart6 and cartilage7–9.
The application of T2 mapping in the abdomen has been proven more difficult because of the physiological movement of the abdominal organs with the respiratory cycle, as well as bowel peristalsis, which may result in motion artifacts. However, the technique has already been successfully applied in the liver for diffuse liver disease, such as iron overload10.
Although pancreatic T2 mapping has been successfully performed in a few volunteers at 1.5 and 3T11–13, the technique has not yet been investigated in patients. Furthermore, since motion artifacts are invariably associated with the long acquisition times of quantitative imaging, T2 mapping in abdominal organs has not been widely performed. However, recent work validated the use of a novel quantitative MRI sequence for T2 mapping in the brain, that drastically shortened the acquisition time compared to previously used methods14. A similar strategy may enable reproducible T2 mapping in moving abdominal organs as well. The aim of our study was to test the feasibility of free-breathing quantitative T2 measurement in the pancreas and correlate T2-values with age, body mass index, measurement location, main pancreatic duct dilatation and underlying pathology.
Methods
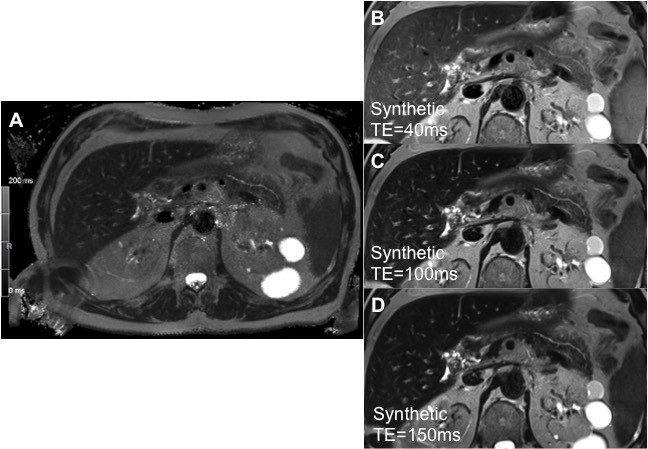
This retrospective single center pilot study included 88 consecutive adult patients (M/F: 42/46, mean age 57 yo) who underwent a dedicated liver magnetic resonance imaging (MRI) protocol including a prototype T2-mapping sequence using an accelerated multi-echo-spin-echo sampling with respiratory trigger. Patients in whom the identification of the pancreas parenchyma on the MR images was impossible were excluded (n=5). Quantitative maps were reconstructed by employing a combination of GeneRalized Auto-calibrating Partially Parallel Acquisition (GRAPPA) and Model-based Accelerated RelaxomeTry by Iterative Non-linear Inversion (MARTINI), dubbed “GRAPPATINI”. The technique also allowed multiple synthetic reconstructions of T2 weighted images at different TE times (at 40, 100 and 150ms).
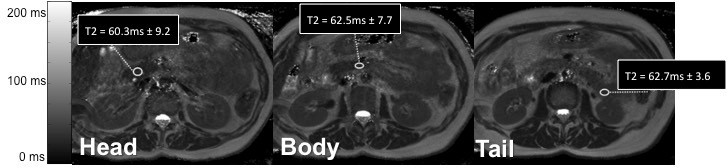
Two radiologists independently delineated three regions of interest inside the head, body and tail of the pancreas for each acquisition. The mean and standard deviation of T2-values within these regions were measured for all patients (Fig. 1). Variation of T2-values with demographic data, intraparenchymal location, presence of pancreatic duct dilation and underlying pancreatic disease was assessed. The electronic patient charts were then reviewed in order to collect demographic and clinical data: sex, age, BMI, and any possible diffuse/focal pancreatic disease. Inter-reader reliability was determined by calculating the interclass coefficient. T2-values were compared intra-patient between different pancreatic locations (ANOVA). Inter-patient correlations between T2-values and demographical, clinical and radiological data were calculated (ANOVA).
Results
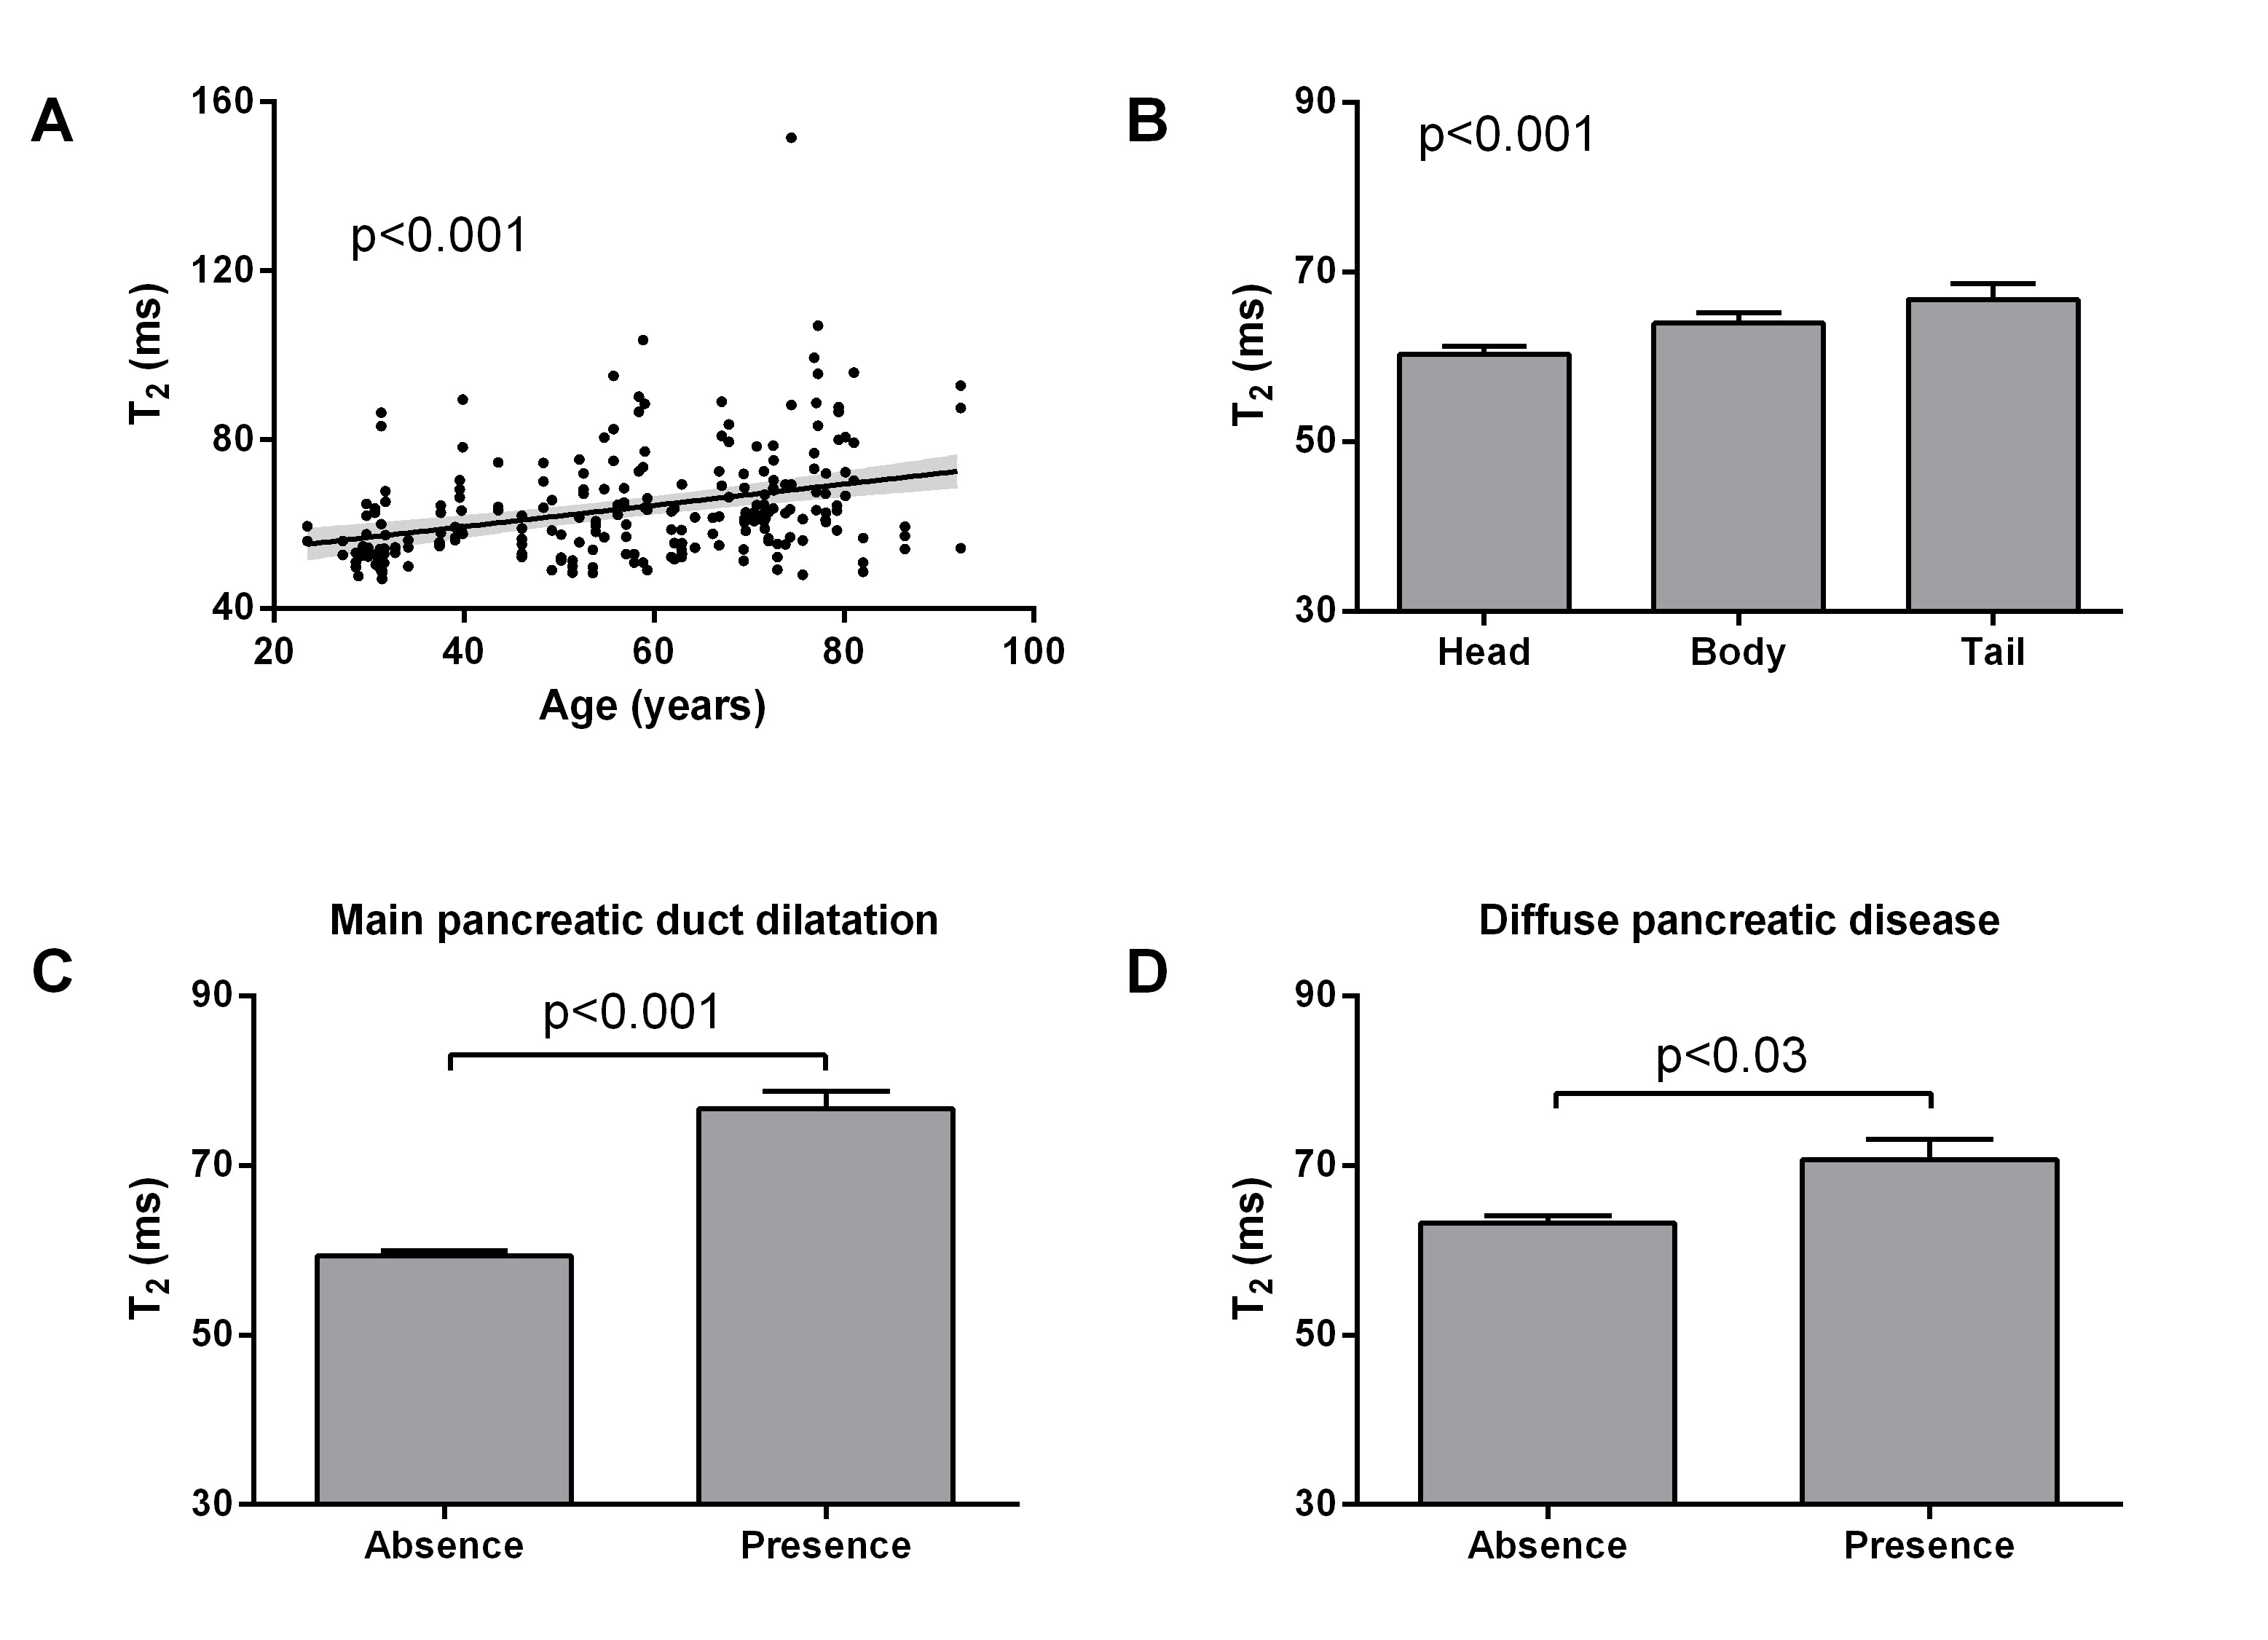
The accelerated T2 mapping sequence was successfully performed in all patients with a mean acquisition time of 2:48 ± 0:43 min (Fig. 2). Low variability in T2-values was observed across all patients (inter-subject) with standard deviations less than 24% (head: 60.2±8.3ms, body: 63.9±11.5ms, tail: 66.8±16.4ms). Inter-reader agreement was good (interclass correlation coefficient 0.82 (95% CI: 0.77-0.86)). We found significant differences in T2-values depending on age (p<0.001), measurement location (p<0.001), main pancreatic duct dilatation (p<0.001) and diffuse pancreatic disease (p<0.03) (Fig. 3).Discussion
The scan times in this study were shorter than in a comparable study (8min versus 2:48min)11. The pancreatic T2-values found in our study were in line with literature values obtained with similar T2 mapping techniques at 1.5T (MESE sequence) 11. In contrast, T2 values were longer in comparison to studies using sequences with other acquisition techniques (HASTE and/or balanced steady state free procession), which are reported to be sensitive to B1 and B0 inhomogeneity at 1.5 and 3T 12,13. Correlation with demographical, clinical and radiological data has to be confirmed with larger cohort.Conclusion
The feasibility of accelerated T2 mapping at 3T in moving abdominal organs was demonstrated in the pancreas. T2-values in the healthy pancreas with a short acquisition time (2:48 min) were reproducible across subjects. In the pancreatic parenchyma, T2-values were significantly dependent on demographical and clinical parameters.Acknowledgements
No acknowledgement found.References
1. Cassinotto, C. et al. MR relaxometry in chronic liver diseases: Comparison of T1 mapping, T2 mapping, and diffusion-weighted imaging for assessing cirrhosis diagnosis and severity. Eur. J. Radiol. 84, 1459–1465 (2015).
2. Blystad, I. et al. Quantitative MRI for analysis of peritumoral edema in malignant gliomas. PloS One 12, e0177135 (2017).
3. Bauer, S. et al. Quantitative T2’-mapping in acute ischemic stroke. Stroke 45, 3280–3286 (2014). 4. Seiler, A. et al. Complete Restitution of the Ischemic Penumbra after Successful Thrombectomy : A Pilot Study Using Quantitative MRI. Clin. Neuroradiol. (2018). doi:10.1007/s00062-018-0675-3
5. Sollmann, N. et al. High Isotropic Resolution T2 Mapping of the Lumbosacral Plexus with T2-Prepared 3D Turbo Spin Echo. Clin. Neuroradiol. (2018). doi:10.1007/s00062-017-0658-9
6. Spieker, M. et al. T2 mapping cardiovascular magnetic resonance identifies the presence of myocardial inflammation in patients with dilated cardiomyopathy as compared to endomyocardial biopsy. Eur. Heart J. Cardiovasc. Imaging 19, 574–582 (2018).
7. Nguyen, J. C., Liu, F., Blankenbaker, D. G., Woo, K. M. & Kijowski, R. Juvenile Osteochondritis Dissecans: Cartilage T2 Mapping of Stable Medial Femoral Condyle Lesions. Radiology 171995 (2018). doi:10.1148/radiol.2018171995
8. Albano, D. et al. T2-mapping of the sacroiliac joints at 1.5 Tesla: a feasibility and reproducibility study. Skeletal Radiol. (2018). doi:10.1007/s00256-018-2951-3
9. Pachowsky, M. L. et al. Quantitative T2 Mapping Shows Increased Degeneration in Adjacent Intervertebral Discs Following Kyphoplasty. Cartilage 1947603518758434 (2018). doi:10.1177/1947603518758434
10. Ruefer, A. et al. Role of liver magnetic resonance imaging in hyperferritinaemia and the diagnosis of iron overload. Swiss Med. Wkly. 147, w14550 (2017).
11. Upadhyay, J. et al. Prospective Assessment of Variability and Reproducibility of Diffusion-Weighted MRI and T2-Mapping of the Pancreas in Healthy Volunteers. J. Med. Imaging Case Rep. 01, (2017).
12. de Bazelaire, C. M. J., Duhamel, G. D., Rofsky, N. M. & Alsop, D. C. MR imaging relaxation times of abdominal and pelvic tissues measured in vivo at 3.0 T: preliminary results. Radiology 230, 652–659 (2004). 13. Hoad, C. L., Cox, E. F. & Gowland, P. A. Quantification of T(2) in the abdomen at 3.0 T using a T(2)-prepared balanced turbo field echo sequence. Magn. Reson. Med. 63, 356–364 (2010).
14. Hilbert, T. et al. Accelerated T2 mapping combining parallel MRI and model-based reconstruction: GRAPPATINI. J. Magn. Reson. Imaging JMRI (2018). doi:10.1002/jmri.25972
Figures