1781
Stretched exponential diffusion-weighted imaging model in quantitative diagnosis of nonalcoholic fatty liver disease : a rabbit model study1XiangYa school of medicine, Central South University, Changsha, China, 2Clinical Medical School of Yangzhou University, Northern Jiangsu People’s Hospital, Yangzhou, China, 3GE Healthcare,MR Research China, beijing, China
Synopsis
We aimed to investigate if a stretched exponential diffusion weighted imaging model (SEM) can be applied to assess nonalcoholic liver disease (NAFLD) disease by providing distributed-diffusion-coefficient (DDC) and α separately evaluating mean intravoxel diffusion rate and diffusion heterogeneity. The SEM model was then applied to analyze NAFLD in a rabbit model and compared with a mono-exponential (ME) model. While DDC from the SEM model showed comparable values with apparent-diffusion-coefficient (ADC) estimated in the ME model, alpha indicated more robust performance in the diagnosis of nonalcoholic steatohepatitis (NASH). Therefore, SEM model showed a great potential in early diagnosis of NASH.
Introduction
Nonalcoholic fatty liver disease (NAFLD) is defined as the accumulation of lipid in liver ranging from simple steatosis to steatohepatitis (NASH). Previous studies have reported that ADC has an inverse relationship with hepatic fat content1. While ADC, obtained from a ME model, reflects water molecular diffusion by assuming a Gaussian-distribution. The stretched exponential model, making no assumption regarding tissue compartmentalization, may have additional potential in the analysis of steatohepatitis2. So far, to our knowledge, no study has reported the SEM model in the severity assessment of NAFLD. Therefore, in this study, we aimed to investigate the feasibility of SEM model in quantitative diagnosis of NAFLD. The DDC and water-molecular-diffusion-heterogeneity-index (α) were obtained in the SEM model and compared ADC in the ME model.Rabbit model
Thirty-two male New Zealand rabbits (2.5kg each) were divided into 5 groups. Among them, six rabbits were fed a standard diet for 3 weeks. The rest twenty-six rabbits in other four groups were fed a high fat and cholesterol diet (including six with high fat diet for 1 week, six with high fat diet for 3 weeks, six with high fat diet for 4 weeks and eight with high fat diet for 8 weeks).MR experiments
All experiments were performed on a 3.0 T clinical scanner (Discovery 750w, GE Healthcare, USA) equipped with a GEM-flex 16-chanels surface-coil. A diffusion weighted imaging technique with twelve b-values (0, 25, 50, 75, 100, 150, 200, 300, 400, 500, 600, 800sec/mm2) was employed for liver imaging, in which scan repetitions were 4 for b-values between 0 and 100sec/mm2 and between 500 and 600sec/mm2, were 2 for b-values between 100 and 400sec/mm2, and were 8 for b-value of 800sec/mm2. Other scan parameters were of repetition time/echo time 2500/77.4ms, matrix 128×128, slice thickness 3.0mm, and FOV 15.0mm×10.0mm. The acquisition time was 5 minutes 38 seconds.Data analysis
All data were processed at a GE workstation (AW4.6; GE Medical Systems).
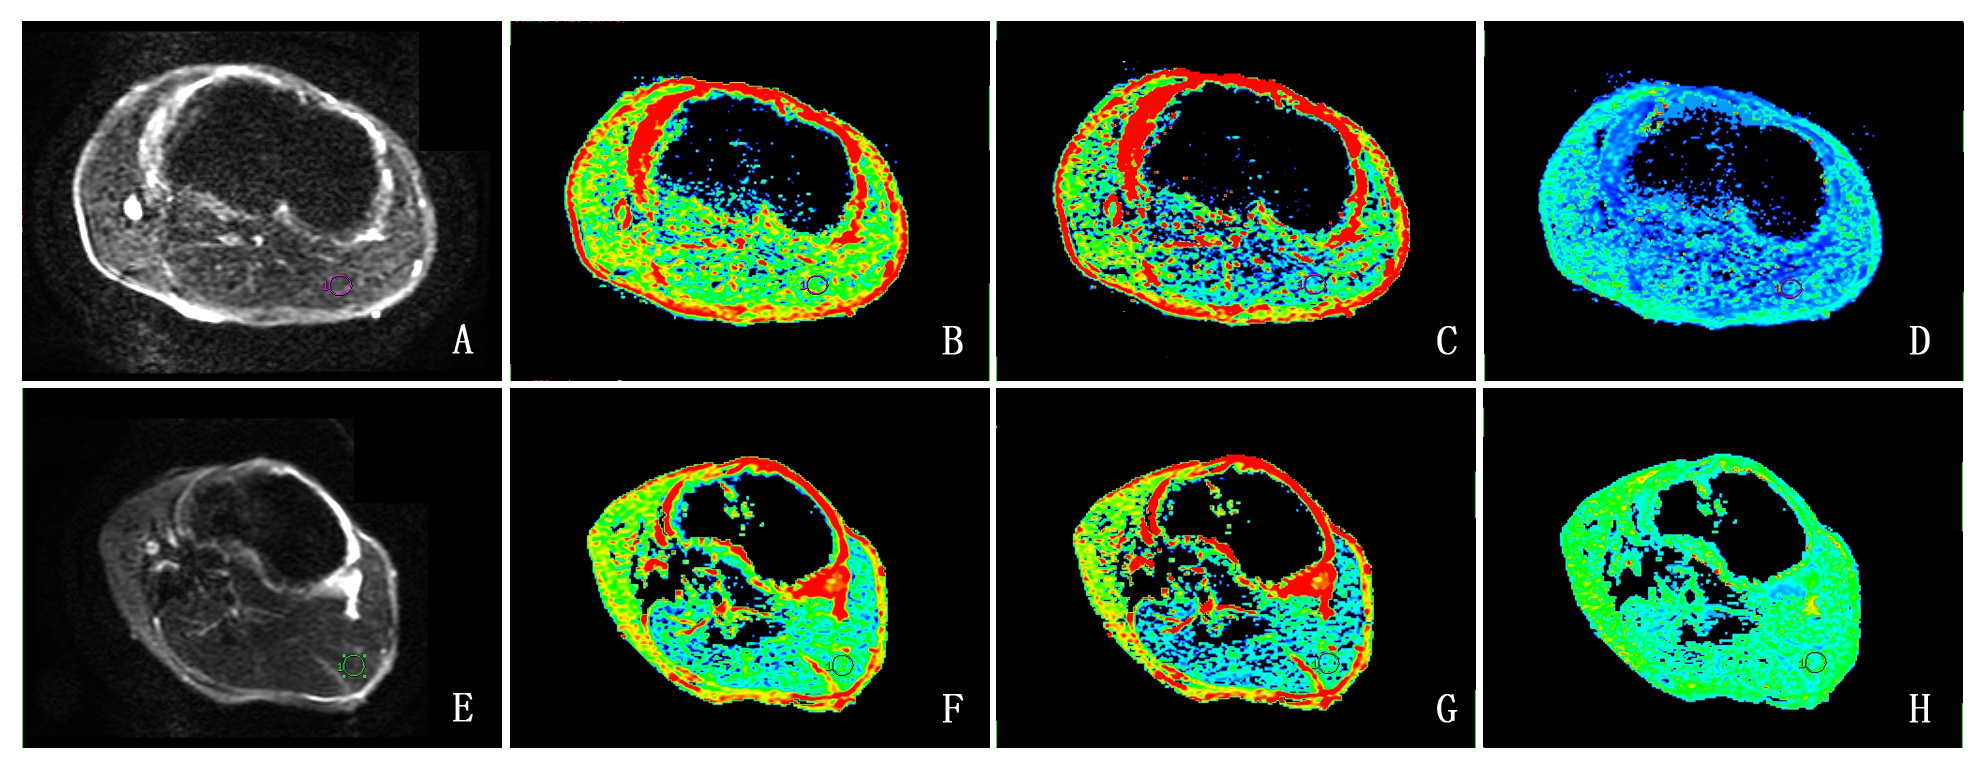
The acquired DWI images were analyzed using the SEM model. The DDC and α were obtained by equation 1: S(b)/S(0)=exp[-(b·DDC)α] [Eq.1], where α varies from 0 to 1, being related to intravoxel water molecular diffusion heterogeneity, and DDC represents the mean intravoxel diffusion rate.
For comparison, ME model was also applied for ADC calculation using the equation 2: S(b)/S(0)=exp(-b·ADC) [Eq.2], where S(0) represents the signal intensity in the absence of diffusion sensitization, and S(b) represents the corresponding signal intensity at different b values.
Histological analysis
Liver samples were obtained and the specimens were stained with haematoxylin-eason and Masson’s trichrome. In histological analysis, the liver samples were categorized as normal (NAS=0), simple-steatosis (NAS=1,2), borderline(NAS=3,4) and NASH (NAS≥5) according to NASH CRN-NAS scoring system.Statistical analysis
All statistical analyses were performed using SPSS software version-21.0. One-way-analysis-of-variance was performed to identify significant difference among different groups of NAFLD and least-significant-difference-test was utilized for post-hoc analysis. Spearman rank correlation analysis was used to estimate the correlation between DDC, α, ADC with the severity of NAFLD. In addition, characteristic operating curve (ROC) was applied to evaluate the diagnostic efficiency of DDC, α, ADC for NASH. The significant threshold was set as P=0.05.Results
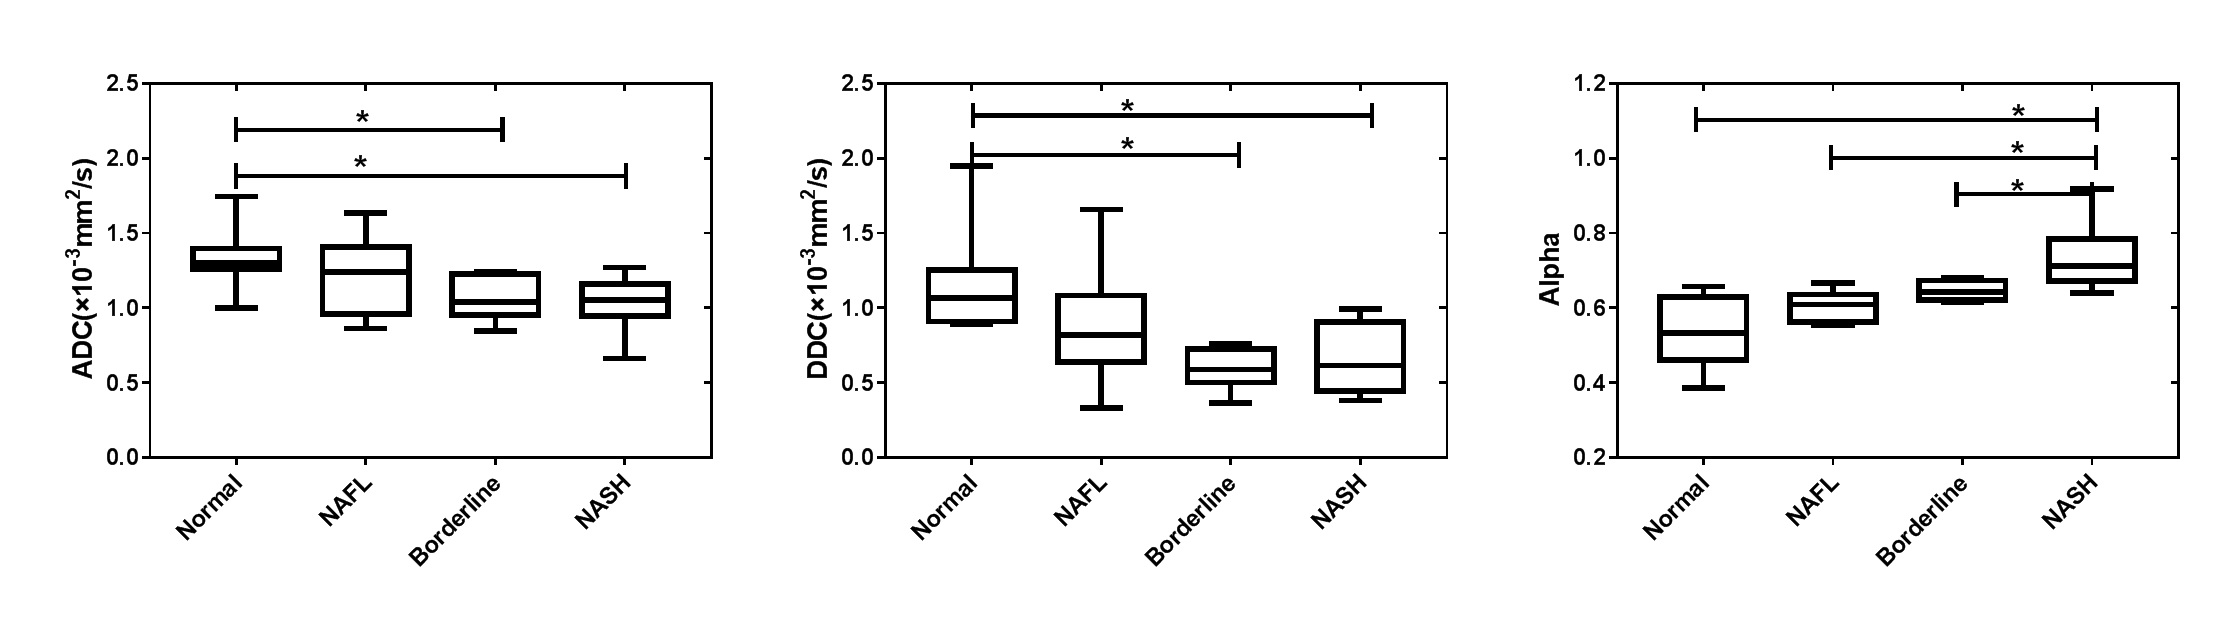
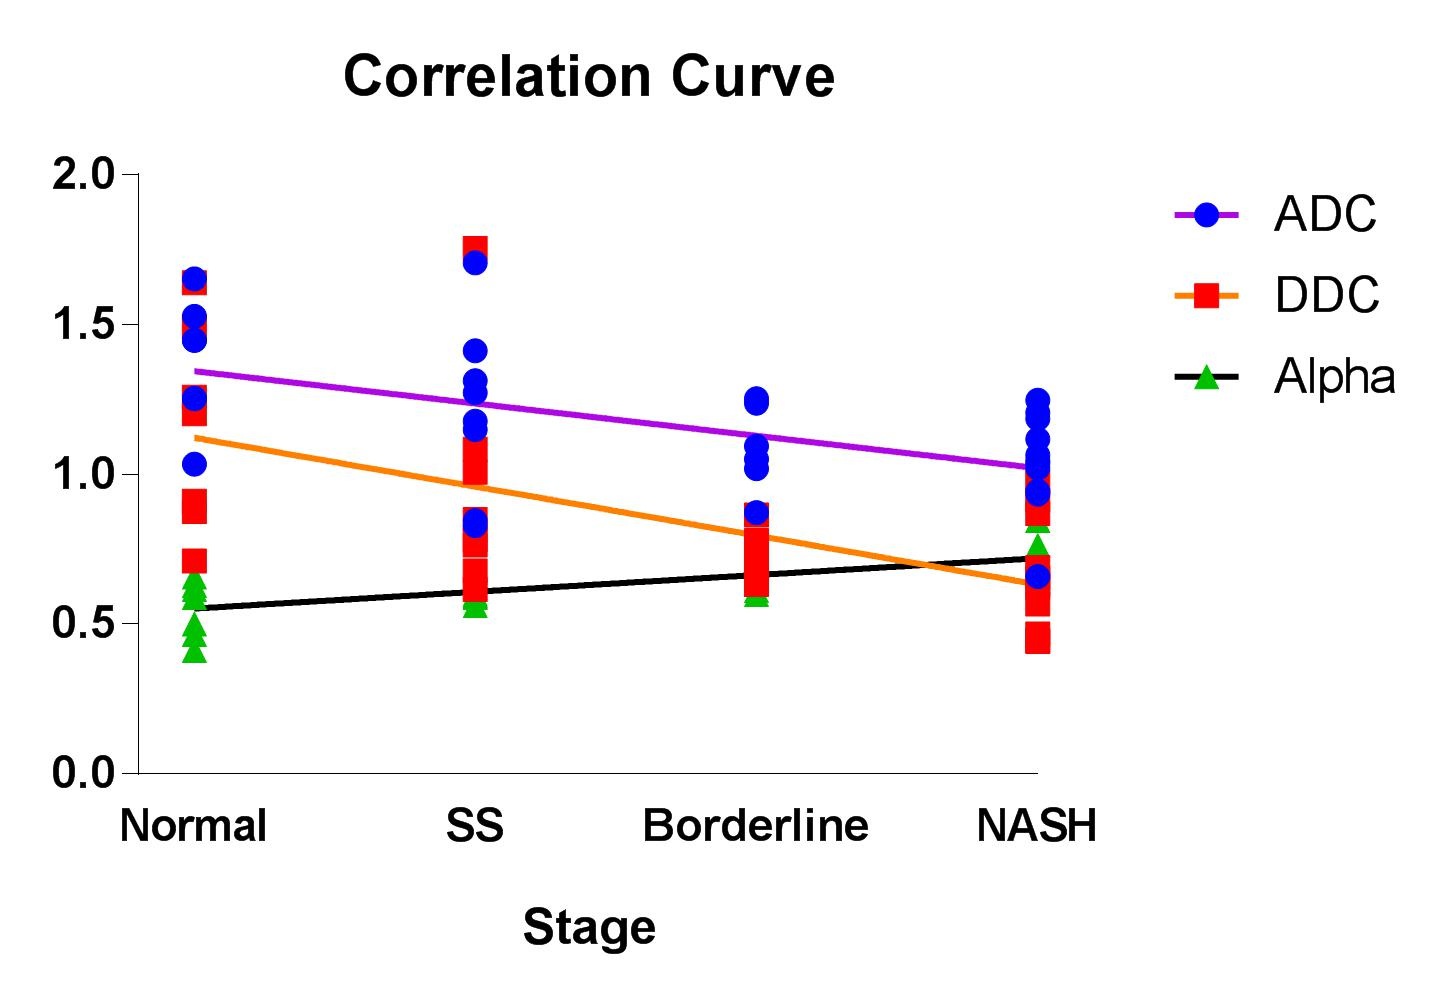
Both ADC and DDC showed significant inverse relationships (P<.05) with the severity of NAFLD (Figs.1-3). The separate correlation coefficients were -0.552 and -0.596. However, for α, a positive correlation (r=0.729; P< .05) was found with the progress of NAFLD, and a significant difference was observed between borderline and NASH groups.
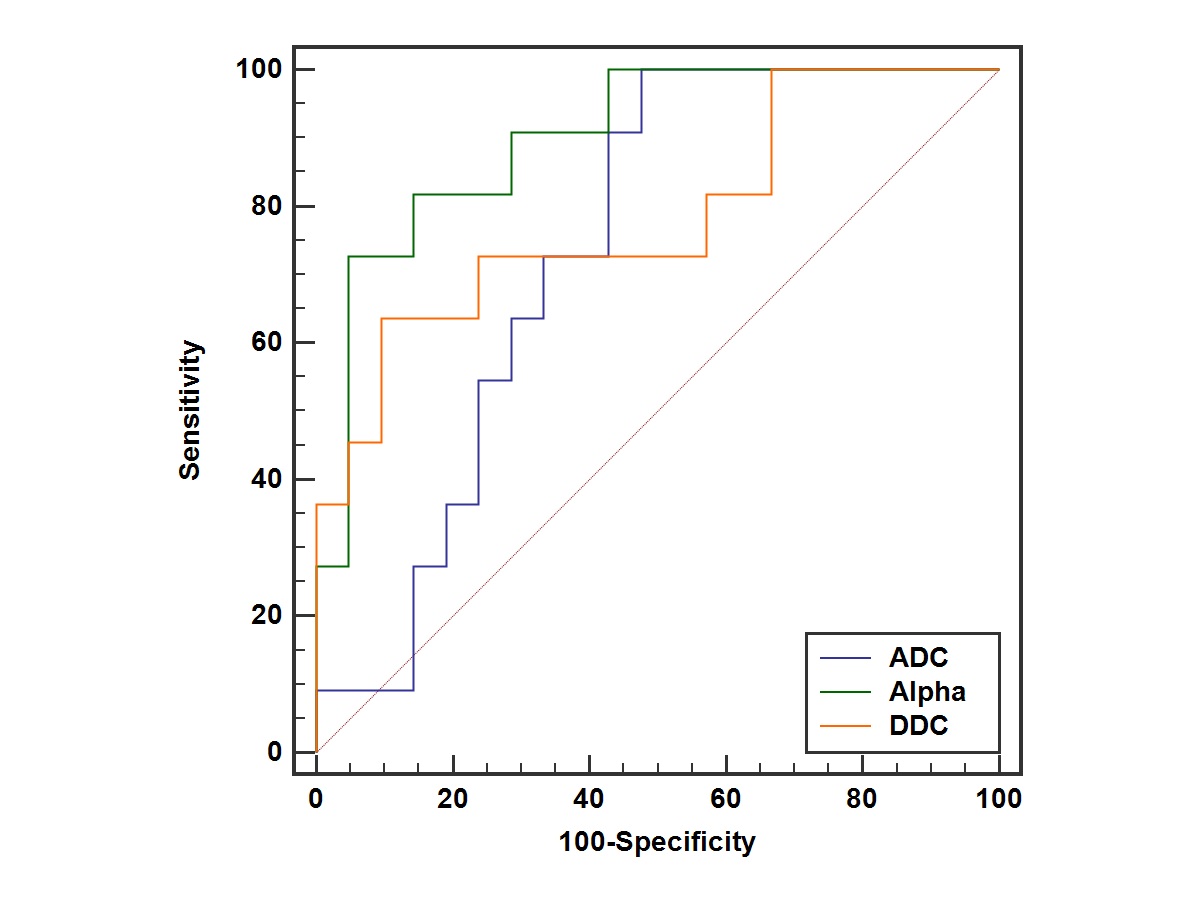
In addition, the area-under-the-receiver-operating-characteristic-curve (AUC) was calculated for ADC, DDC and α, respectively (Fig.4). While comparable AUC values for DDC and ADC were showed (0.736 vs 0.784), the largest AUC value was observed in α (0.900; P<.05), indicating the most robust diagnosis for NASH. .
Discussion and conclusion
In this study, SEM model was applied to assess the severity of NAFLD in a rabbit model. While comparable behavior was found in DDC from SEM model and ADC in the ME model, alpha obtained in SEM model showed the best performance in NASH diagnosis, indicating that alpha for diffusion heterogeneity can be a potential index in stratifying NAFLD. Additionally, as the aggravation of NAFLD, fat accumulation, hepatocyte ballooning and perivascular fibrosis increase tissue heterogeneity3. While, previous study showed perfusion fraction was decreased in the progress of NAFLD, we assume that heterogeneity in fluid viscosity have more influence on α than that of tissue heterogeneity. Thus, α showed a postitive correlation with the severity of NAFLD. In conclusion, we therefore can demonstrate that the SEM model, offering DDC and alpha estimation, has great potential in accurate assessment of NAFLD and in the differentiation NASH from simple steatosis.Acknowledgements
Funded by the Youth Project from Department of Science and Technology of Jiangsu (BKM20160450); Top Six Talent SummitProject of Jiangsu Province Human Resources and Social Security Department (2016-WSN-277).References
1. Joo I, Lee JM, Yoon JH, Jang JJ, Han JK, Choi BI. Nonalcoholic Fatty Liver Disease: Intravoxel Incoherent Motion Diffusion-weighted MR Imaging-An Experimental Study in a Rabbit Model. Radiology 2014;270(1):131-140.
2. Anderson S, Barry B, Soto J, Ozonoff A, O'Brien M, Jara H. Characterizing non-gaussian, high b-value diffusion in liver fibrosis: Stretched exponential and diffusional kurtosis modeling. Journal of magnetic resonance imaging : JMRI 2014;39(4):827-834.
3. Hu G, Liang W, Wu M, Chan Q, Li Y, Xu J, Luo L, Quan X. Staging of rat liver fibrosis using monoexponential, stretched exponential and diffusion kurtosis models with diffusion weighted imaging- magnetic resonance. Oncotarget 2018;9(2):2357-2366.
Figures