1780
Color-Encoded Multiparametric 3D Fast Dixon1Radiology, University of Miami Miller School of Medicine, Miami, FL, United States, 2Radiology, University of Mississippi Medical Center, Jackson, MS, United States
Synopsis
We developed a novel color-encoding technique for Dixon imaging that combines in-phase, out-of-phase and water images into a single intuitive color image. We demonstrate its potential to facilitate interpretation of these complex information-rich datasets, reduce the number of requisite images to be stored and reviewed, and thereby extend Dixon’s clinical utility across the body.
Introduction
3D fast Dixon is a rapid MRI technique that uses the difference in resonant frequencies of water and fat to acquire in-phase (IP) and out-of-phase (OP) images and derive water (W) and fat (F) images.1 The technique, often performed in a breath hold, has increasingly become a mainstay for body imagers and can help identify and characterize focal lesions and assess for steatosis or excess iron in the liver and other organs. However, the quantity of images produced makes interpretation difficult and time-consuming and may become truly herculean when multi-phasic exams and multiplanar reconstructions are performed.
Beyond the abdomen, Dixon sequencing primarily substitutes for chemical-shift fat saturation due to its relative insensitivity to magnetic susceptibility. For this fat suppression use case, typically only W images are reviewed and little attention is paid to the IP, OP and F images. Consequently, potentially important information contained in the IP, OP, and F images may be overlooked.2
While grayscale display remains dominant in diagnostic imaging, use of color has made inroads over the past few decades including recent advances in multiparamteric map visualization.3 Weiss et al. described color-encoding Dixon images of the spine using W and F images. Their technique, however, did not incorporate potentially important IP and OP data.
Methods
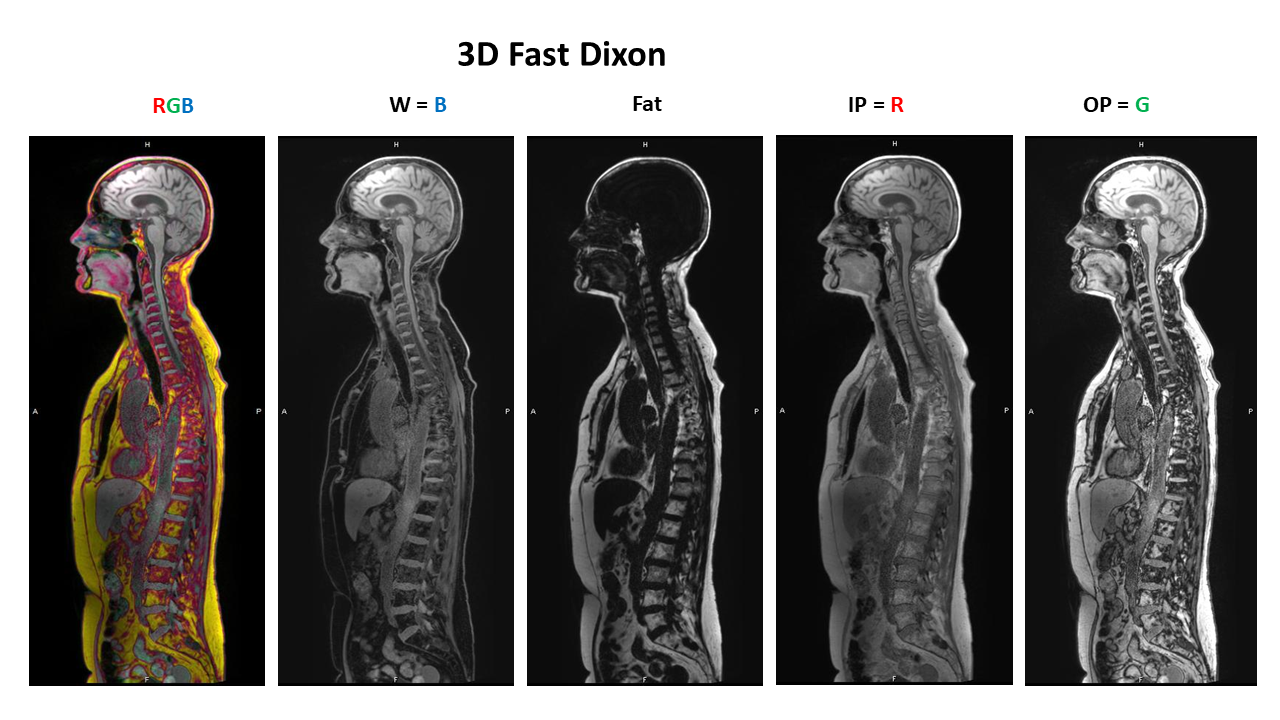
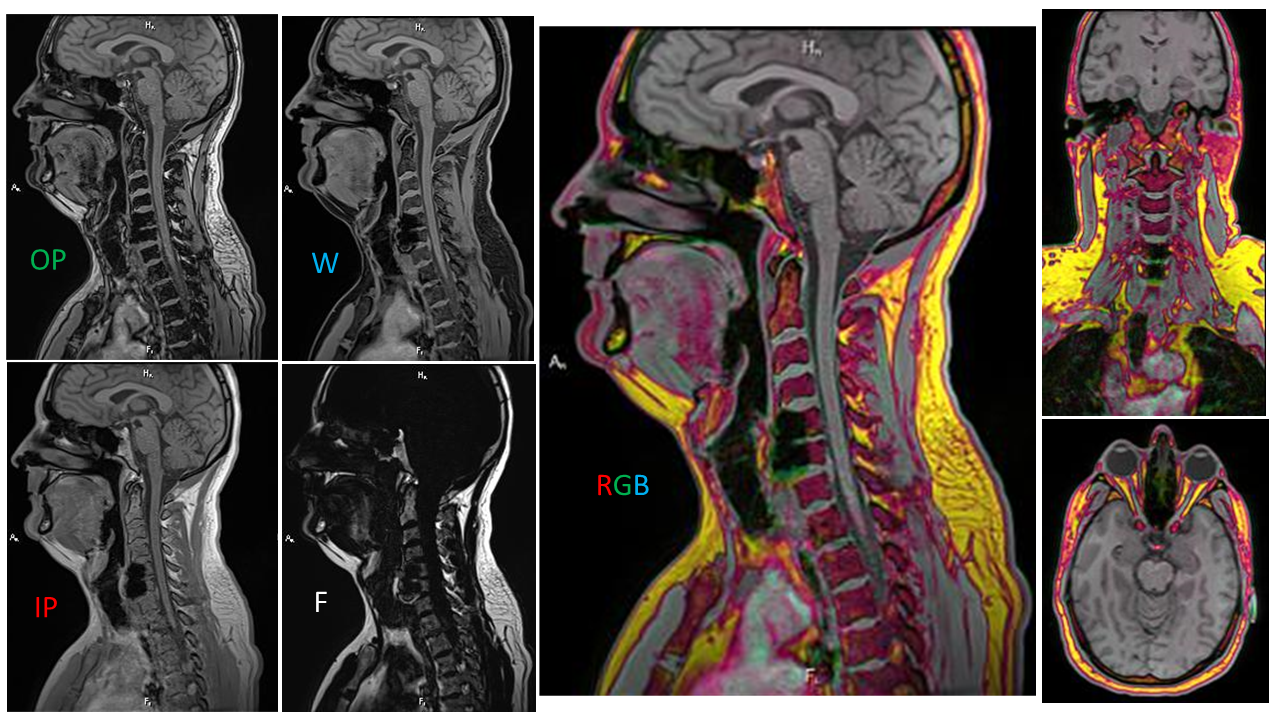
Tissues containing only W signal (e.g. normal brain, spinal cord, and liver) typically demonstrate similar OP, IP, and W signal intensities on Dixon imaging. Simple assignment of these to the red (R), green (G) and blue (B) color channels will therefore produce shades of grey in these tissues. Any of six simple assignments are possible. A Matlab program was created to generate color DICOM composite images and applied to representative Dixon datasets. Based on subjective preferences and theoretical considerations2, the illustrated color scheme (OP=R, IP=G, W=B) was selected as default. (Fig. 1).
We then color-encoded additional 3D fast Dixon cases obtained from teaching files that contained OP, IP, W, and F images. All available images had been obtained on Siemens scanners. Exams performed at 1.5 T had dual TEs of 2.4 and 4.6ms; and at 3.0T had dual TEs of 1.2-1.4 and 2.4-2.6ms. Abdominal studies reviewed were acquired in the axial plane and predominately at 1.5T (Figs. 2-4), while studies covering the head, neck, and spine were performed at 3T and primarily acquired in the sagittal plane with subsequent multiplanar reformations. (Fig. 5) Where available studies were compared to multi-echo PDFF quantification of fat and iron content.
Results
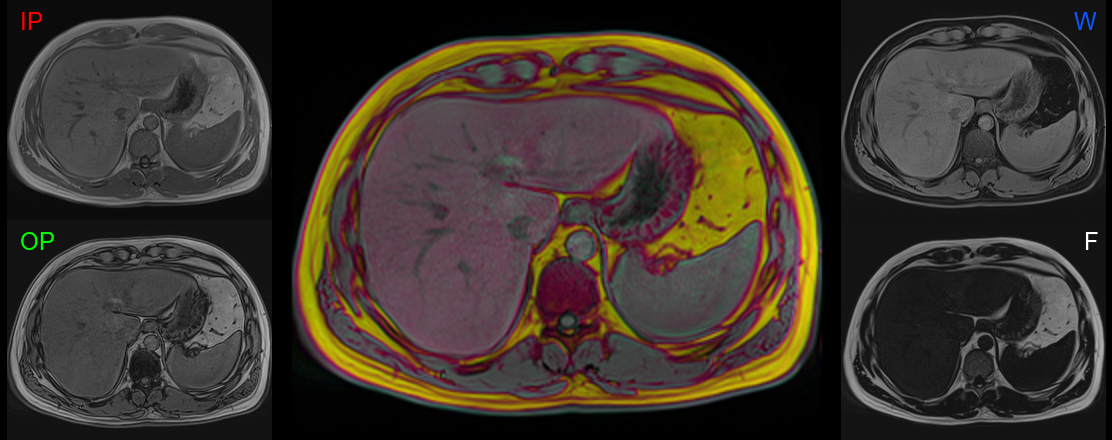
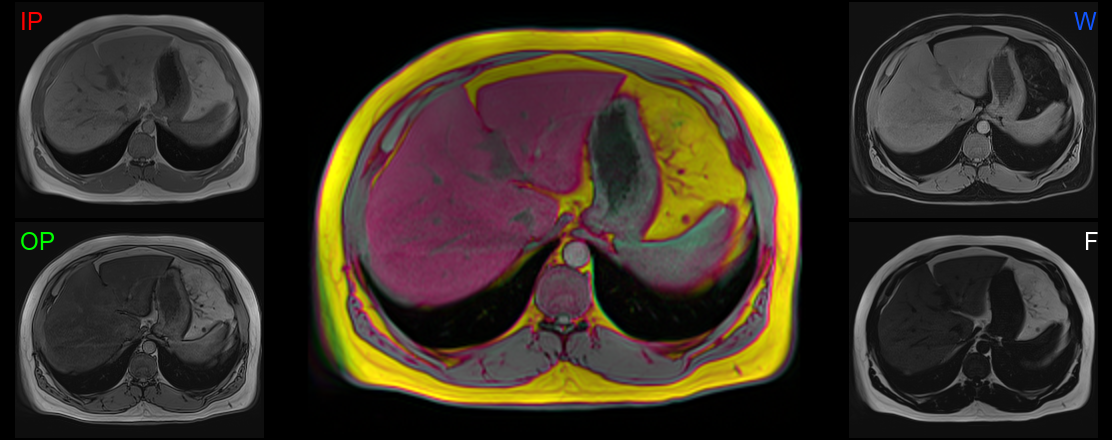
The color-encoding uses additive color mixing to represent tissue properties. Tissues containing water have similar IP, OP and W intensity and mix to shades of gray. Using the default color encoding scheme, tissues containing macroscopic fat lack W signal intensity and appear yellow. With contrast administration, however, fat shifts slightly in hue and saturation toward orange as OP signal (G) decreases in conjunction with the relative increase in W signal (B).
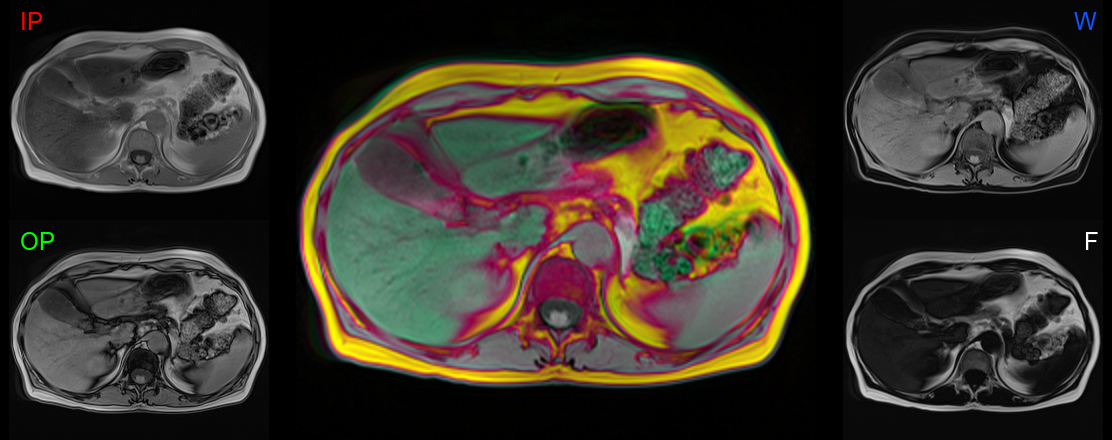
Tissues containing both fat and water have a red-to-magenta hue as do regions with “India ink” artifact (which appears black on OP images) since IP intensity (R) predominates and OP intensity (G) is diminished or nulled. (Fig. 2) Regions of magnetic susceptibility or tissues demonstrating significant T2* decay appear greenish due to signal decay between the first OP (G) and second IP (R) echo. (Fig. 3) Consequently, iron deposition in the liver and other organs appears green (Fig 3) as do regions of susceptibility artifact (Fig 5) while steatosis appears red (Figs. 2&3).
None of the fast Dixon cases reviewed demonstrated a total fat-water swap. One case with sagittal volumetric sequencing at 1.4mm thickness demonstrated a very small focal area of mis-mapping anterior to metallic ACD&F hardware that was not seen when acquired with 1mm thickness. (Fig 5). At 3T, short echo times, high BW, small voxels size, and short acquisition times mitigate artifact related to motion, pulsation, and susceptibility.6
Discussion
Our overall goal was to develop a simple, intuitive and clinically-useful color presentation that integrates multiple contrasts obtained in Dixon acquisitions. By facilitating the interpretation of complex Dixon datasets we can increase utilization of Dixon across the entire body. Additionally, the color RGB representation of Dixon images may also facilitate computer vision applications that rely on transfer learning of pre-trained color vision neural networks.
Conclusion
Color-encoded fast Dixon imaging demonstrates significant promise and warrants further systematic investigation across the entire body, with correlation to quantitative confounder-corrected chemical shift encoded MRI (CSE-MRI).5-7Acknowledgements
No acknowledgement found.References
- Dixon, W.T. (1984). Simple proton spectroscopic imaging. Radiology 153, 189–194.
- Bray TJP, Singh S, Latifoltojar A, Rajesparan K, Rahman F, Narayanan P, et al. Diagnostic utility of whole body Dixon MRI in multiple myeloma: A multi-reader study. PLoS ONE. 2017;12(7):e0180562.
- Kather JN, Weidner A, Attenberger U, Bukschat Y, Weis C-A, Weis M, et al. Color-coded visualization of magnetic resonance imaging multiparametric maps. Sci Rep. 2017 23;7:41107.
- Weiss KL, Richards CR, Sun D, Weiss JL. Subminute Fat-Water-Separated Dual-Echo Automated Spine Survey Iterative Scan Technique. American Journal of Neuroradiology. 2009 Nov 1;30(10):1840–6.
- Boll DT, Marin D, Redmon GM, Zink SI, Merkle EM. Pilot Study Assessing Differentiation of Steatosis Hepatis, Hepatic Iron Overload, and Combined Disease Using Two-Point Dixon MRI at 3 T: In Vitro and In Vivo Results of a 2D Decomposition Technique. American Journal of Roentgenology. 2010 Apr 1;194(4):964–71.
- Reeder, S.B., Cruite, I., Hamilton, G., and Sirlin, C.B. (2011). Quantitative assessment of liver fat with magnetic resonance imaging and spectroscopy. J Magn Reson Imaging 34, 729–749.
- Hong, C.W., Fazeli Dehkordy, S., Hooker, J.C., Hamilton, G., and Sirlin, C.B. (2017). Fat Quantification in the Abdomen. Topics in Magnetic Resonance Imaging 26, 221.
Figures