1777
A Quantitative MRI Phantom to Mimic the Simultaneous Presence of Fat, Iron, and Fibrosis1Radiology, University of Wisconsin-Madison, Madison, WI, United States, 2Medical Physics, University of Wisconsin-Madison, Madison, WI, United States, 3Radiology, University of California, San Diego, San Diego, CA, United States, 4Calimetrix LLC, Madison, WI, United States, 5Biomedical Engineering, University of Wisconsin-Madison, Madison, WI, United States, 6Emergency Medicine, University of Wisconsin-Madison, Madison, WI, United States, 7Medicine, University of Wisconsin-Madison, Madison, WI, United States
Synopsis
Fat, iron and fibrosis are important features of liver disease that commonly coexist. Emerging quantitative MRI biomarkers including proton density fat fraction (PDFF), R2*/R2 and T1 enable quantification of fat, iron, and fibrosis, respectively, and require quantitative MR phantoms for validation and quality assurance. Although current phantoms enable separate adjustment of PDFF, R2*/R2 or T1, there is an unmet need for phantoms that accurately mimic MRI signals in the presence of simultaneous fat, iron and fibrosis by jointly controlling PDFF, R2*/R2 and T1. In this work, we develop and validate a novel phantom that jointly controls PDFF, R2*/R2 and T1.
Introduction:
The abnormal accumulation of fat and iron in tissue are principal histological features of multiple diseases including non-alcoholic fatty liver disease (NAFLD)1 and iron overload2. In addition, fibrosis commonly coexists with both liver fat and iron accumulation3,4.
Noninvasive MRI biomarkers, including proton density fat fraction (PDFF) as a measure of liver fat, R2* and R2 as measures of liver iron, and T1 as a measure of fibrosis, have been proposed to assess these conditions5,6,7.Importantly, the simultaneous presence of these histological features can confound the quantification of each other (eg: iron deposition is a confounder for fat and T1-based fibrosis measurements, fat deposition is a confounder for R2*-based iron measurements, etc). Therefore, successful development of these MRI biomarkers requires phantoms that mimic the simultaneous presence of fat, iron and fibrosis by jointly controlling PDFF, R2*/R2, and T1. Even though phantoms that separately control PDFF, R2*/R2, or T1 have been previously proposed, there are no available phantoms that control all parameters simultaneously.
Therefore, the purpose of this work is to design, develop and validate a quantitative MRI phantom that mimics the simultaneous presence of fat, iron and fibrosis in liver by controlling PDFF, R2*/R2, and T1.
Methods:
Phantom Design (Components):
Vials: High-density polyethylene vials with volume 25mL and 20mm diameter.
Fat source: Peanut oil was used for mimicking liver triglycerides.
R2*/R2 source: Microbeads (COMPEL, Bangs Labs, Fishers, IN) with 2.9μm-diameter iron particles.
T1 source: NiCl2 was used to modulate T1 relaxation.
Additional components: The vial content was based on a 2% w/v agar gel, including sodium dodecyl sulfate as surfactant.
Phantom Design (Construction):
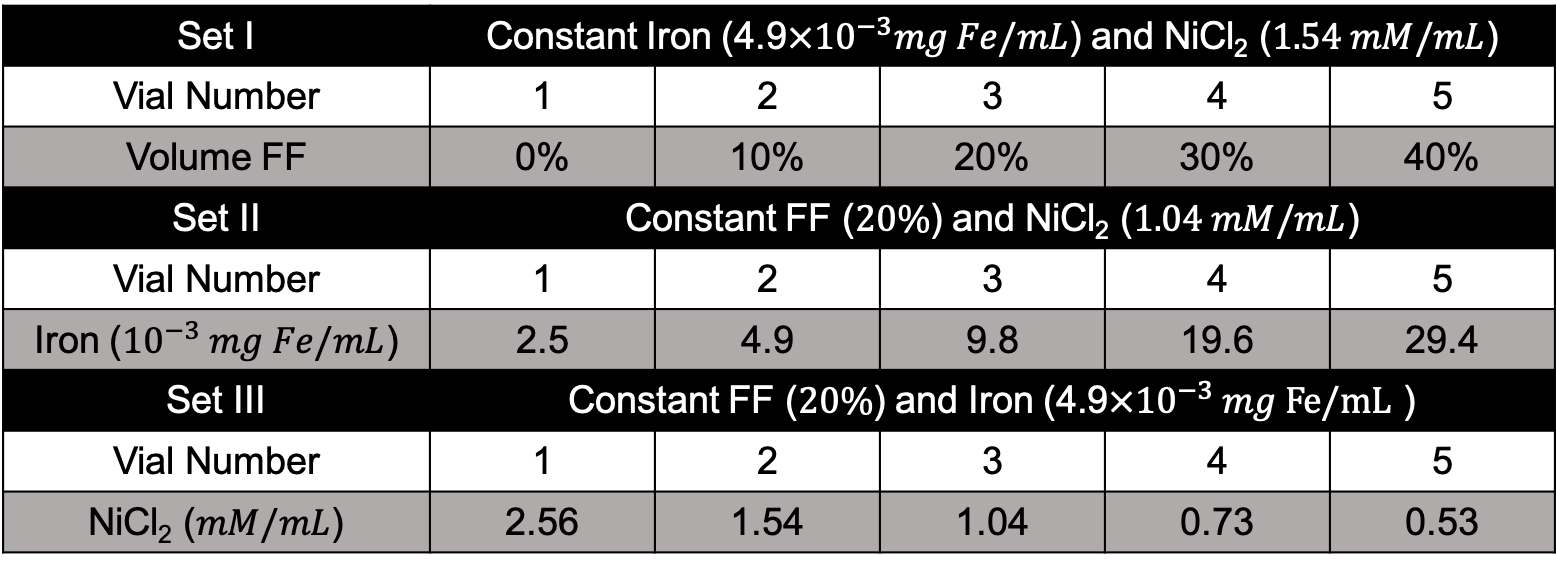
Three sets of vials were constructed by attempting to control one MR biomarker per set (PDFF, R2*/R2 and T1). The first set (varying PDFF) included five vials with varying volume FF, with constant iron concentration and constant NiCl2 concentration. The second set (varying R2*/R2) included five vials with varying iron concentration, with constant FF and constant NiCl2 concentration. The third set (varying T1) included five vials with varying NiCl2 concentration with constant FF and constant iron concentration. The detailed compositions of these vials are listed in Table 1.
PDFF and R2*/R2 and T1 Acquisitions:
The phantom was imaged using a clinical 3.0T MRI system (MR750, GE Healthcare, Waukesha, WI), using an 8-channel phased-array head coil.
Multi-echo 3D spoiled gradient-echo (SGRE) data were acquired at 3.0T for both PDFF and R2* mapping. Acquisition parameters included: 4mm slices, flip angle = 3°, 6 echoes, TE1 = 1.2ms, ΔTE = 1ms, TR = 8ms. Single voxel multi-TE, multi-TR MR spectroscopy was acquired to measure PDFF as well as T1,water, T1,fat, R2,water, R2,fat, FWHM of water and fat8.
Data and Statistical Analysis:
The multi–echo complex source images were fit to a standard signal mode that includes R2* decay and the spectral complexity of fat9 to obtain R2* map and PDFF map. The multi-TE, multi-TR spectroscopy data were processed using a fully automated offline joint fitting algorithm10 to obtain PDFF as well as T1,water, T1,fat, R2,water and R2,fat. All reconstructions and data analysis were implemented in MATLAB (MathWorks, Natick, MA).
Results:
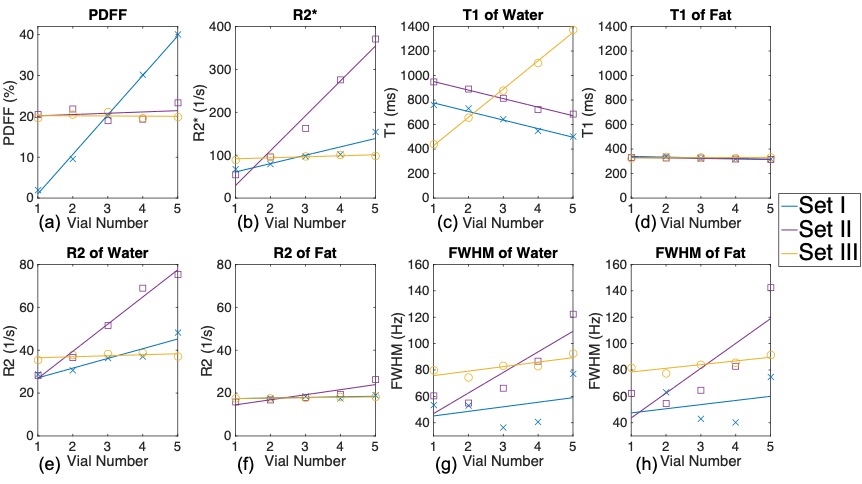
As shown in Figure 1 (a), PDFF was not affected by introducing iron particles or NiCl2. In Figure 1 (b), increasing iron particle concentration causes increasing R2* under single-R2* model of fat and water. T1,water has high correlation with the concentration of NiCl2 and also correlates with iron concentration and FF (Figure 1 (c)). In contrast, T1,fat is independent of FF, iron and NiCl2 (Figure 1 (d)). As shown in Figure 1 (e)-(f), increasing iron concentration leads to increased R2,water, but stable R2,fat. Both full width half maximum (FWHM) of water and fat peaks remain similar to each other in all vials, in agreement with the single-R2* assumption commonly applied in vivo, and both show high correlation with iron concentration (Figure 1 (g)-(h)).Discussion:
In this work, we designed and validated an advanced MRI phantom that mimics the simultaneous presence of fat, iron and fibrosis. By jointly controlling volume fat fraction, iron concentration and NiCl2 concentration, the MRI biomarkers PDFF, R2*/R2, T1 could be controlled while providing signals that accurately mimic those observed in liver. Realistic relationships between each biomarker through the modulation of fat, iron and NiCl2 were observed.
In conclusion, the proposed quantitative phantom may be useful in the development and quality assurance of quantitative MRI biomarkers of fat deposition, iron deposition, and fibrosis, three conditions that commonly occur simultaneously and have been shown to introduce bias in the MR-based quantification of each other.
Acknowledgements
The authors wish to acknowledge support from the NIH (grants R41-EB025729, R01-DK117354, R01-DK100651, K24-DK102595, R01-DK083380, and R01-DK088925). Additionally, the authors acknowledge GE Healthcare who provides research support to the University of Wisconsin.References
1. Ahmed A, Wong RJ, Harrison SA. Nonalcoholic Fatty Liver Disease Review: Diagnosis, Treatment, and Outcomes. Clinical gastroenterology and hepatology: the official clinical practice journal of the American Gastroenterological Association. 2015;13(12):2062-70.
2. Brittenham GM. Disorders of iron metabolism: iron deficiency and overload. In: Hoffman R, Benz EJJ, S.J. S, al. e, editors. Hematology: basic principles and practice. 3rd ed. New York: Churchill Livingstone; 2000. p. 397-428. 4. Brittenham GM. Iron-chelating therapy for transfusional iron overload. The New England journal of medicine. 2011;364(2):146-56.
3. Brittenham GM, Badman DG. Noninvasive measurement of iron: report of an NIDDK workshop. Blood. 2003; 101(1):15-9.
4. Brittenham GM, Cohen AR, McLaren CE, Martin MB, Griffith PM, Nienhuis AW, et al. Hepatic iron storesand plasma ferritin concentration in patients with sickle cell anemia and thalassemia major. Am J Hematol. 1993; 42(1):81-5.
5. Reeder SB, Sirlin CB. Quantification of liver fat with magnetic resonance imaging. Magnetic resonance imaging clinics of North America. 2010;18(3):337-57, ix.
6. Hernando D, Levin YS, Sirlin CB, Reeder SB. Quantification of liver iron with MRI: state of the art and remaining challenges. Journal of magnetic resonance imaging: JMRI. 2014;40(5):1003-21.
7. Banerjee R, Pavlides M, Tunnicliffe EM, Piechnik SK, Sarania N, Philips R, et al. Multiparametric magnetic resonance for the non-invasive diagnosis of liver disease. J Hepatol. 2014;60(1):69-77.
8. Hamilton, G., Yokoo, T., Bydder, M., Cruite, I., Schroeder, M. E., Sirlin, C. B., & Middleton, M. S. (2011). In vivo characterization of the liver fat 1H MR spectrum. NMR in biomedicine, 24(7), 784-790.
9. Yu H, Shimakawa A, McKenzie CA, Brodsky E, Brittain JH, Reeder SB. Multiecho water-fat separation and simultaneous R2* estimation with multifrequency fat spectrum modeling. Magnetic resonance in medicine: official journal of the Society of Magnetic Resonance in Medicine / Society of Magnetic Resonance in Medicine. 2008;60(5):1122-34.
10. Hernando D, Artz N, Hamilton G, Roldan A, Reeder SB, “Fully Automated Processing of Multi-Echo Spectroscopy Data for Liver Fat Quantification,” In Proceedings of the 22nd Annual Meeting of the International Society of Magnetic Resonance in Medicine, Milan, Italy 2014
Figures