1776
Bayesian selection of dedicated liver iron quantification MRI for patients with clinically-significant iron overload1UT Southwestern Medical Center, Dallas, TX, United States, 2University of Wisconsin at Madison, Madison, WI, United States
Synopsis
R2- and R2*-MRI has become an important clinical tool to noninvasively quantify liver iron concentration (LIC) in patients with significant iron overload who may require iron-reducing therapy. However, these highly specialized exams can only be performed on dedicated 1.5T scanners meeting certain technical specifications. Therefore, a priori selection of patients according to their pre-test probabilities of significant iron overload may help correctly match the patients’ clinical needs to the appropriate MRI scanner and exam protocol. This study derives a Bayesian patient selection criterion based on serum ferritin to identify patients who may and may not benefit from dedicated liver iron quantification MRI.
INTRODUCTION
Determination of absolute liver iron concentration (LIC) is necessary in patients with clinically-significant iron overload (LIC >7 mg of iron per g of liver by dry weight, mg/g) to manage iron-reducing therapy. LIC can be measured noninvasively using spin echo (SE)-based R2-MRI1 (FerriScan®, Resonance Health, Ltd.) or multiecho gradient recalled echo (GRE)-based R2*-MRI2. While R2-MRI is currently the only approved method by the U.S. Federal Drug Administration (FDA), it is only available at select imaging centers equipped with FerriScan®-approved 1.5T scanners and may incur additional out-of-pocket costs to the patients. Accurate R2*-MRI in severe iron overload also requires dedicated 1.5T scanners equipped with a specialized GRE sequence and reconstruction software optimized for extremely rapid signal decay3. Therefore, a priori selection of patients according to their pre-test probabilities of significant iron overload may be helpful to better match the patients clinical needs and MRI scanner and scanning protocol. Therefore, the purpose of this study was to develop patient selection criterion to stratify the pre-test probability of significant iron load based on serum ferritin level, to correctly triage patients to dedicated liver iron quantification MRI versus standard liver MRI.METHODS
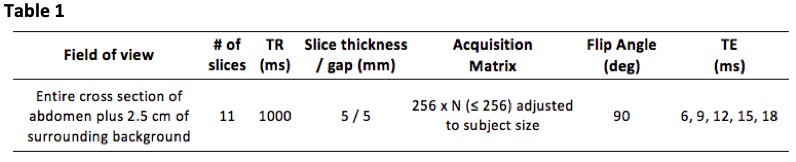
This IRB-approved, HIPAA-compliant single-center retrospective study included 58 adult patients with suspected or known iron overload who underwent R2-MRI (FerriScan®) on Philips 1.5T whole body systems (Achieva or Ingenia) between 2013 and 2018 for clinical care (n=13) and for research (n=45). Informed consent was obtained in those enrolled in research; the informed consent requirement was waived for those who underwent R2-MRI for clinical care. Axial single-echo SE imaging of the liver was performed at TE = 6, 9, 12, 15, and 18 ms during free-breathing using a standardized FerriScan® acquisition protocol. Detailed acquisition parameters are shown in Figure 1. The acquired multi-TE SE images were securely transmitted to Resonance Health Data Processing Center for R2 mapping and LIC determination.
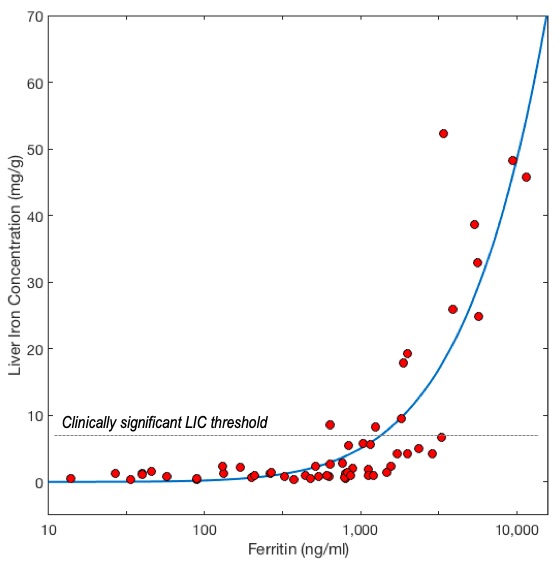
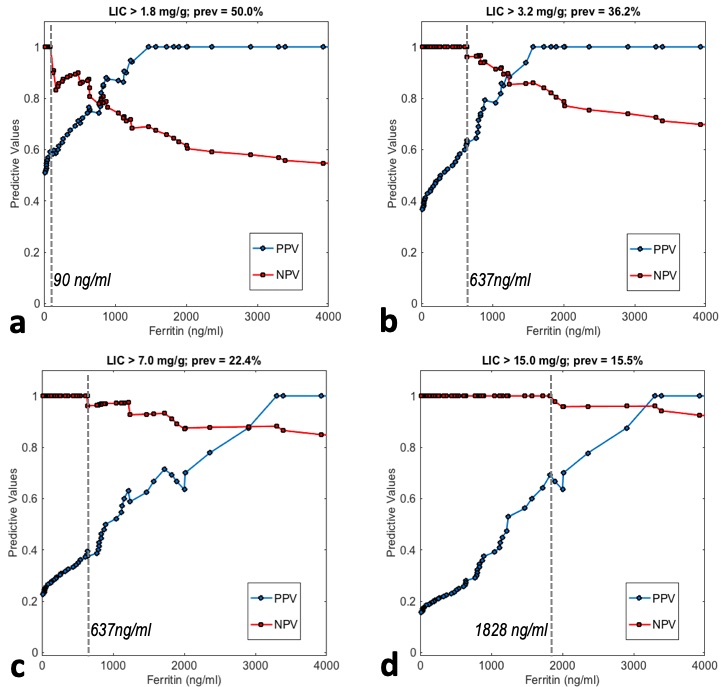
The calculated LIC and serum ferritin (in ng/ml) within 30 days of MRI was compared in a scatter graph and fitted to a power function. Using receiver operating characteristics (ROC) analysis, the negative and positive predictive values (NPV, PPV) for classifying LIC4 >1.8 mg/g (borderline), >3.2 mg/g (mild), >7 mg/g (moderate), and >15 mg/g (severe) were calculated for various levels of serum ferritin as classification threshold. The optimal patient selection threshold was selected as the highest level of ferritin with 100% NPV, i.e. the level of ferritin below which clinically-significant iron overload is definitively excluded.
RESULTS
The study population (n=58) had mean age 43.6 years with standard deviation (SD) of 14.5 years, 32 males and 26 females. The causes of iron overload were: genetic hemochromatosis (n=21), transfusion-dependent anemia (n=28), hyperferritinemia of uncertain etiology (n=8), and other (n=1). The range of LIC was 0.38-52.2 mg/g, with mean of 7.4 mg/g; 29 were normal (LIC < 1.8 mg/g), 8 borderline (1.8-3.2 mg/g), 8 mild (3.2-7 mg), 4 moderate (7-15 mg/g) and 9 severe (>15 mg/g). The pre-test probability was 50.0% for abnormal LIC (>1.8 mg/g) and 22.4% for clinically significant LIC (≥7 mg/g). Figure 2 shows the scatter plot of LIC vs. serum ferritin. Figure 3 shows NPV and PPV of borderline, mild, moderate, and severe iron overload as a function of threshold ferritin level. The most appropriate ferritin threshold was determined to be 637 ng/ml, which can be used to exclude clinically-significant iron overload of LIC >7 mg/g. In those patients with ferritin < 637 ng/ml, dedicated iron quantification MRI is likely not needed.CONCLUSION
Patient selection based on serum ferritin may allow more appropriate selection of patients who may or may not benefit from dedicated liver iron quantification MRI.Acknowledgements
This study was supported in part by NIH research grant R01 DK100651-04.References
1. St Pierre TG, Clark PR, Chua-Anusorn W, Fleming AJ, Jeffrey GP, Olynyk JK, Pootrakul P, Robins E, Lindeman R. Noninvasive measurement and imaging of liver iron concentrations using proton magnetic resonance. Blood. 2005 Jan 15;105(2):855-61.
2. Wood JC, Enriquez C, Ghugre N, Tyzka JM, Carson S, Nelson MD, Coates TD. MRI R2 and R2* mapping accurately estimates hepatic iron concentration in transfusion-dependent thalassemia and sickle cell disease patients. Blood. 2005 Aug 15;106(4):1460-5.
3. Hernando D, Levin YS, Sirlin CB, Reeder SB. Quantification of liver iron with MRI: state of the art and remaining challenges. J Magn Reson Imaging. 2014 Nov;40(5):1003-21
4. Olivieri NF, Brittenham GM. Iron-chelating therapy and the treatment of thalassemia. Blood. 1997;89: 739-761.
Figures