1773
Inter-site repeatability and quantitative assessment of hepatic transporter function with DCE-MRI in rats1MR & CT Contrast Media Research, Bayer AG, Berlin, Germany, 2Leeds Imaging Biomarkers Group, Department of Biomedical Imaging Sciences, University of Leeds, Leeds, United Kingdom, 3R&D TIM - Bioimaging Germany, Sanofi-Aventis Deutschland GmbH, Frankfurt am Main, Germany, 4Bruker BioSpin MRI GmbH, Ettlingen, Germany, 5Manchester Science Park, Bioxydyn Ltd, Manchester, United Kingdom, 6Division of Informatics Imaging & Data Sciences, School of Health Sciences, Faculty of Biology Medicine & Health, Centre for Imaging Sciences, Manchester, United Kingdom, 7BioVenture Hub, Antaros Medical, Mölndal, Sweden, 8Chalmers University of Technology, MedTech West, Gothenburg, Sweden, 9Merck & Co., Inc., West Point, PA, United States
Synopsis
Drug-induced liver injury can halt liver-metabolized drug development or cause withdrawal from the market. Toxicologists lack appropriate and reproducible assays. We present repeatability and reproducibility results from a multi-center study with dynamic gadoxetate-enhanced MR imaging biomarkers of hepatic transporter-mediated injury in rats. Our study supports the development of a validated liver function-specific quantitative MR imaging biomarker, and we demonstrate that the biomarkers are repeatable and that the previously reported MR assay findings are reproducible across three centers.
Introduction
Hepatobiliary functional impairment is a common cause of drug-induced liver injury (DILI), which ultimately may lead to acute liver failure. Gadoxetate is an approved MRI contrast agent for detection of focal liver lesions to measure transport rate constants of specific liver transporters with DCE-MRI and pharmacokinetic modeling1. In this study, we aimed to further evaluate a quantitative liver transporter specific MR imaging biomarker, capable of indicating potential safety risks linked with liver transporter inhibiting drugs, i.e. a “predictive” biomarker. In a multi-center repeatability/reproducibility-study, we determined liver transporter function in rats with and without administration of Rifampicin, which is known to inhibit hepatobiliary transport. Gadoxetate uptake (khe) and efflux (kbh) rate constants have been analyzed for 1) repeatability between two measurements of the same animal in the same scanner, for 2) reproducibility between animals across multiple imaging centers, and for 3) determining the ability to detect drug-induced changes in gadoxetate uptake with Rifampicin.
Methods
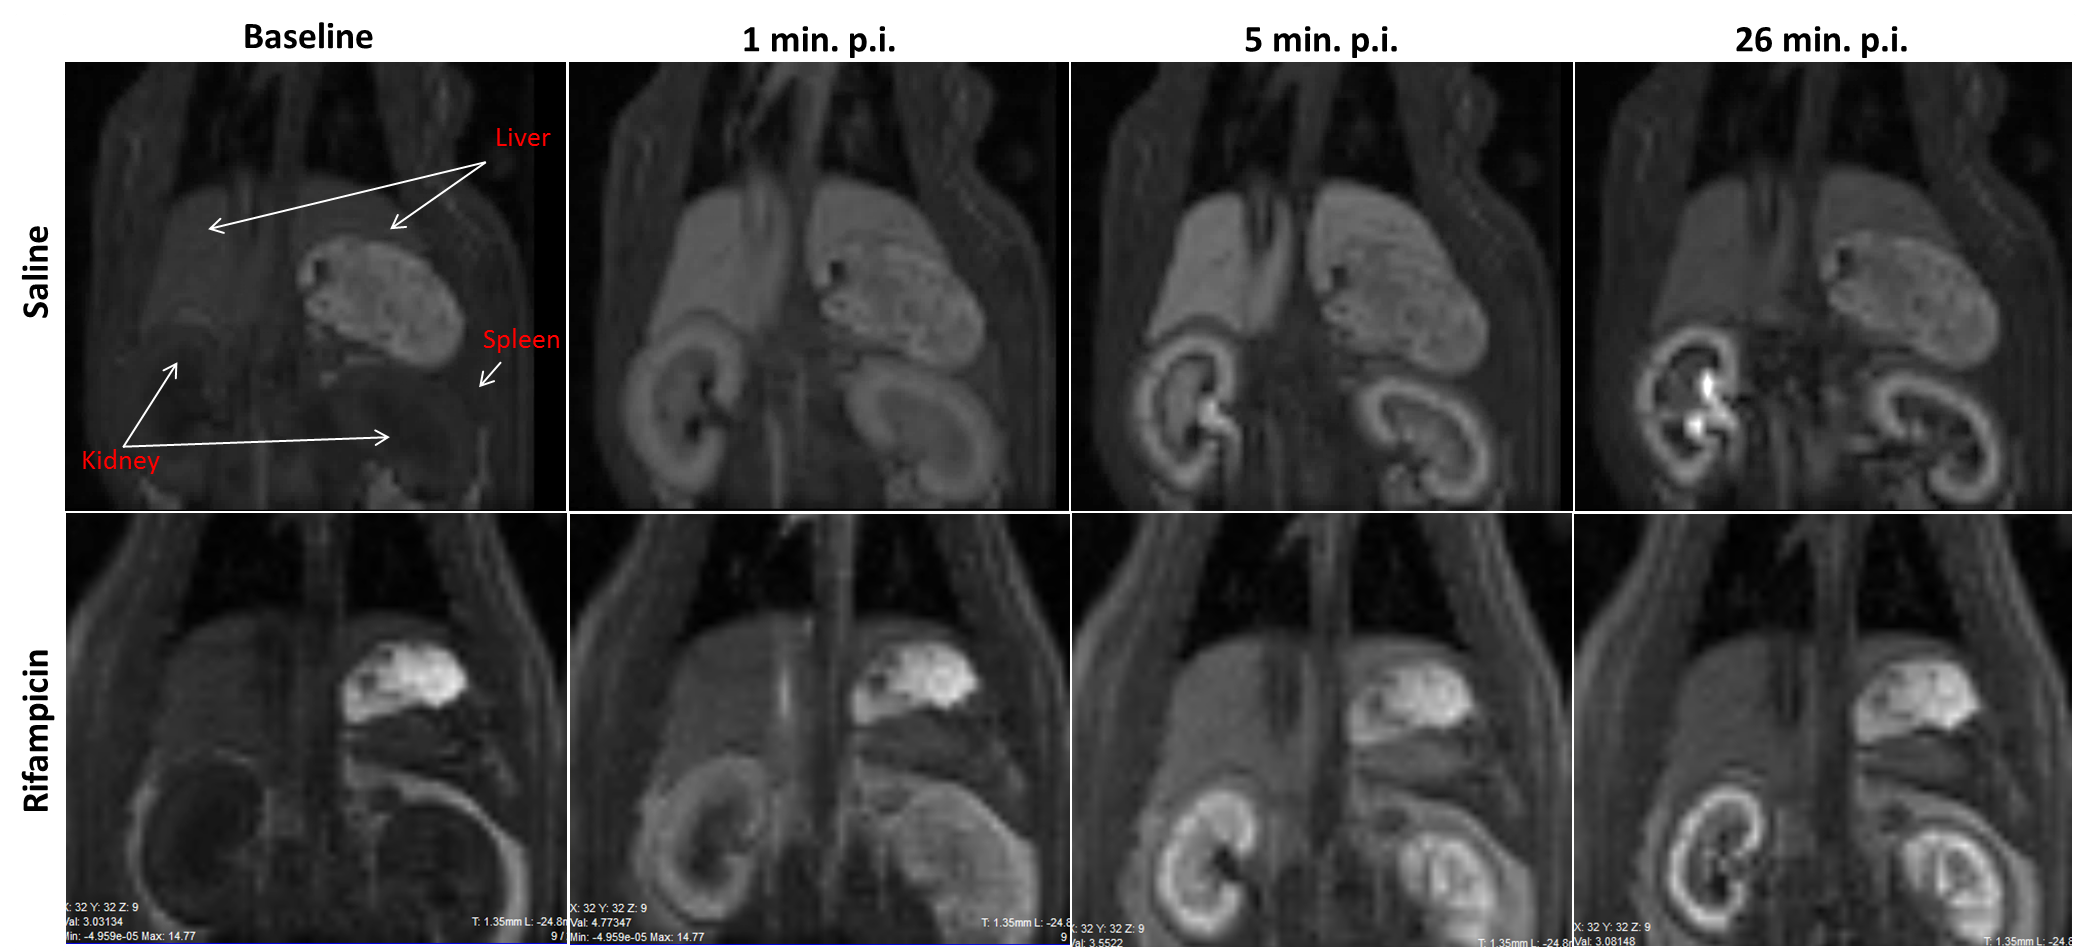
Three MR imaging centers acquired data on Bruker MRI scanners at 4.7T and 7T using Paravision 6.0.1 (Bruker BioSpin, Ettlingen, Germany). Baseline data (Baseline) were acquired on six male Han-Wistar rats at each center, receiving an intravenous injection of saline prior to DCE-MRI with 25 μmol/kg gadoxetate. After 2-7 days, a second dataset was acquired (Post-treatment), administering one group saline and one group 10 mg/kg Rifampicin (n=3, respectively) intravenously, 60 minutes prior to gadoxetate. The scan protocol consisted of a T2-weighted SE-sequence for ROI delineation, a T1-weighted GRE-sequence with 13 variable flip angles (FA) ranging from 1°-30°, and a 3D RF-spoiled GRE DCE T1-weighted retrospectively triggered sequence with TR/TE of 5.8/1.1 ms, FA= 20°, matrix= 64×64×26, slice thickness= 35 mm, temporal resolution= 58 sec and acquisition time= 30 minutes, including five baseline images. ROIs were manually drawn around liver and spleen, and MR signal intensities were extracted from the vFA and DCE-MRI datasets. Pre-contrast longitudinal relaxation rates (R1) were calculated and used to determine dynamic post-contrast R1, using the signal equation of a spoiled-GRE2,3. Gadoxetate concentrations were calculated based on assumed relaxivities in the liver and spleen4. Gadoxetate uptake and efflux rate constants, khe and kbh were determined by fitting a two-compartmental uptake and efflux model defined as
$$C(t)=\left(v_{e} \delta(t) +k_{he} e^{-\frac{k_{bh}}{(1-v_{e})}t}\right)*c_{e}(t)$$
Extracellular volume fraction, ve and hepatocyte volume fraction were taken from 1,2. Extracellular concentration ce(t) was derived from spleen concentrations as $$$c_{e}(t)=\frac{c_{spleen}(t)}{v_{e,spleen}}$$$, using a fixed ve,spleen = 0.431,2. Analyses were performed centrally using custom-written code in MATLAB R2018a and Python 3.6.
Results
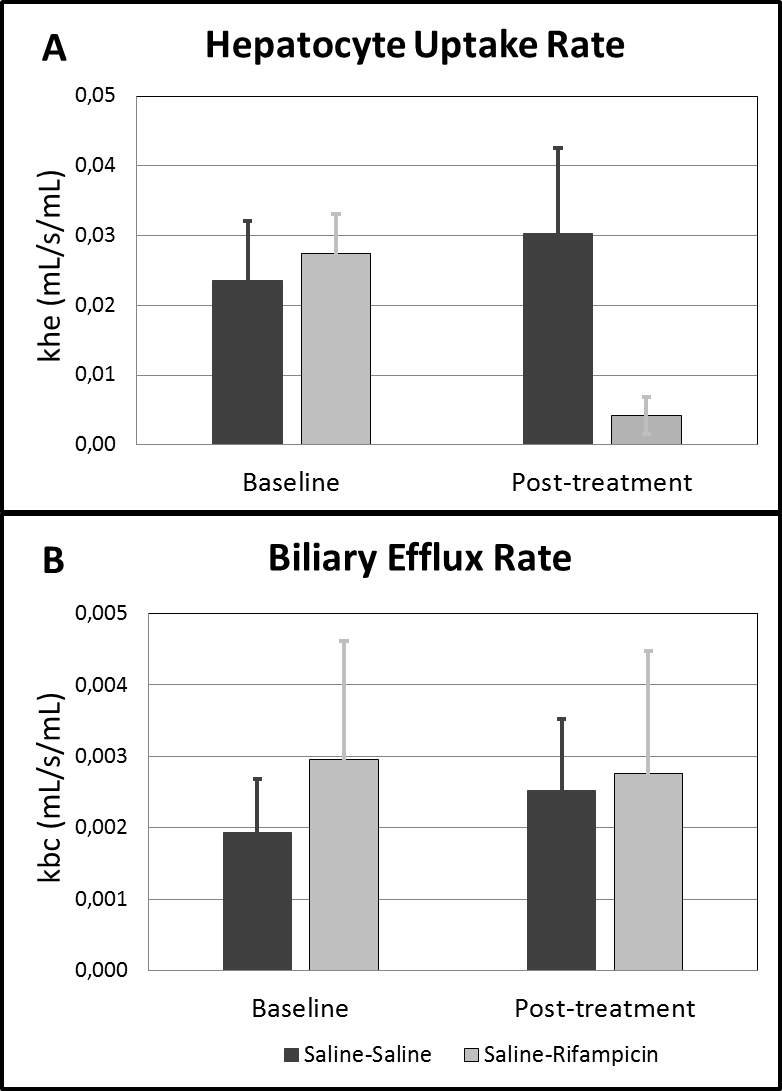
Fig. 2A shows gadoxetate uptake rates from both acquisitions in the two rat groups, averaged over all three centers. Baseline measures of khe in both groups are in good agreement (0.024 ± 0.008 and 0.027 ± 0.006 mL/s/mL). In Rifampicin-treated rats, an average reduction of 88.9% ± 6.3% in khe was observed. In saline-injected rats, khe maintained baseline level (Baseline: 0.024 ± 0.008 mL/s/mL; Post-treatment: 0.030 ± 0.012 mL/s/mL). Fig. 2B illustrates the averaged gadoxetate efflux rates from hepatocytes to bile. Similar to khe, saline-treated animals did not show any change in kbh (Baseline: 0.0019 ± 0.0008 mL/s/mL; Post-treatment: 0.0025 ± 0.0010 mL/s/mL). In contrast to khe, in Rifampicin-treated animals kbh remained unchanged (0.0030 ± 0.0017 mL/s/mL vs 0.0028 ± 0.0017 mL/s/mL).Discussion
We demonstrated repeatability and reproducibility of changes in hepatocyte uptake and efflux after intravenous infusion of Rifampicin, one of the most common anti-tuberculosis therapies and well-known hepatotoxicity with a DCE-MRI approach. Our results show a consistent reduction of the hepatic uptake rate constant khe after Rifampicin injection across imaging centers, which further demonstrates the ability of the assay to detect transporter-mediated alterations. Our results are in agreement with previously published values of a similar approach, where khe without and with Rifampicin treatment was 39.3 ± 3.4 s-1 and 11.7 ± 1.3 s-1 4, respectively, demonstrating that this assay can be reliably used across seven preclinical sites, which is unprecedented for a DCE-MRI assay. The values in Karageorgis et al.4 deviate by a factor of 1000 due to an extra scaling factor in their calculations. To further demonstrate the ability of this approach to monitor changes in liver function as predictive signs of DILI, we are investigating effects of multiple drugs known to inhibit hepatobiliary function after repetitive administration.Conclusion
This work demonstrates the potential for gadoxetate DCE-MRI as quantitative imaging technique to address signs of DILI earlier in the drug development pipeline, when various factors specifically focusing on high variability between sites have been addressed.Acknowledgements
The research leading to these results received funding from the Innovative Medicine Initiatives 2 Joint Undertaking under grant agreement No 116106. This Joint Undertaking receives support from the European Union’s Horizon 2020 research and innovation program and EFPIA.References
1 Ulloa, J. L. et al. Assessment of gadoxetate DCE-MRI as a biomarker of hepatobiliary transporter inhibition. NMR Biomed 26, 1258-1270, 2013.
2 Crawley, A. P., Wood, M. L. & Henkelman, R. M. Elimination of transverse coherences in FLASH MRI. Magn Reson Med 8, 248-260, 1988.
3 Haase, A., Frahm, J., Matthaei, D., Hanicke, W. & Merboldt, K. D. FLASH imaging: rapid NMR imaging using low flip-angle pulses. 1986. J Magn Reson 213, 533-541, 2011.
4 Karageorgis, A. et al. A multi-center preclinical study of gadoxetate DCE-MRI in rats as a biomarker of drug induced inhibition of liver transporter function. PLoS One 13, e0197213, 2018.
Figures