1771
Noninvasive Assessment of Abdominal Adipose Tissues and Fat Quantification of the Liver and Pancreas in Type 2 Diabetes Mellitus1Radiological Sciences, David Geffen School of Medicine at UCLA, Los Angeles, CA, United States, 2Medicine, David Geffen School of Medicine at UCLA, Los Angeles, CA, United States
Synopsis
Type 2 diabetes mellitus (T2DM) is a chronic metabolic disorder effecting millions of people worldwide. T2DM is associated with insulin resistance and adipose tissue dysfunction which promote ectopic fat deposition and lipotoxicity in muscle, liver, and pancreatic beta cells. However, the impact of dysfunctional adipose tissue has not been fully elucidated. Here we examined the adipose tissue (SAT), visceral adipose tissue (VAT), hepatic fat fraction (HFF) and pancreatic fat fraction (PFF) difference between T2DM and age-matched healthy controls using the 6-point Dixon MRI technique and assess relationship with biochemical markers of insulin resistance. We observed trend of increasing VAT, SAT and TAT volume in T2DM patients along with significantly higher HFF% and PFF%. HbA1c in T2DM patients were positively correlated with VAT, total adipose tissue and HFF%. Our preliminary results of increased SAT and VAT reaffirmed that central obesity is connected with the evolution of T2DM. Increased HFF% and correlation of increased HbA1c with increased HFF% in T2DM suggested that T2DM patients suffer from nonalcoholic fatty liver disease. In summary, increased liver, pancreatic fat, and adipose tissue characterize T2DM patients and the insulin resistance. Better understanding of these results will help us in formulate early intervention strategies and to evaluate the efficacy of therapies.
Introduction:
Type 2 diabetes mellitus (T2DM) is a chronic and heterogeneous metabolic disorder that affects millions of people worldwide1,2. T2DM is associated with the rising obesity rate3, and obesity is a key factor in the development of T2DM. Features of T2DM include insulin resistance and pancreatic β-cell, adipose tissue dysfunction4,5. Dysfunctional adipose tissue is characterized by adipocyte hypertrophy, macrophage infiltration, impaired insulin signaling, and insulin resistance6 leading to release of a host of inflammatory adipokines and excessive amounts of free fatty acids that promote ectopic fat deposition and lipotoxicity in muscle, liver, and pancreatic beta cells7,8. However, the impact of dysfunctional adipose tissue has not been fully elucidated and given the complex nature of measuring depot-specific adipose tissue in T2DM patients; very few studies have measured adipose tissue distribution and hepatic and pancreatic fat contents simultaneously using MRI. The aims of the present study were 1) to quantify subcutaneous adipose tissue (SAT), visceral adipose tissue (VAT), hepatic fat fraction (HFF) and pancreatic fat fraction (PFF) and to compare between T2DM and age-matched healthy controls using the 6-point Dixon9 MRI technique; 2) to assess associations between adipose distributions and biochemical markers of insulin resistance.Materials and Methods:
The study participants consisted of twelve T2DM patients (age=59.8±5.8 years), nine age-matched healthy controls (AMHC) (age=60.9±7.8 years). We also added a group of eleven young healthy control (YHC) (age=27.8±3.0 years) to study the reliability of 6-point Dixon and compared with other two groups. A Siemens 3T Prisma MRI Scanner with a surface matrix array and a spinal phased-array coil was used. Abdominal MRI was performed using a 3D GRE VIBE 6-point Dixon sequence with the following parameters: voxel size=1.187x1.187x3 mm3, slices=52, matrix size=320x240, TR=8.85 ms, bandwidth=1080 Hz/px, flip-angel=50 and shortest possible TEs (equidistant with TE1=1.23 ms and an echo time shift of 1.23 ms). Using the water-only and fat-only images of the Dixon technique, fat fraction and water fraction were calculated by the MR image reconstruction computer as parametric maps10. For T2DM subjects, the following additional clinical data were collected: HbA1c, fasting serum triglycerides, and fasting serum LDL cholesterol.
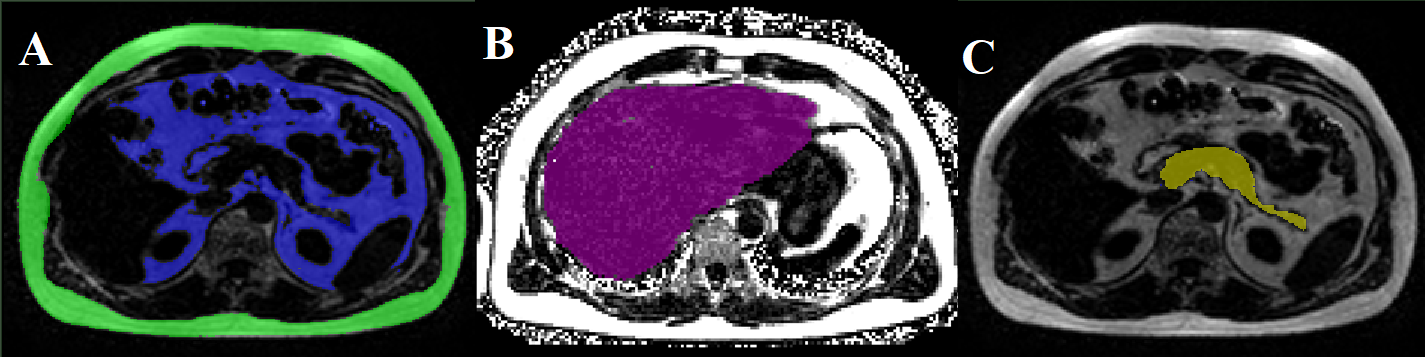
We used the image analysis software slice-O-matic (Tomovision, Canada) to quantify SAT and VAT (Fig.1(A)). A single trained observer guided by an experienced radiologist performed the image analysis11. Hepatic fat fraction (HFF) was measured by ROI selected in homogeneous sections of the liver (Fig.1(B)). To calculate pancreatic fat fraction (PFF), one ROI was placed each in the head, body, and tail of the pancreas (Fig.1(C)). Statistical analysis was done using the SPSS software and significance level was set at p<0.05. Partial correlation controlling for age, gender and BMI was applied to identify the relationship among different measures.
Results:
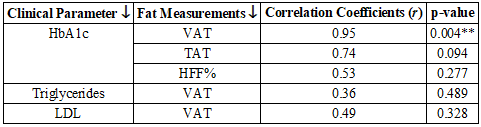
There was no statistically significant difference in gender and BMI across T2DM and AMHC groups. Fig.2 shows volumes of VAT, SAT and total abdominal fat (TAT) for the three groups. We observed trend of increasing VAT, SAT and TAT volumes in T2DM patients compared to AMHC. Compared to T2DM, YHC showed significantly increased VAT along with increasing trend in SAT and TAT volume, which was expected. T2DM showed significantly higher HFF% and PFF% compared to both control groups (Fig.3 and Fig.4). T2DM patients had 30% and 36% HFF and PFF respectively than AMHC. Table 1 shows the correlation results. Increased HbA1c in T2DM patients were strongly associated with higher VAT (r=0.95). HbA1c also correlated positively with TAT (r=0.74) and HFF% (r=0.53). No correlation was found between other clinical parameters and fat content.Discussion:
Quantitative evaluation of AT in the various compartments and organs is important for the study of T2DM. Accumulation of abdominal fat can lead to cardiovascular diseases and mortality. There have been conflicting reports about how VAT in T2DM12,13. Our preliminary results of increased SAT and VAT reaffirmed that central obesity is connected with the evolution of T2DM. Increased HFF% and correlation of increased HbA1c with increased HFF% in T2DM has been confirmed earlier14 and suggest that T2DM patients suffer from nonalcoholic fatty liver disease (NAFLD)15. Increased PFF% in T2DM is important because of its effect on endocrine function. T2DM accompany impairment of intrapancreatic insulin secretory capacity16 which may be the reason for increased PFF.Conclusions:
In summary, increased liver, pancreatic fat, and adipose tissue characterize T2DM patients and the insulin resistance. Non-invasive assessment of body fat in T2DM can be used as biomarkers to stratify risks and evaluate the efficacy of therapies. Further studies with a large pool of subjects are needed to characterize the association between abdominal, hepatic and pancreatic fat accumulation with metabolic syndrome, and other metabolic parameters.Acknowledgements
This research was supported by a grant from NIH/NIBIB: (R21EB02088302).
References
1. https://www.cdc.gov/media/releases/2017/p0718-diabetes-report.html.
2. NCD Risk Factor Collaboration. Worldwide trends in diabetes since 1980: a pooled analysis of 751 population-based studies with 4.4 million participants. Lancet. 2016;387:1513–1530.
3. Despres J-P, Lemieux I. Abdominal obesity and metabolic syndrome. Nature. 2006;444(7121):881–887.
4. Thomas EL, Fitzpatrick JA, Malik SJ, et al. Whole body fat: content and distribution. Prog Nucl Mag Res SP. 2013;73:56–80.
5. Hu HH, Nayak KS, Goran MI. Assessment of abdominal adipose tissue and organ fat content by magnetic resonance imaging. Obes Rev. 2011;12:e504–15.
6. Cusi K. The role of adipose tissue and lipotoxicity in the pathogenesis of type 2 diabetes. Curr Diab Rep. 2010;10(4):306–315.
7. Chen P, Hou X, Hu G, et al. Abdominal subcutaneous adipose tissue: a favorable adipose depot for diabetes? Cardiovasc Diabetol. 2018;17(1):93.
8. Mantatzis M, Milousis T, Katergari S, et al. Abdominal adipose tissue distribution on MRI and diabetes. Acad Radiol. 2014 May;21(5):667–74.
9. Grimm A, Meyer H, Nickel MD, et al. Evaluation of 2-point, 3-point, and 6-point Dixon magnetic resonance imaging with flexible echo timing for muscle fat quantification. Eur J Radiol. 2018;103:57–64.
10. Zhong X, Nickel MD, Kannengiesser SAR, et al. Liver fat quantification using a multi-step adaptive fitting approach with multi-echo GRE imaging. Magn Reson Med. 2014;72:1353–1365.
11. So R, Matsuo T, Sasai H, et al. Best single-slice measurement site for estimating visceral adipose tissue volume after weight loss in obese, Japanese men. Nutr Metab (Lond). 2012;14:9:56.
12. Tulloch-Reid MK, Hanson RL, Sebring NG, et al. Both subcutaneous and visceral adipose tissue correlate highly with insulin resistance in African Americans. Obes Res 2004; 12:1352–1359.
13. Miles JM, Jensen MD. Counterpoint: visceral adiposity is not causally related to insulin resistance. Diabetes Care 2005; 28:2326–2328.
14. Kotronen A, Juurinen L, Tiikkainen M, et al. Increased liver fat, impaired insulin clearance, and hepatic and adipose tissue insulin resistance in type 2 diabetes. Gastroenterology. 2008;135(1):122-130.
15. Kotronen A, Juurinen L, Hakkarainen A, et al. Liver fat is increased in type 2 diabetic patients and underestimated by serum alanine aminotransferase compared with equally obese nondiabetic subjects. Diabetes Care. 2008;31(1):165-169.
16. Heber SD, Hetterich H, Lorbeer R, et al. Pancreatic fat content by magnetic resonance imaging in subjects with prediabetes, diabetes, and controls from a general population without cardiovascular disease. PLoS One. 2017;12(5):e0177154.
Figures