1769
Validation of T1 map on Gd-EOB-DTPA-enhanced liver MRI as a quantitative biomarker of liver function: Calibration, reproducibility, and diagnostic value1Radiology, Ajou university hospital, Suwon, Korea, Republic of, 2Ulsan University Hospital, Ulsan, Korea, Republic of, 3Radiology, Asan Medical Center, Seoul, Korea, Republic of
Synopsis
T1 map using MOLLI sequence on EOB-MRI showed promise for evaluating liver function in patients with liver cirrhosis. Especially, T1-map was accurate to evaluate T1 values based on quantitative phantom study and accurate to diagnose decompensated liver cirrhosis. However, test-retest reproducibility was moderate, requiring further technical improvement.
Introduction
The concept to use gadoxetate-enhanced magnetic resonance imaging (EOB-MRI) for liver function assessment has been emerged in the last decade.1 To incorporate EOB-MRI based biomarkers in the clinical practice, it should be easily used, well-calibrated, reproducible, and accurate to diagnose liver function. We aim to validate T1 map using modified look-locker inversion recovery (MOLLI) sequence on EOB-MRI for liver function estimation. 2Materials & Methods
A quantitative T1-phantom was generated using NiCl2 solution and was scanned using MOLLI sequence to evaluate T1 linearity for calibration. MOLLI sequence was performed as follows: TR/TE 3.0/1.3, FA 8, NEX 1, FOV 379*379, matrix 144x100. Total 340 consecutive patients with chronic liver disease or liver cirrhosis were prospectively enrolled and underwent EOB-MRI with a small T1-phantom attached to the left upper quadrant. T1 relaxation times on precontrast and 20-minutes postcontrast T1 maps were measured. In the liver, difference of T1 relaxation time (ΔT1 = T1post − T1pre) and relative change of T1 relaxation time (%ΔT1 = ΔT1 / T1pre ) and were calculated. Relative liver enhancement at 20-minutes postcontrast T1-WI images was also calculated [%RLE = (SIpost – SIpre)/SIpre]. Correlation between EOB-MRI indices (ΔT1, %ΔT1, and RLE) and clinical liver function score (Child-Pugh score). Diagnostic accuracy of ΔT1, %ΔT1, and RLE to diagnose decompensated cirrhosis (Child-Pugh class B and C) was evaluated by receiver-operating-characteristics (ROC) analysis. Test-retest reproducibility of T1 maps were evaluated in 30 patients by scanning T1 map twice.Results
The MOLLI sequence took 13 seconds, a single breath-hold time. On phantom study, the T1 linearity was excellent (coefficient of determination R2, 0.9916), indicating excellent calibrating capability of the T1 map using MOLLI sequence (Fig. 1). On clinical study, the changes of T1 relaxation time were high in mild cirrhosis (Child-Pugh class A), but decreased in moderate and severe cirrhosis (Child-Pugh class B and C, respectively) (Fig 2). The correlation coefficients between EOB-MRI indices and Child-Pugh score was high in %ΔT1 (r=0.529), but low in ΔT1 (r=0.226) and %RLE (r=0.251). Accuracy to diagnose Child-Pugh class B and C differentiating from class A was high in both %ΔT1 and RLE (AUC 0.797 and 0.829, respectively), but low in ΔT1 (AUC 0.668) (Fig. 3). Accuracy to diagnose Child-Pugh class C differentiating from class A and B was also high in both %ΔT1 and RLE (AUC 0.937 and 0.972, respectively), but low in ΔT1 (AUC 0.796). Test-retest reproducibility of T1 relaxation times was better in T1pre than T1post (Repeatability coefficients; 42.9 and 75.4, respectively), however these results indicate moderate reproducibility, warranting improvement of reproducibility of T1 map on EOB-MRI.Conclusion
T1 mapping using MOLLI sequence on EOB-MRI showed promise for evaluating liver function in patients with chronic liver disease and liver cirrhosis, especially diagnosing decompensated liver cirrhosis who requires close monitoring and treatment. Of EOB-MRI indices, %ΔT1 might be the best index for liver function assessment. However, improvement of reproducibility of MOLLI sequence is warranted.Acknowledgements
This study was supported by grants of Basic Science Research Program through the National Research Foundation of Korea funded by the Ministry of Education [2017R1A2B3011475].References
1. Bae KE, Kim SY, Lee SS, et al. Assessment of hepatic function with Gd-EOB-DTPA-enhanced hepatic MRI. Digestive diseases (Basel, Switzerland) 2012; 30(6): 617-22.
2. Yoon JH, Lee JM, Paek M, Han JK, Choi BI. Quantitative assessment of hepatic function: modified look-locker inversion recovery (MOLLI) sequence for T1 mapping on Gd-EOB-DTPA-enhanced liver MR imaging. European radiology 2016; 26(6): 1775-82.
Figures
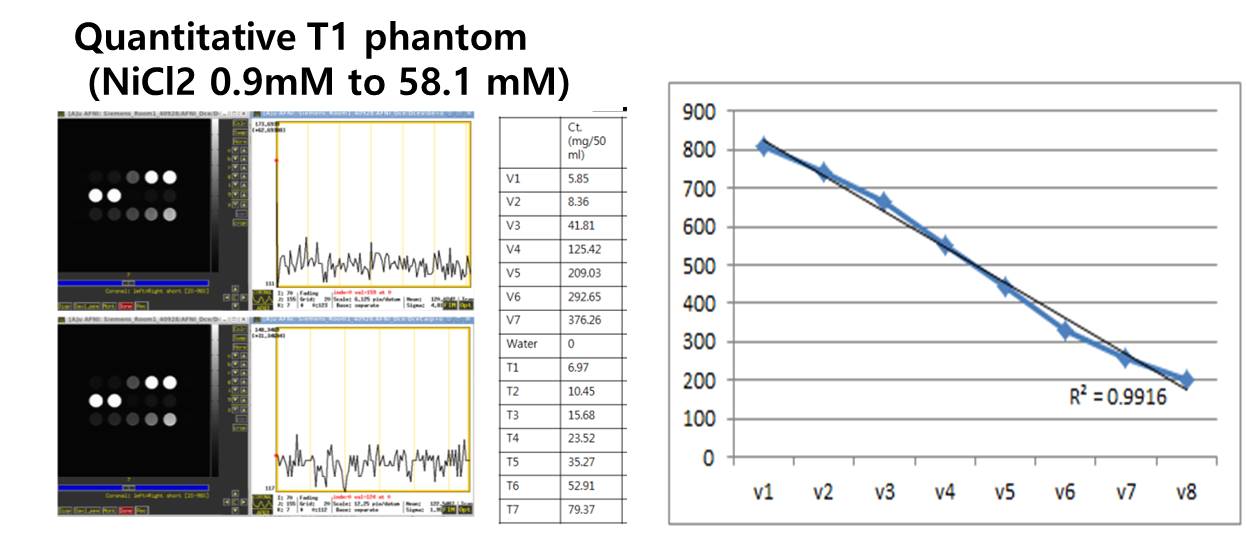
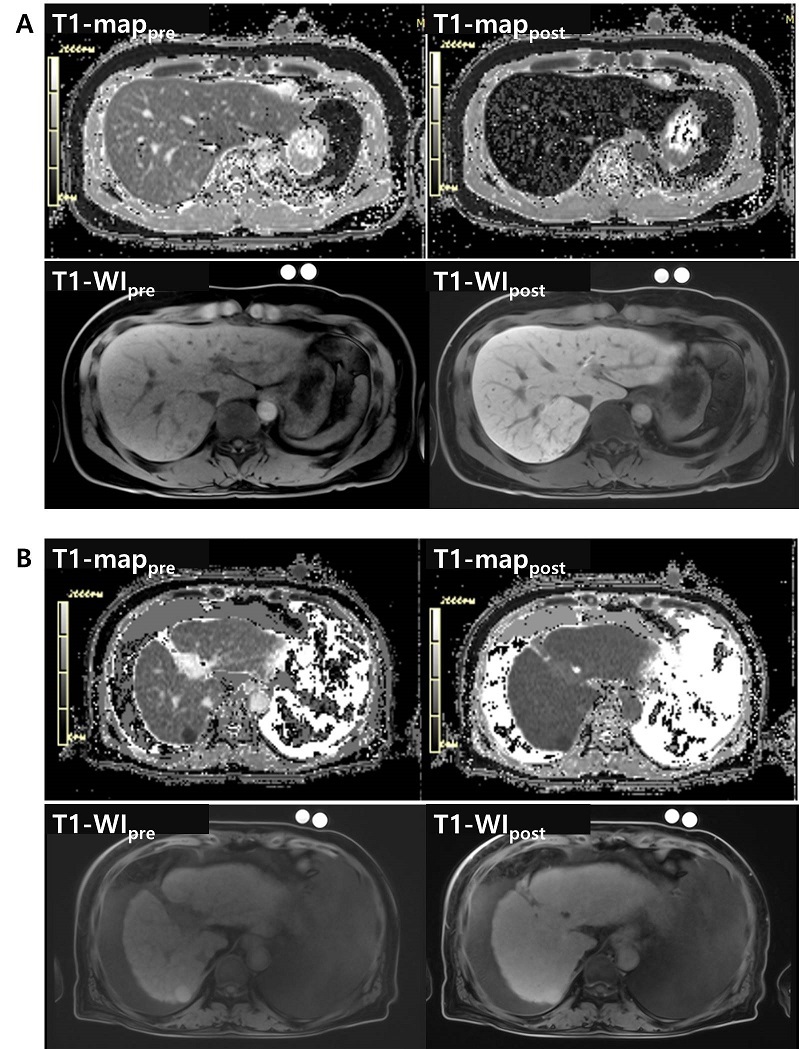
Figure 2. T1 map images and T1-weighted images on pre-contrast and 20-minutes delayed post-contrast phase.(A) Mild liver cirrhosis case. A 51 male patients with chronic hepatitis B and Child-Pugh class A (score 5).(B) Decompensated severe liver cirrhosis case. A 53 male patients with chronic hepatitis B and Child-Pugh class C (score 13).
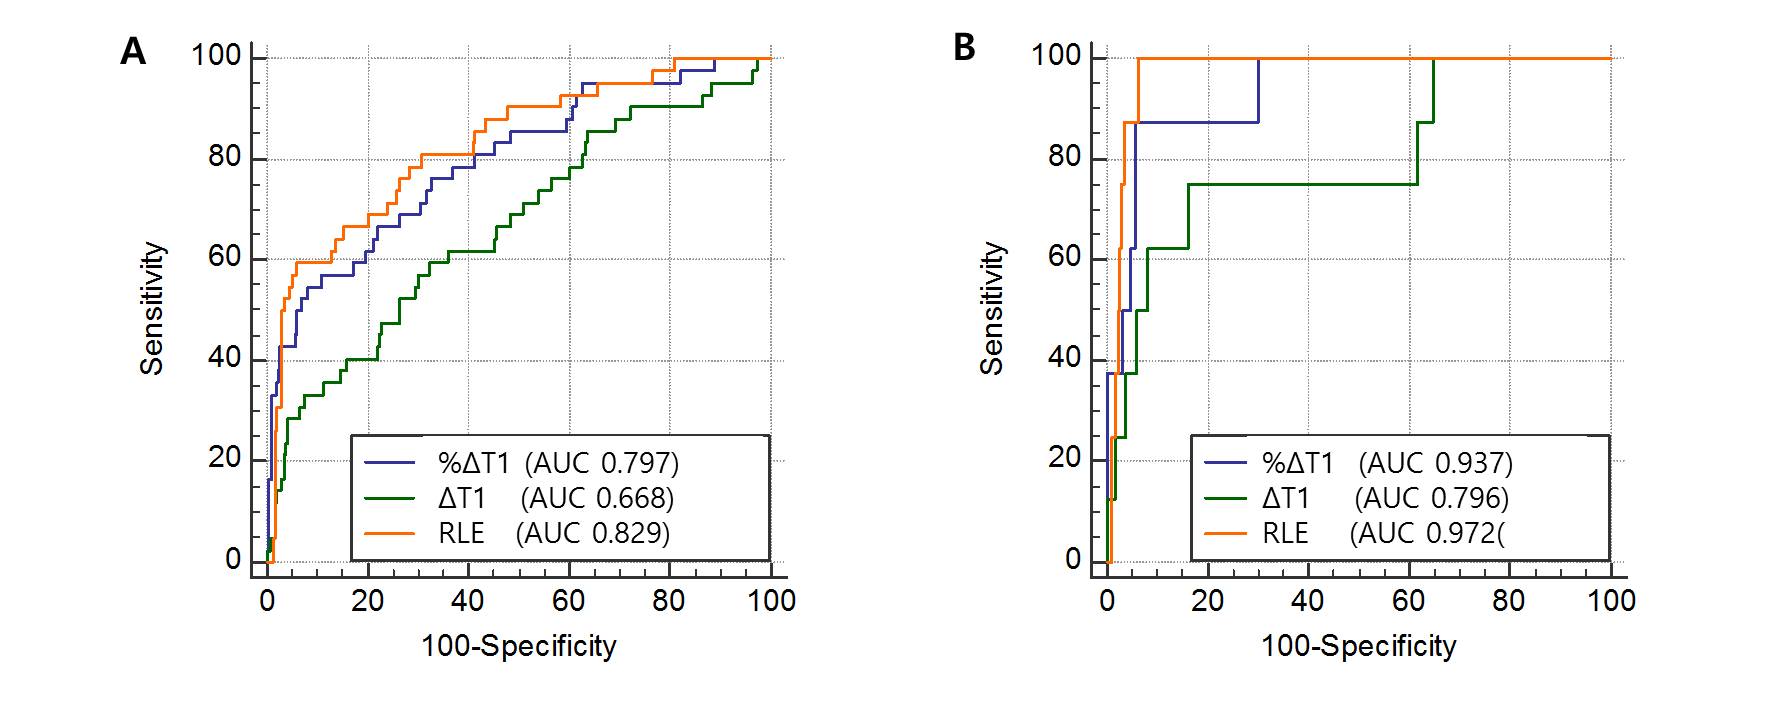
Figure 3. Receiver-operating-characteristics (ROC) curves.
(A) To diagnose Child-Pugh class B and C differentiating from class A.
(B) To diagnose Child-Pugh class C differentiating from class A and B.