1768
Phase-contrast MRI-based estimation of labeling efficiency for liver pseudo-Continuous Arterial Spin Labeling1Medical Physics and Biomedical Engeneering, University Collenge London Hospitals, London, United Kingdom, 2Imaging, University College London Hospitals, London, United Kingdom, 3Centre for Medical Imaging, University College London, London, United Kingdom
Synopsis
Chronic liver disease is associated with profound changes in the dual portal venous (PV) and hepaticarterial (HA) blood supply to the liver. Pseudo-continuous arterial spin labeling (pCASL) canmeasure hepatic blood non-invasively and separate PV and HA contributions, however quantification is directly proportional to the labeling efficiency (alpha), and can therefore significantly affect overall quantification. This study estimates alpha for the PV, descending aorta (DA) and HA using a Bloch equation simulator and velocities measured directly using phase-contrast MRI at the level of the labeling plane, taking into account the effects of labeling plane angulation. We demonstrate that it is reasonable to assume a labeling efficiency of 0.85 for hepatic pCASL in normal volunteers.
Introduction
Chronic liver disease is associated with profound changes in the dual portal venous (PV) and hepatic arterial (HA) blood supply to the liver, including increases in relative HA flow and reductions in total liver blood flow. Ultimately, increases in PV pressure (portal hypertension) drive many lethal complications but remain poorly understood because accurate assessment requires invasive reference standards 1.
Pseudo-continuous arterial spin labeling (pCASL) 2 can measure hepatic blood (HBF) and separate arterial and portal venous contributions non-invasively 3, however quantification of HBF requires knowledge of the labeling efficiency (α) 4. Alpha is defined as a degree of inversion of water spins in blood within the vessel flowing through the labeling plane; it varies with spin velocity, pCASL labeling scheme and can be affected by the angle at which the labeling plane is positioned. Labeling efficiency is directly proportional to measured HBF, such that small changes can have a significant effect on overall perfusion quantification 4.
This study estimates α for the PV, descending aorta (DA) and HA using a Bloch equation simulator and blood vessel velocities measured directly using phase-contrast MRI (PCMRI) at the level of the labeling plane. Additionally, the effect of labeling plane angulation was also simulated to accurately represent the complexity of hepatic vessels labeling with pCASL. Finally, we compare labeling efficiencies measured in fasted subjects with those following calorific stress (known to precipitate increases in PV and HBF5).
Methods
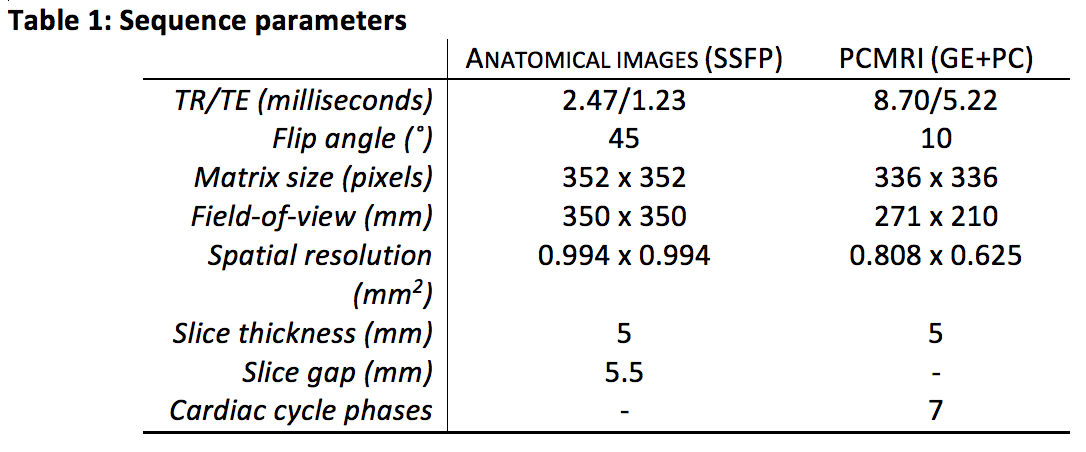
Subjects: 10 fasted healthy volunteers were scanned at baseline and 1h after a 700 calorie nutrient drink. PCMRI: Imaging was performed on a Philips 3T Ingenia scanner using a body coil. Two-dimensional PCMRI with expiratory breath-hold and retrospective cardiac gating was planned carefully on bSSFP anatomical images to ensure vessel orthogonality (see Table 1). PCMRI measurements were repeated three times through the PV (velocity encoding setting (Venc) = 40 cm/s), common HA (Venc = 60 cm/s) and diaphragmatic level aorta (Venc =80 cm/s). Total flow (ml/s) and peak velocities (cm/s) were obtained using Segment (Medviso, Sweden).
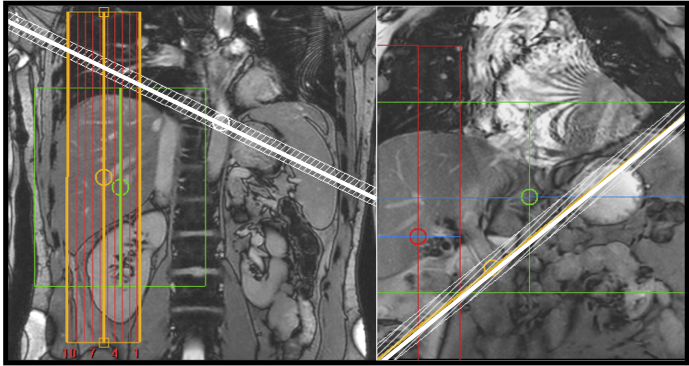
Simulations: A Bloch equation simulator was implemented in Matlab (Mathworks, 2016). Spins were simulated over a flow distance of 20cm with a laminar cross-sectional flow profile and maximum flow velocity varied in the range 1 to 100 cm/s, with a step size of 0.5 cm/s. ‘Balanced’6 pCASL gradients (Gmax = 5 mT/m; Gave = 0.36 mT/m) and RF pulse train (Hanning shaped 0.48 ms duration, 1.21 ms spacing, flip angle (FA) = 27.81°) were matched to that of the scanner implementation. T1/T2 of the arterial blood were assumed to be 1.65s4/0.165s7. The labeling plane angulation was either perpendicular to the vessel (for PV and HA) or at 45° (for DA) (Figure 1). Forty-five degree angulation was simulated by reducing spin velocity by ~30% (multiplication by cos45°). The final labeling efficiency was computed from PCMRI velocity data, weighted by relative flow fraction across all sampled cardiac cycle phases.
Statistical analysis: Oneway ANOVA was used to test for differences in the mean labeling efficiency for different vessels. Paired t-tests were used to investigate differences in labeling efficiency before and after calorific stress. All data cited as mean±SD, with p<0.05 deemed as statistically significant.
Results
Peak velocities averaged across all cardiac cycles and all volunteer scans were: 36.1±6.4cm/s, 23.1±3.8cm/s and 25.4±13.7cm/s in the DA, PV and HA respectively. Estimated labeling efficiencies averaged across all measurements were: 0.87±0.02, 0.84±0.06 and 0.85±0.05 in the DA (at 45° angulation), PV and HA respectively, with an overall average of 0.85±0.04. No statistically significant difference between vessel labeling efficiency means was identified (p=0.0987) and there was no statistically significant difference between baseline and post-calorific stress measurements (p=0.241).
Discussion & Conclusion
Labeling efficiency can have a significant effect on overall pCASL HBF quantification but is often assumed to be constant3. In this study, we estimate labeling efficiency of hepatic pCASL using Bloch Equation simulations and in-vivoi measurements of blood velocities. Labeling at 45° to the aorta occurs when the labeling plane is placed perpendicular to the PV and HA. This approach results in labeling PV only, since arterial blood undergoes double inversion3. When labeling the arterial contribution, the placement of the labeling plane at 45° to the aorta at the level of diaphragm allows placement of the plane away from lungs for a better shim, and simultaneously away from the FoV, so that saturation artefact can be avoided.
In this study we have demonstrated it is reasonable to assume a labeling efficiency of 0.85 for hepatic pCASL in normal volunteers. Evaluation of labeling efficiencies in patients remains the subject of ongoing work.
Acknowledgements
This work was supported in part by National Institute for Health Research and University College London Hospitals Biomedical Research CentreReferences
1. Chouhan MD, Lythgoe MF, Mookerjee RP and Taylor SA. Vascular assessment of liver disease-towards a new frontier in MRI. Br J Radiol. 2016 May 16:20150675.
2. Dai W, Garcia D, De Bazelaire C, Alsop DC. Continuous flow-driven inversion for arterial spin labeling using pulsed radio frequency and gradient fields. Magn Reson Med 2008;60:1488–97
3.
Pan
X, Qian T, Fernandez-Seara MA, Smith RX, Li K, Ying K, Sung K, Wang DJ. Quantification
of liver perfusion using multidelay pseudocontinuous arterial spin labelling. J
Magn Reson Imaging. 2016 May;43(5):1046-54.
4. Alsop DC, Detre JA, Golay X, Günther M, Hendrikse J, Hernandez-Garcia L, et al. Recommended implementation of arterial spin-labeled Perfusion mri for clinical applications: A consensus of the ISMRM Perfusion Study group and the European consortium for ASL in dementia. Magn Reson Med 2015;73:102–16.
5. Jajamovich GH, Dyvorne H, Donnerhack C, Taouli B. Quantitative liver MRI combining phase contrast imaging, elastography, and DWI: assessment of reproducibility and postprandial effect at 3.0 T. PLoS One. 2014 May 19;9(5):e97355.
6.
Wu WC, Fernández-Seara M, Detre JA, Wehrli FW, Wang J. A
theoretical and experimental investigation of the tagging efficiency of
pseudocontinuous arterial spin labeling. Magn Reson Med 2007;58:1020–7.
7. Lee T, Stainsby J a, Hong J, Han E, Brittain J, Wright G a. Blood Relaxation Properties at 3T -- Effects of Blood Oxygen Saturation. Proc Intl Soc Mag Reson Med 2003;11:131.
Figures