1767
Determining Liver Function: Comparison of Gadoxetate Pharmacokinetic Models Using Perfusion Imaging1Department of Medical and Health Sciences, Linköping University, Linköping, Sweden, 2Imaging Biomarkers group, Department of Biomedical Imaging, Leeds University, Leeds, United Kingdom, 3Department of Biomedical Engineering, Linköping University, Linköping, Sweden
Synopsis
Hepatic uptake rate of Gadoxetate is a liver function biomarker. Different approaches for pharmacokinetic modelling exists, both with regards to model architecture and choice of input data, with both blood and spleen being used to estimate input‑function. We fitted three models to perfusion data, using both aorta and portal venous inputs, as well as splenic input. We showed that the hepatic uptake rate of Gadoxetate is robust, in that the uptake rate is not very dependent on how the liver perfusion is modelled. However, the choice of vascular or splenic input can affect the uptake rate.
Purpose
Hepatic uptake rate of the liver‑specific contrast agent Gadoxetate, estimated by pharmacokinetic modelling of dynamic contrast‑enhanced MRI (DCE‑MRI) data, is a biomarker for liver function. Several different imaging- and modeling approaches exist [1-5]. One uses perfusion imaging and a dual-inlet two-compartment uptake model (2‑2CUM) [1,2], which in addition to the uptake rate also estimates perfusion parameters. Another model is the Patlak model, which is a simplification of 2‑2CUM, with the assumption that the blood flow is infinite. The Patlak model have been applied to data from both humans [3] and rats [4]. When applied to rats, the Patlak model uses the spleen as input, as opposed to the aorta and portal vein, because of the difficulty of performing accurate measurements in rat blood vessels. A third approach simulates the distribution of Gadoxetate in the whole body (whole-body model) [5] using coupled ordinary differential equations with outputs being the liver and spleen concentrations, which are both fitted to data, thus effectively using the spleen as input‑function.
Since there are different approaches in model architecture as well as in the choice of input data, the purpose of this work was to investigate how robust the estimated hepatic uptake rate is to differences in choices of model architecture and input data.
Methods
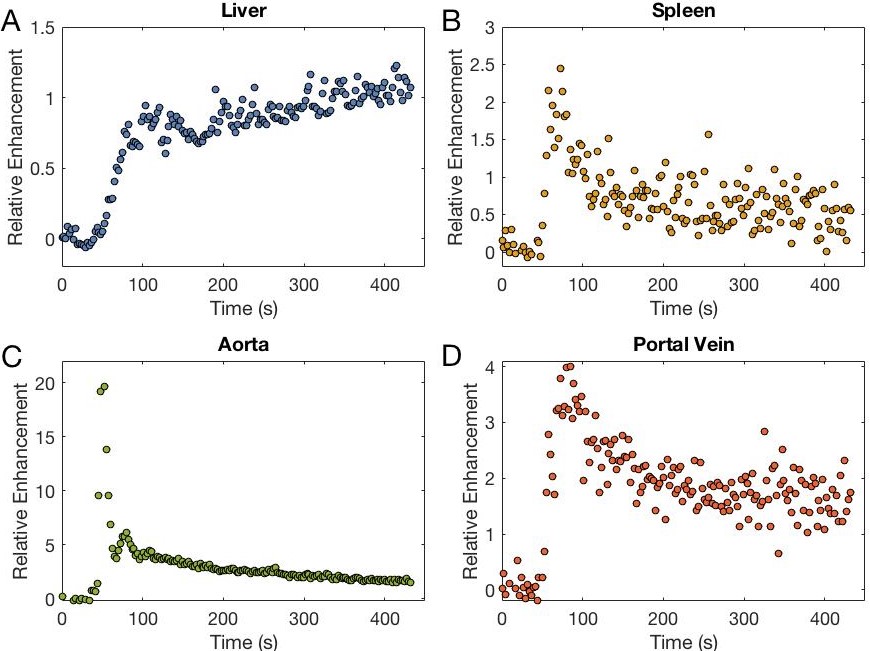
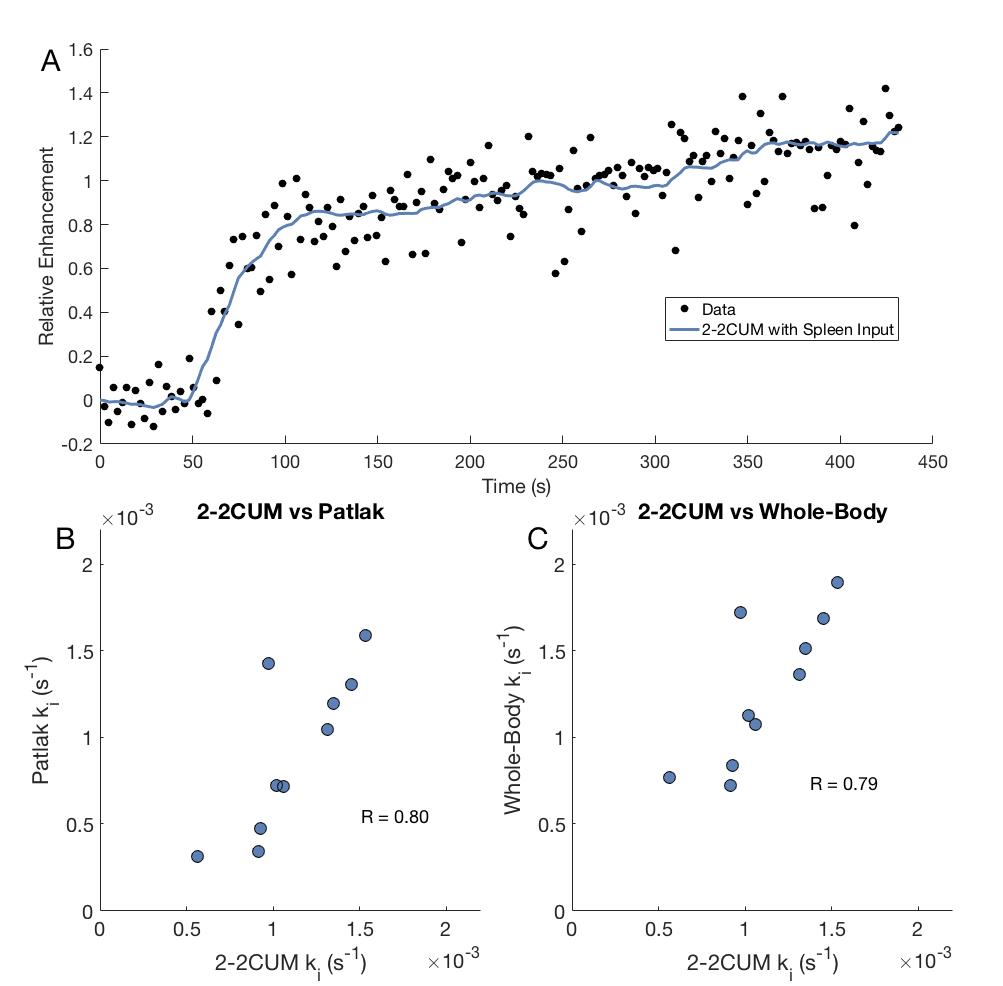
DCE-MRI was performed on ten patients with colorectal metastases for 5 min at 2.2 seconds per volume of 48 coronal slices, with a 3D T1-weighted spoiled gradient-echo sequence (TWIST, time-resolved angiography with stochastic trajectories). 0.1 mL/kg of Gadoxetate was injected at 2 mL/sec and flushed with 30 mL of saline. Regions of interest were drawn around the liver, around the spleen, in the aorta, and in the portal vein. Gadoxetate concentration was estimated as relative enhancement, S(t)/S0 - 1, where S(t) is the signal intensity and S0 is the average signal intensity before Gadoxetate injection (Fig1).
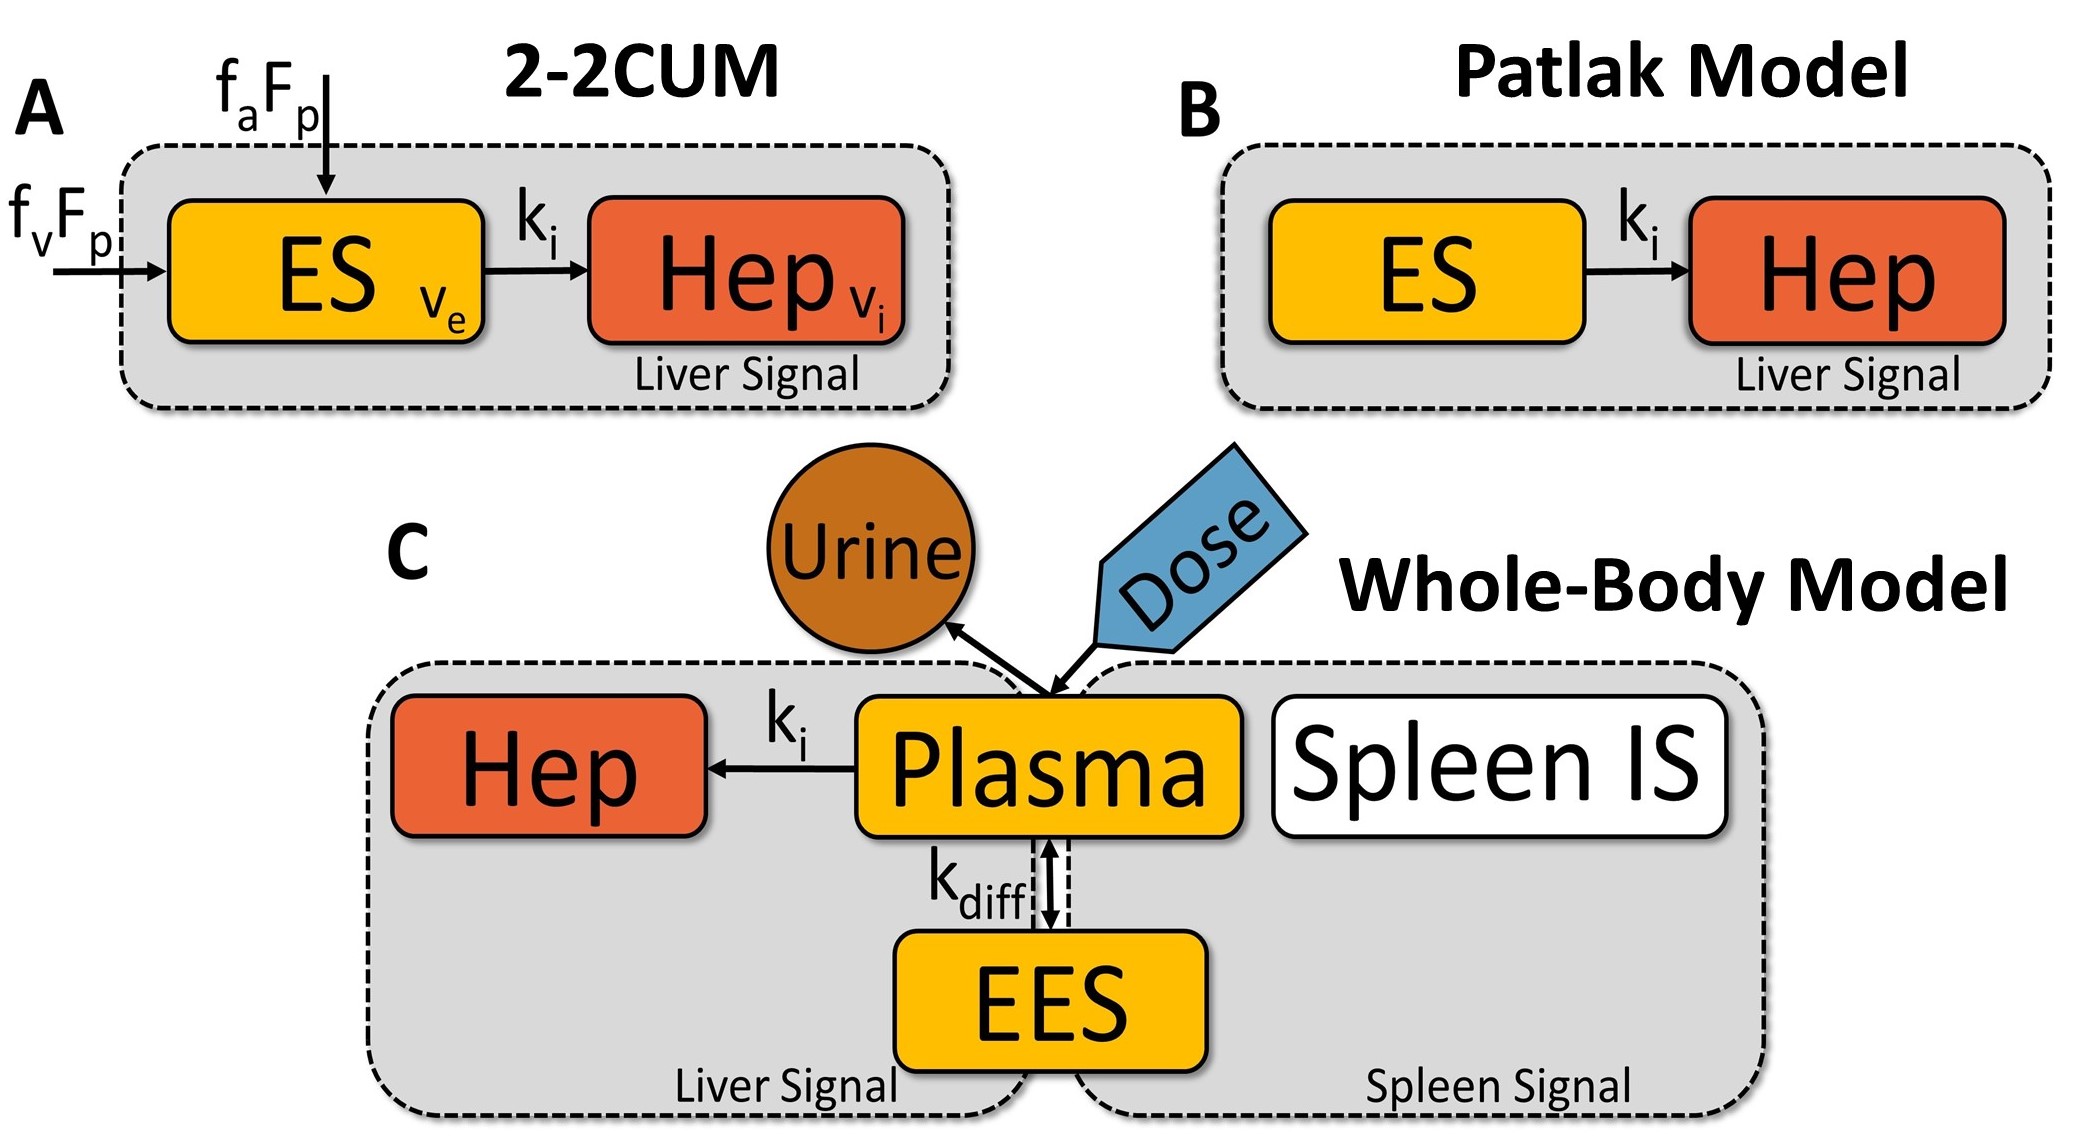
Three pharmacokinetic models were tested, the 2‑2CUM [1,2] (Fig 2A), the Patlak model [3,4] (Fig 2B) and the whole‑body model [5] (Fig 2C). The 2‑2CUM was first applied using aorta and portal venous inputs. The Patlak and whole‑body models were both applied using the spleen as input. To investigate if any disagreement in uptake rates from the 2‑2CUM and the other models are due to differences in model architecture, or the different inputs, the 2‑2CUM was re‑fitted to the data, the second time using the spleen as input.
All models were fitted to the same datasets using least squares fitting and the hepatic uptake rates were compared. Since the acquisition was only five minutes long, any Gadoxetate efflux was considered negligible.
Results
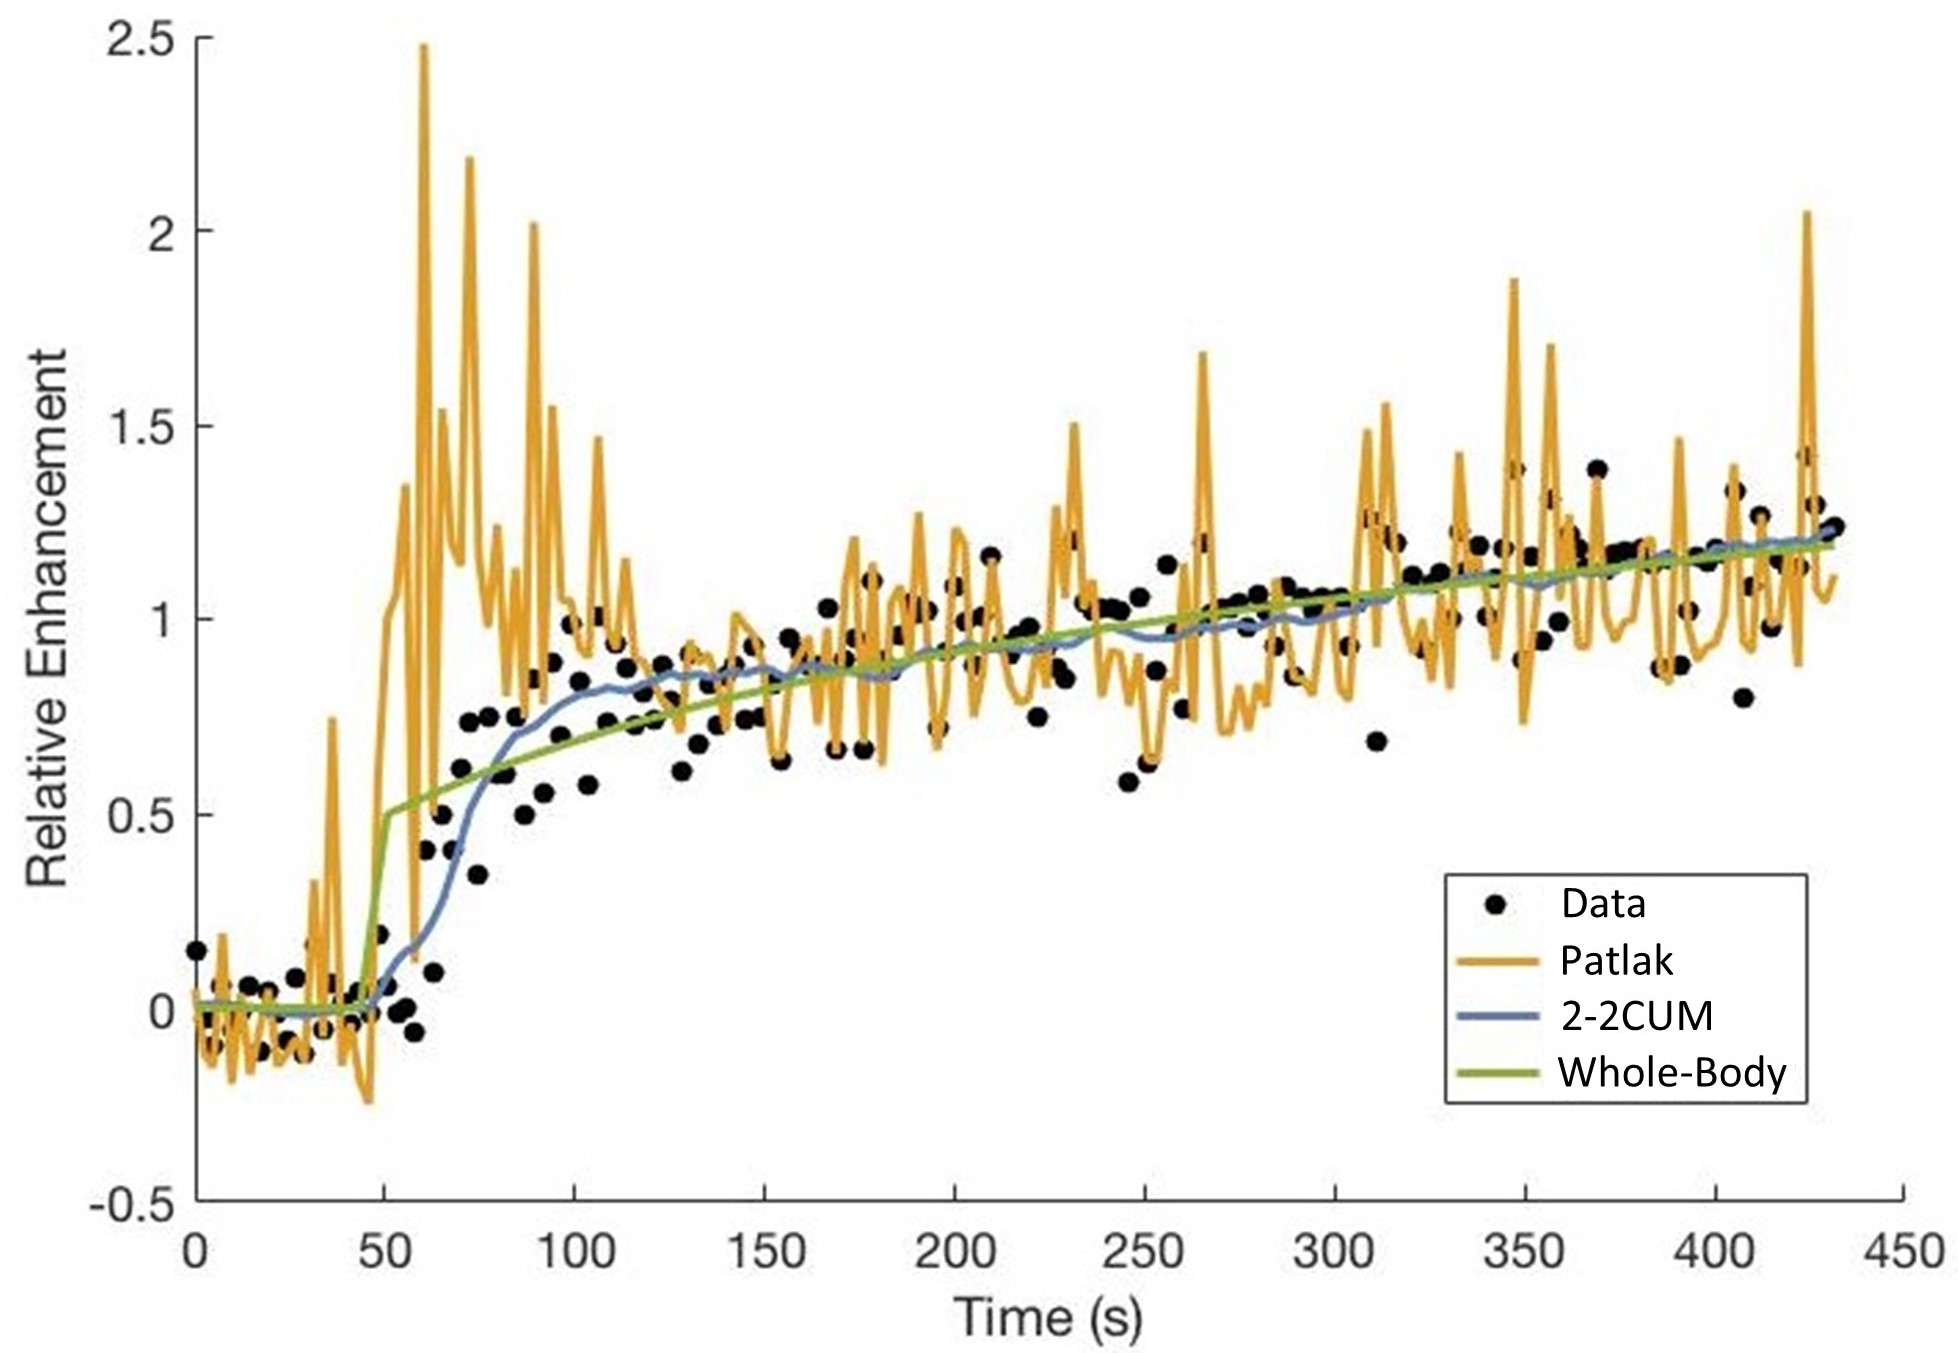
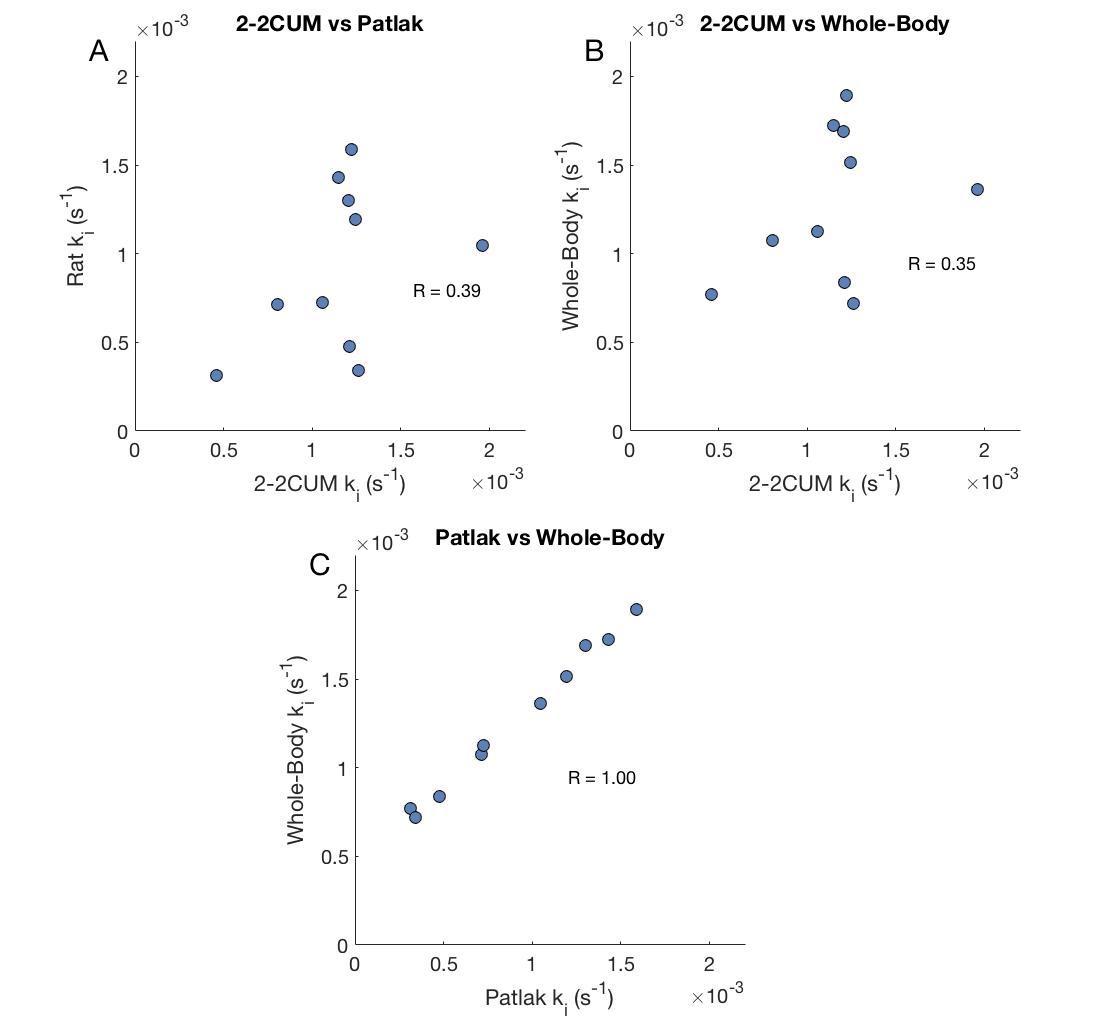
Fig 3 shows the fits of all three models for one patient. The figure shows that the perfusion model provided the best fit. Correlation between the hepatic uptake rates, ki, from the perfusion and rat models (Fig 4A; R=0.39), as well as between the perfusion and whole‑body (Fig 4B; R = 0.35) were lower than the correlation between the rat and whole‑body models (Fig 4C; R = 1.0).
Fig5 shows that the 2‑2CUM can still fit the data when using the spleen as input and that the correlation with both the Patlak (R = 0.80) and whole‑body model (R = 0.79) increases.
Discussion
We found an almost perfect correlation between the hepatic uptake rates estimated by the Patlak and whole‑body models, when both models used the spleen as input. Meanwhile the correlation with the perfusion, using aorta and venous inputs, was much worse. The largest reason for this discrepancy is the use of different input signals. The correlation between the uptake rates improved when we replaced the aorta and portal vein with the spleen as inputs for the 2‑2CUM, i.e. all three models had the same input. The remaining differences could be because the 2‑2CUM can account for differences in e.g. liver perfusion and size of the extracellular space.
We also showed that the perfusion model could best fit the data used here. The rat and whole‑body models both had problems fitting during the first minute after Gadoxetate injection. The main reason for this is that they cannot properly account for the early first pass stages, particularly the whole‑body model, as the model simply assumes that the blood is always perfectly mixed.
Conclusion
The hepatic uptake rate of Gadoxetate is robust, in that the uptake rate is not very dependent on how the liver perfusion is modelled. However, the choice of vascular or splenic input can affect the uptake rate.Acknowledgements
No acknowledgement found.References
1. Sourbron S, et al. Combined quantification of liver perfusion and function with dynamic gadoxetic acid–enhanced MR imaging. Radiology 2012, 263(3):874-883.
2. Sourbron S, et al. Tracer kinetic modelling in MRI: estimating perfusion and capillary permeability. Phys Med Biol 2013, 57(2): R1.
3. Saito, K., et al. Assessing liver function using dynamic Gd-EOB-DTPA-enhanced MRI with a standard 5-phase imaging protocol. J Magn Reson Imaging 2013, 37(5): 1109-1114.
4. Ulloa JL, et al. Assessment of gadoxetate DCE‐MRI as a biomarker of hepatobiliary transporter inhibition. NMR in Biomedicine 2013, 26(10): 1258-1270.
5. Forsgren MF, et al. Physiologically realistic and validated mathematical liver model revels hepatobiliary transfer rates for Gd-EOB-DTPA using human DCE-MRI data. PLoS ONE 2014, 9(4).
Figures