1766
Quantitative evaluation of hepatic steatosis using rapid multi-echo Dixon technique in patients with obesity1Department of Radiology, Henan Provincial People’s Hospital, Zhengzhou,Henan, China, 2Henan Key Laboratory for Medical Imaging of Neurological Diseases, Zhengzhou,Henan, China, 3Cooperative Innovation Center of Internet Healthcare,Zhengzhou University, Zhengzhou,Henan, China, 4School of Software and Applied Technology, Zhengzhou University, Zhengzhou,Henan, China
Synopsis
This study aimed to demonstrate the feasibility and accuracy of magnetic resonance imaging multi-echo Dixon rapid liver fat quantitative analysis for liver fat content in the obese patients. In the first of our study, we performed liver scan on 17 obese patients using multi-echo Dixon rapid liver fat quantification technique and then we re-measured the entire liver fat content by previous method manually drawing ROIs on each liver segment. The Bland-Altman plots and Pearson correlation analysis were performed on the quantitative results of the above two methods. There statistical analysis showed there were good consistence and highly correlated with the two methods. We found the multi-echo Dixon rapid liver fat quantitative can simply, feasibility and accurately assess the liver fat content in the patients with obese .
Background and Purpose
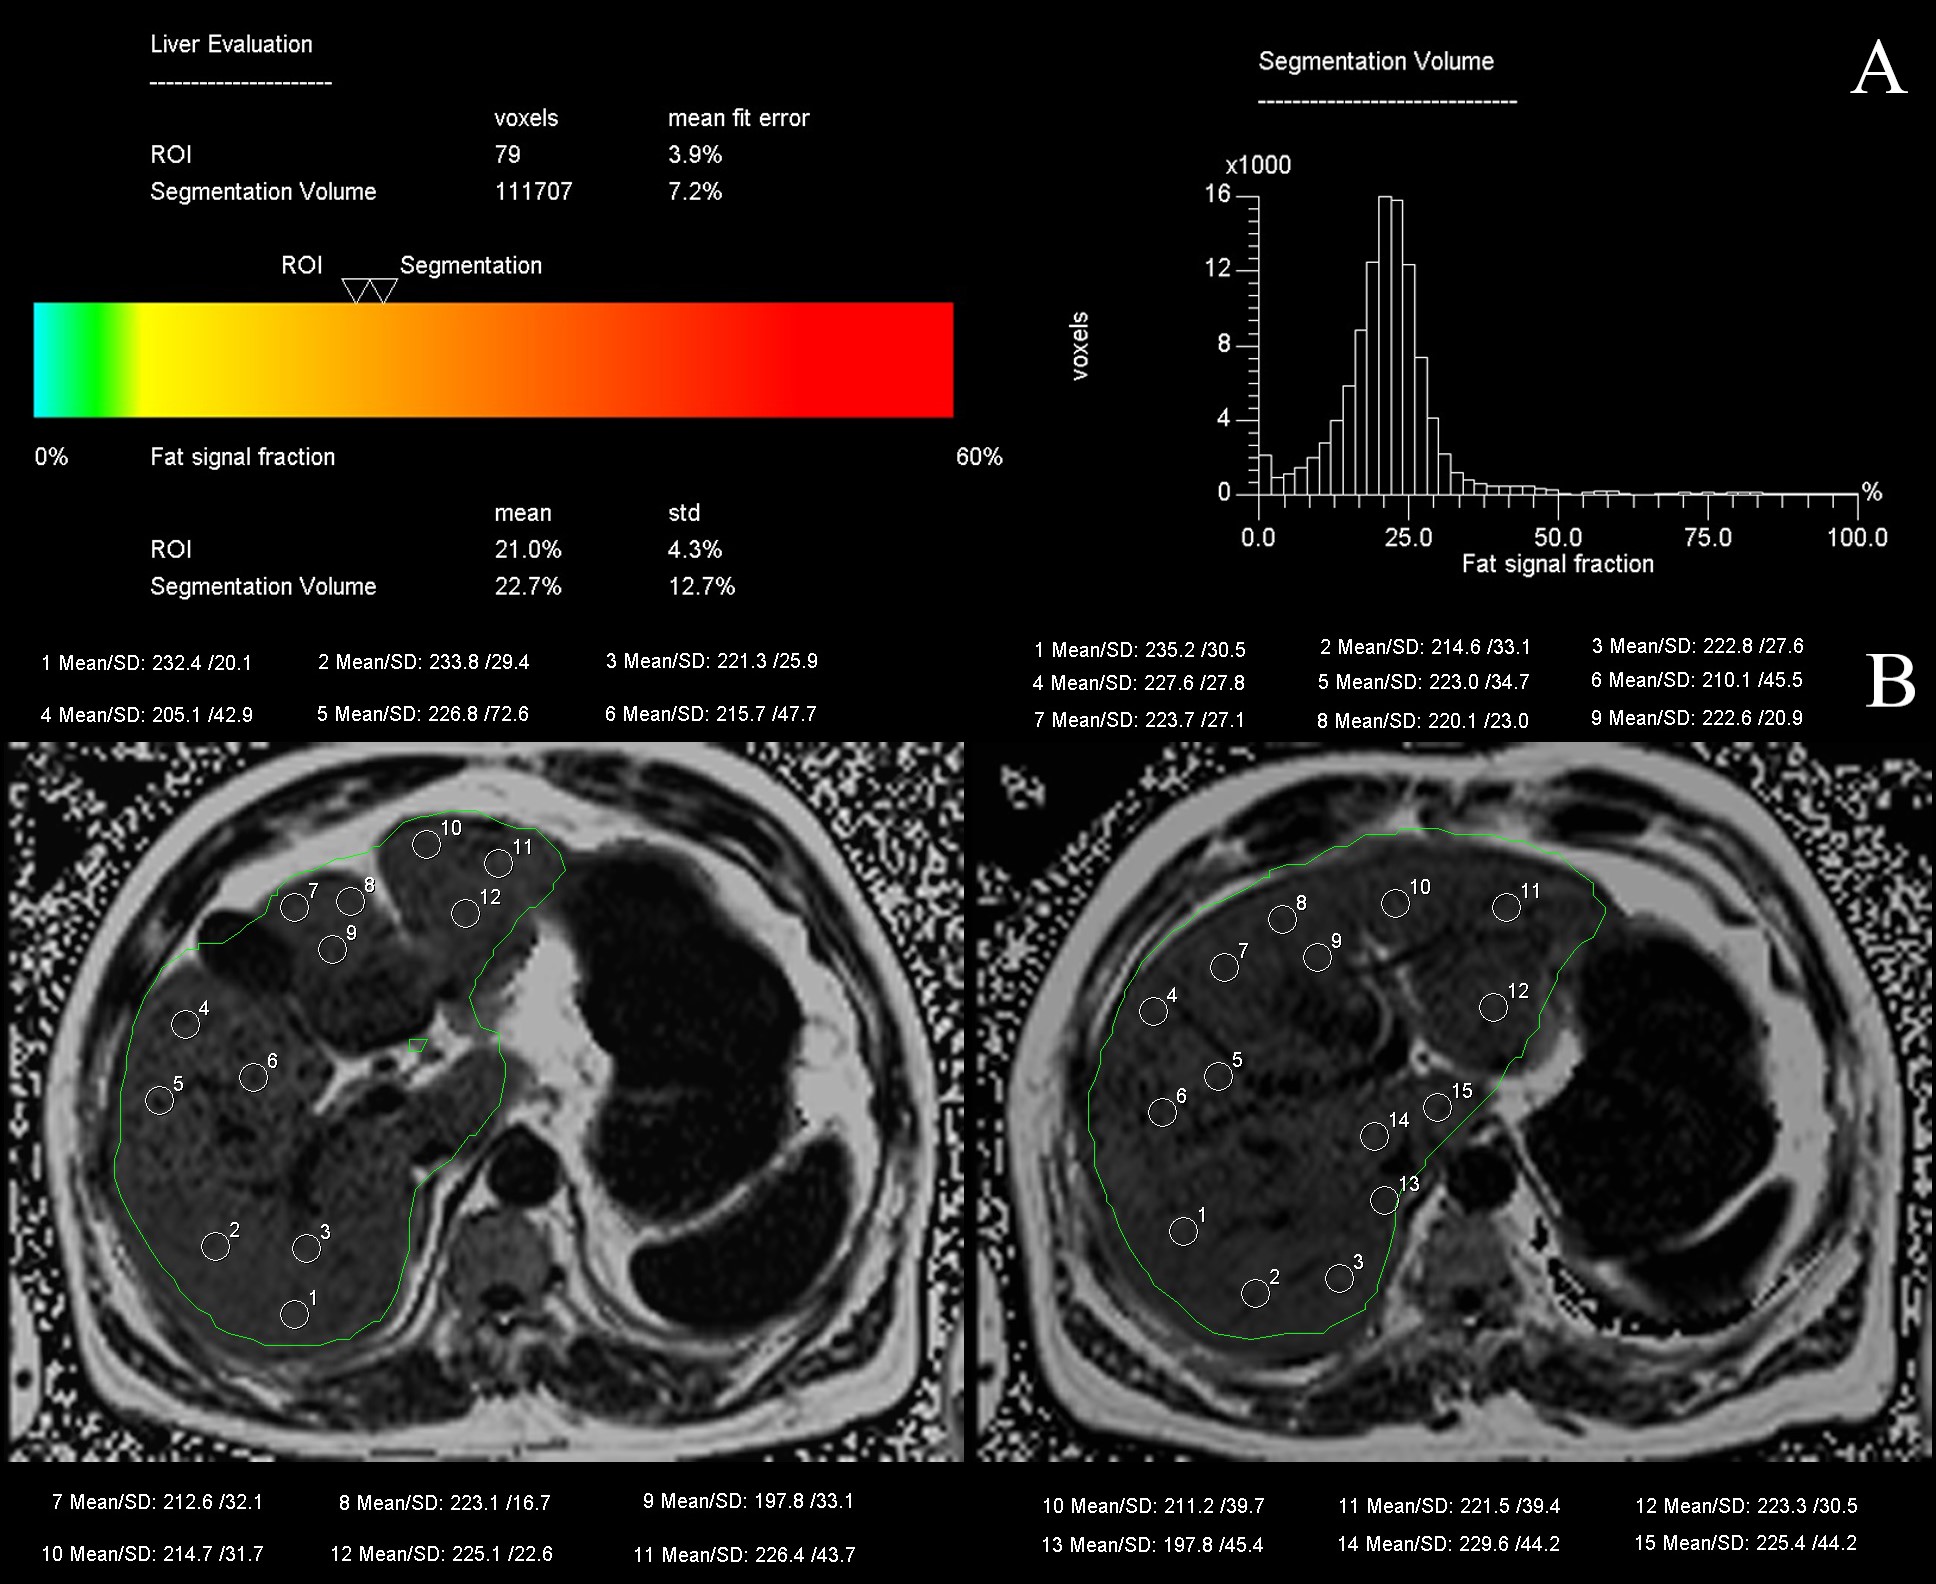
Hepatic steatosis is prone to occurring in the patients with obesity and can lead to the development of non-alcoholic fatty liver disease (NAFLD)1. Multi-echo Dixon has been shown to be a promising accurate method for assessing the fat content in the liver2-4. Quantitative analysis of whole liver fat commonly used manually drawing regions of interest (ROIs) on all liver segments in previous studies5,6. However, the analysis procedure is too complex. A rapid and accurate approach to replace the manual method is in urgent need for clinical work. The purpose of this research is to evaluate the clinical utility of a new multi-echo Dixon rapid liver fat quantitative analysis method.Materials and Methods
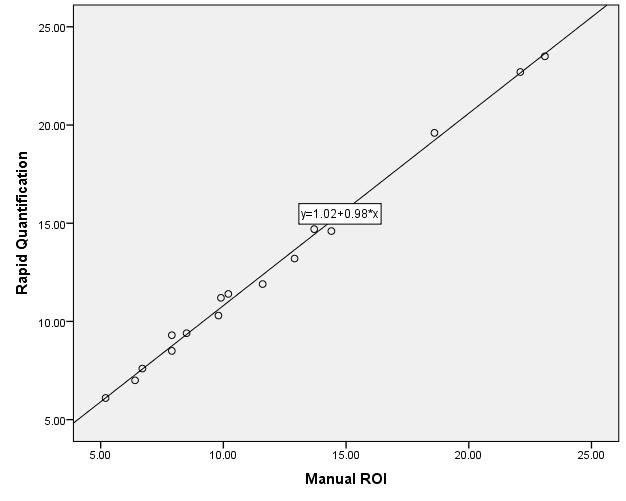
This study was approved by the local institutional review board and written informed consent of all participants was obtained. A total of 17 obese patients(Age: 47.53 ± 11.48 years, 12 males, and BMI≥28Kg/m2)underwent scanning on a 1.5T MAGNETOM Sempra MR scanner (Siemens Healthcare, Erlangen, Germany) with a 8-channel body coil usinga multi-echo Dixon sequence with the following parameters: TR=15.63 ms, TE=2.39/4.76/7.13/9.50/11.87/14.24 ms, flip angle=4.0 degree, slice thickness=3.5 mm, slices=64, total acquisition time=18 s. liver was segmented automatically and the liver tissue is automatically recognized, and the mean liver fat fraction is visualized by a rainbow report graph. The liver fat fraction map generated by the multi-echo Dixon scan is transmitted to the post-processing workstation, avoiding organ boundaries, imaging artifacts, major vessels, and bile ducts, three round non-overlapping regions of interest (ROI) were placed manually in the center of each Couinaud segment(Ⅰ、Ⅱ、Ⅲ、Ⅳa、Ⅳb、Ⅴ、Ⅵ、Ⅶ and Ⅷ)of the liver to re-measure the fat fraction of the entire liver, then calculate the mean fat fraction of the liver by averaging. Finally, the Bland-Altman plots and Pearson correlation analysis were performed to compare quantitative results of the above two methods.Results
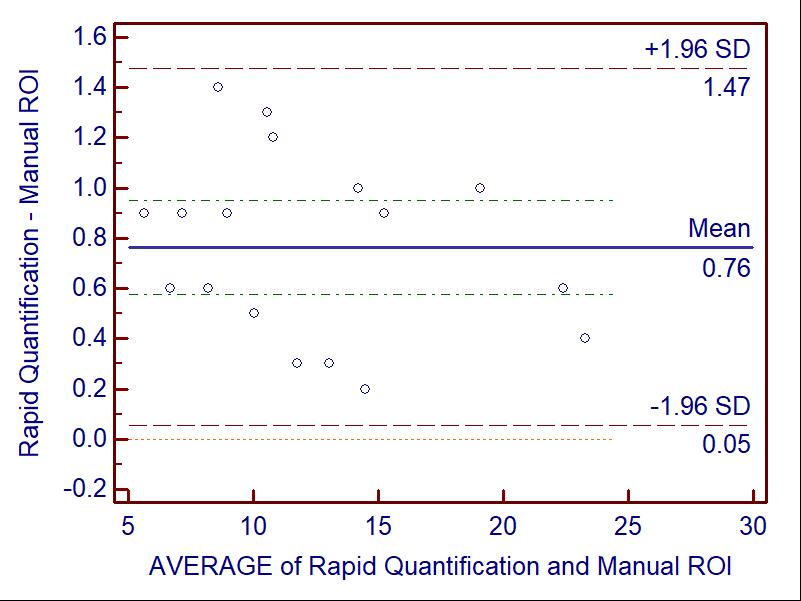
The mean liver fat fraction (Mean ± Standard Deviation) of all the 17 patients with rapid quantitative results and manual delineation of ROI measurements were 12.75 ± 5.21 and 11.95 ± 5.30, respectively. The quantitative results were highly correlated (r=0.998, P<0.01). Bland-Altman analysis showed that the average value of difference between the rapid liver fat quantification and manual ROI was 0.76, with a 95% confidence interval from 0.05 to 1.47. All of the differences in 17 subjects between two methods were within range of 95% confidence interval.Conclusion
There is a highly correlation and good consistence between the rapid liver fat quantification results and manual ROI. The multi-echo Dixon MRI approach may enable rapid and accurate identification of hepatic steatosis in patients with obesity.Acknowledgements
This research was supported by the NNSFC (81720108021, 81772009,81601466,81641168, 31470047), National Key R&D Program of China (YS2017YFGH000397), Scientific and Technological Research Project of Henan Province (182102310162) and the Key Project of Henan Medical Science and Technology Project (201501011).
We acknowledged Dr. Xianchang.Zhang (Siemens Healthcare Ltd., Beijing, China ) for his technical help.
References
1. Fan JG, Kim SU, Wong VW. New trends on obesity and NAFLD in Asia. J Hepatol. 2017. 67(4): 862-873.
2. Hetterich H, Bayerl C, Peters A, et al. Feasibility of a three-step magnetic resonance imaging approach for the assessment of hepatic steatosis in an asymptomatic study population. European Radiology. 2016. 26(6): 1895-904.
3. Yokoo T, Shiehmorteza M, Hamilton G, et al. Estimation of hepatic proton-density fat fraction by using MR imaging at 3.0 T. Radiology. 2011. 258(3): 749-59.
4. Bashir MR, Zhong X, Nickel MD, et al. Quantification of hepatic steatosis with a multistep adaptive fitting MRI approach: prospective validation against MR spectroscopy. AJR Am J Roentgenol. 2015. 204(2): 297-306.
5. Idilman IS, Aniktar H, Idilman R, et al. Hepatic steatosis: quantification by proton density fat fraction with MR imaging versus liver biopsy. Radiology. 2013. 267(3): 767-75.
6. Bonekamp S, Tang A, Mashhood A, et al. Spatial distribution of MRI-Determined hepatic proton density fat fraction in adults with nonalcoholic fatty liver disease. J Magn Reson Imaging. 2014. 39(6): 1525-32.
Figures