1764
MRI Relaxometry based Liver Iron Content Determination: Comparing Gradient-Echo R2* and Spin-Echo with respect to Age and Gender1Dept. for Diagnostic and Interventional Radiology, Ulm University, Medical Center, Ulm, Germany, 2Section for Experimental Radiology, Ulm University, Medical Center, Ulm, Germany, 3Clinic for Pediatric and Adolescent Medicine, Ulm University, Medical Center, Ulm, Germany
Synopsis
To address probable differences in signal characteristics between spin-echo (SE) and gradient-echo (GRE), 83 patients suspected for liver iron overload were investigated with 1.5 T MRI with the approved Ferriscan® method based on SE, and a prototype breathhold 3D GRE protocol employing parallel imaging with in-line R2* calculation. R2* values were correlated with reference LIC for all patients together and in subgroups according to age and gender. Highly significant differences (P=0.009) were found between males and females in the age range from 12 to 45 years, possibly reflecting different underlying iron storage mechanisms.
Purpose
To investigate correlation between liver iron content (LIC) determined with a reference method working with Spin-Echo (SE) and R2*, determined by breathhold gradient echo (GRE) and vendor-implemented R2* relaxometry. Our special interest was dependence of linear correlation parameters on patient gender and age.Methods
83 patients (33 f, 50 m, age range 4 to 54 y, mean ± SD: 23.2 ± 13.8 y) suspected for liver iron overload were investigated with 1.5 T MRI (MAGNETOM Avanto, Siemens Healthcare, Erlangen, Germany). Transversal slices of the liver were acquired for the Ferriscan® method (Resonance Health, Burswood, Australia) with SE at five TEs ranging from 6 to 18 ms in separate single-echo acquisitions. Eleven slices (5mm, 100% gap) with a spatial resolution of 1.64x1.64 were acquired. Analysis of these data yielded LIC reference values. Also, fifty-six transversal partitions of 4 mm thickness (no gap) at 2.5x2.5 mm voxel size were acquired using a breathhold 3D GRE protocol employing parallel imaging in both phase and slice encoding direction1. Minimum TE and TE spacing was 1.2 ms for the first five echoes (TE 1.2 to 6 ms), a sixth echo was acquired at TE of 9 ms. This prototype implementation determined R2* in-line for each voxel, accounting for signal modulation by fat/water-dephasing2. To obtain mean R2* values for each patient, five slices were evaluated by manually placing three regions of interest (ROI) in liver tissue free of vessels and artifacts. Patients were divided into four subgroups according to age and gender: 1) females aged 12-45 y with active menstrual cycle and 2) age-matched males (12-45 y), 3) females below 12 and above 45 y, and 4) males below 12 and above 45 y. Linear correlation of R2* with reference LIC values was analyzed for all patients together, as well as separated by age and gender. Significance of differences between linear correlation parameters was determined3.Results
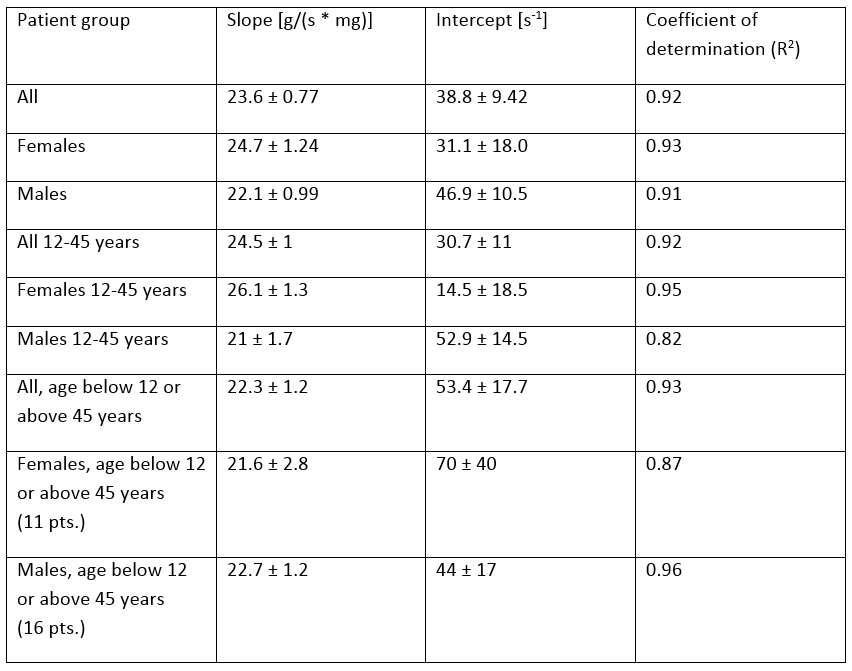
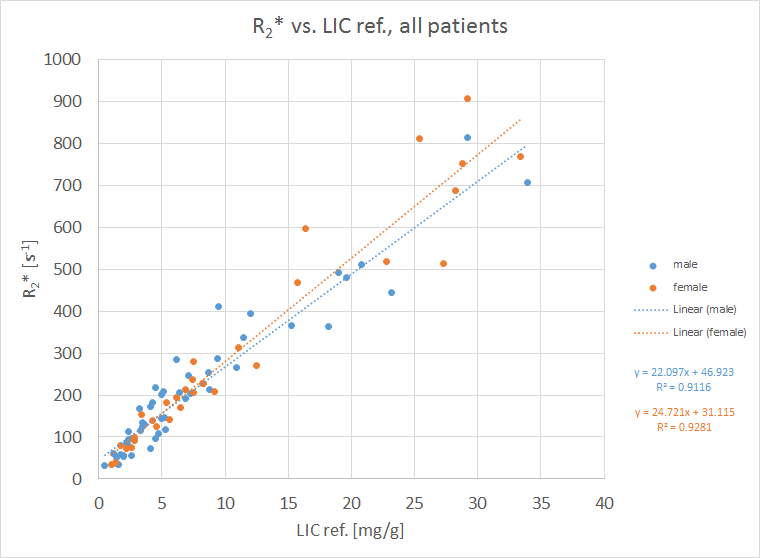
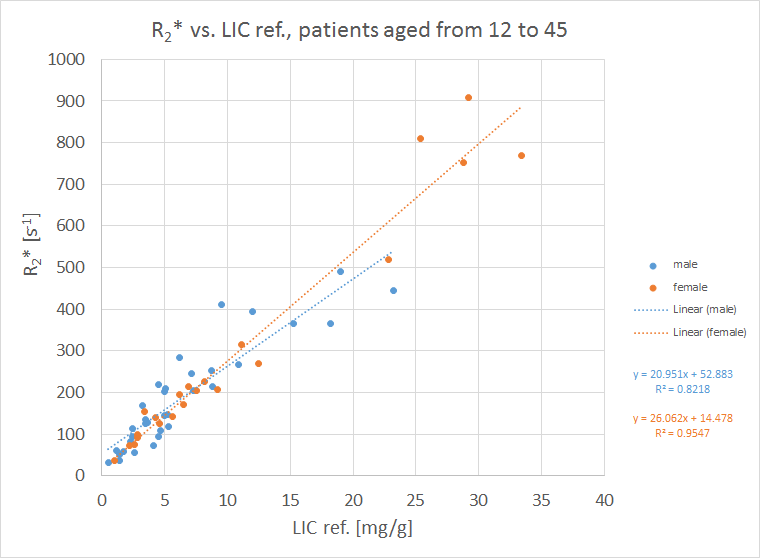
We found LIC values between 0.5 to 33.9 mg/g liver dry wt. in our patient group. Linear correlation was excellent with coefficient of determination (R2) of 0.92 for all patients, yielding values for slope of 23.6 ± 0.77 s*mg/g and intercept of 38.8 ± 9.4 s-1. For correlation parameters in patient subgroups refer to table 1. Differences between males and females of all ages failed to reach significance (P = 0.055), cf. Fig. 1, while highly significant differences were found between males and females aged 12-45 years (P = 0.009), see Fig. 2.Discussion
We found excellent linear correlation between R2* and LIC in our patient group. However, slope of regression line was lower than the value published by Wood et al4, who used R2* calculation by a monoexponential fit, but were in line with work of Hernando et al.5 and Wunderlich et al.6 where R2* was determined taking into account signal modulation due to fat-water dephasing.
Correlation parameters of R2* and LIC determined based on R2 (SE) differed in age and gender-specific patient subgroups. Age range was chosen to include females with active menstrual cycle (12-45 years), causing iron loss, and age-matched males. It remains unclear whether differences are caused by certain signal characteristics of SE or GRE sequences reflecting deviating liver iron storage mechanisms. In general, it is already known that GRE and SE MR is sensitive not only to LIC, but also confounding effects, e.g. liver iron aggregation7.
Clinical relevance
Patient characteristics like age and gender should be considered in GRE based MRI-based studies attempting to determine LIC.Acknowledgements
We acknowledge Stephan Kannengießer and Berthold Kiefer (both Siemens Healthcare GmbH) for providing the prototype GRE implementation and help with the manuscript.References
1. Breuer FA, Blaimer M, Mueller MF, et al. Controlled aliasing in volumetric parallel imaging (2D CAIPIRINHA). Magn Reson Med. 2006; 55(3): 549-556
2. Zhong X, Nickel MD, Kannengiesser SA,et al. Liver fat quantification using a multi-step adaptive fitting approach with multi-echo GRE imaging. Magn Reson Med. 2014; 72(5): 1353-1365
3. Eid M, Gollwitzer M and Schmidt M: Statistik und Forschungsmethoden, Beltz-Verlag 2011, S. 547 f
4. Wood JC, Enriquez C, Ghugre N, et al., MRI R2 and R2* mapping accurately estimates hepatic iron concentration in transfusion-dependent thalassemia and sickle cell disease patients. Blood 2005;106: 1460-1465
5. Hernando D, Qazi N, Reeder SB, in: Proceedings of the Annual ISMRM Meeting (Salt Lake City, USA, 2013), p. 4194
6. Wunderlich AP, Klömpken S, Cario H, et al. In: Proceedings of the Joint Annual Meeting ISMRM-ESMRMB (Milan, Italy, 2014), p. 140
7. Jensen JH, Tang H, Tosti CL, et al. Separate MRI quantification of dispersed (ferritin-like) and aggregated (hemosiderin-like) storage iron. Magn Reson Med. 2010; 63(5): 1201-1209
Figures