1763
Relation between T1 and T2 of liver water and fat and Proton Density Fat Fraction estimated by a flip angle corrected multi-TR, multi-TE single breath-hold 1H MRS STEAM sequence1Liver Imaging Group, Department of Radiology, University of California San Diego, La Jolla, CA, United States, 2NAFLD Research Center, Division of Gastroenterology, Department of Medicine, University of California San Diego, La Jolla, CA, United States
Synopsis
We examine the relationship between liver water and fat T1 and T2, and PDFF in adult subjects undergoing non-contrast exams using a version of the multi-TR, multi-TE 1H MRS sequence that estimates and corrects for flip angle based on a non-steady-state approach.
Introduction
Relationships between liver water and fat T1 and T2, and PDFF have been examined using a multi-TR, multi-TE (MTRTE) 1H MRS sequence (1,2) assuming steady-state conditions. That sequence requires generation of a precise 90° pulse, which is challenging for in vivo liver MRS. As flip angle generated errors seen in fat and water may be related, errors in B1 calibration may introduce artefactual correlations between measurements. Further flip angle introduced variability may obscure relationships between other measurements. To address these challenges, we developed a flip-angle-corrected version of the MTRTE sequence (FAC MTRTE) that estimates and corrects for flip angle based on a non-steady state approach (3). Here we use FAC MTRTE with updated sequence timing to re-examine relationships between liver water and fat T1 and T2, and PDFF in adult subjects undergoing non-contrast MR exams.Methods
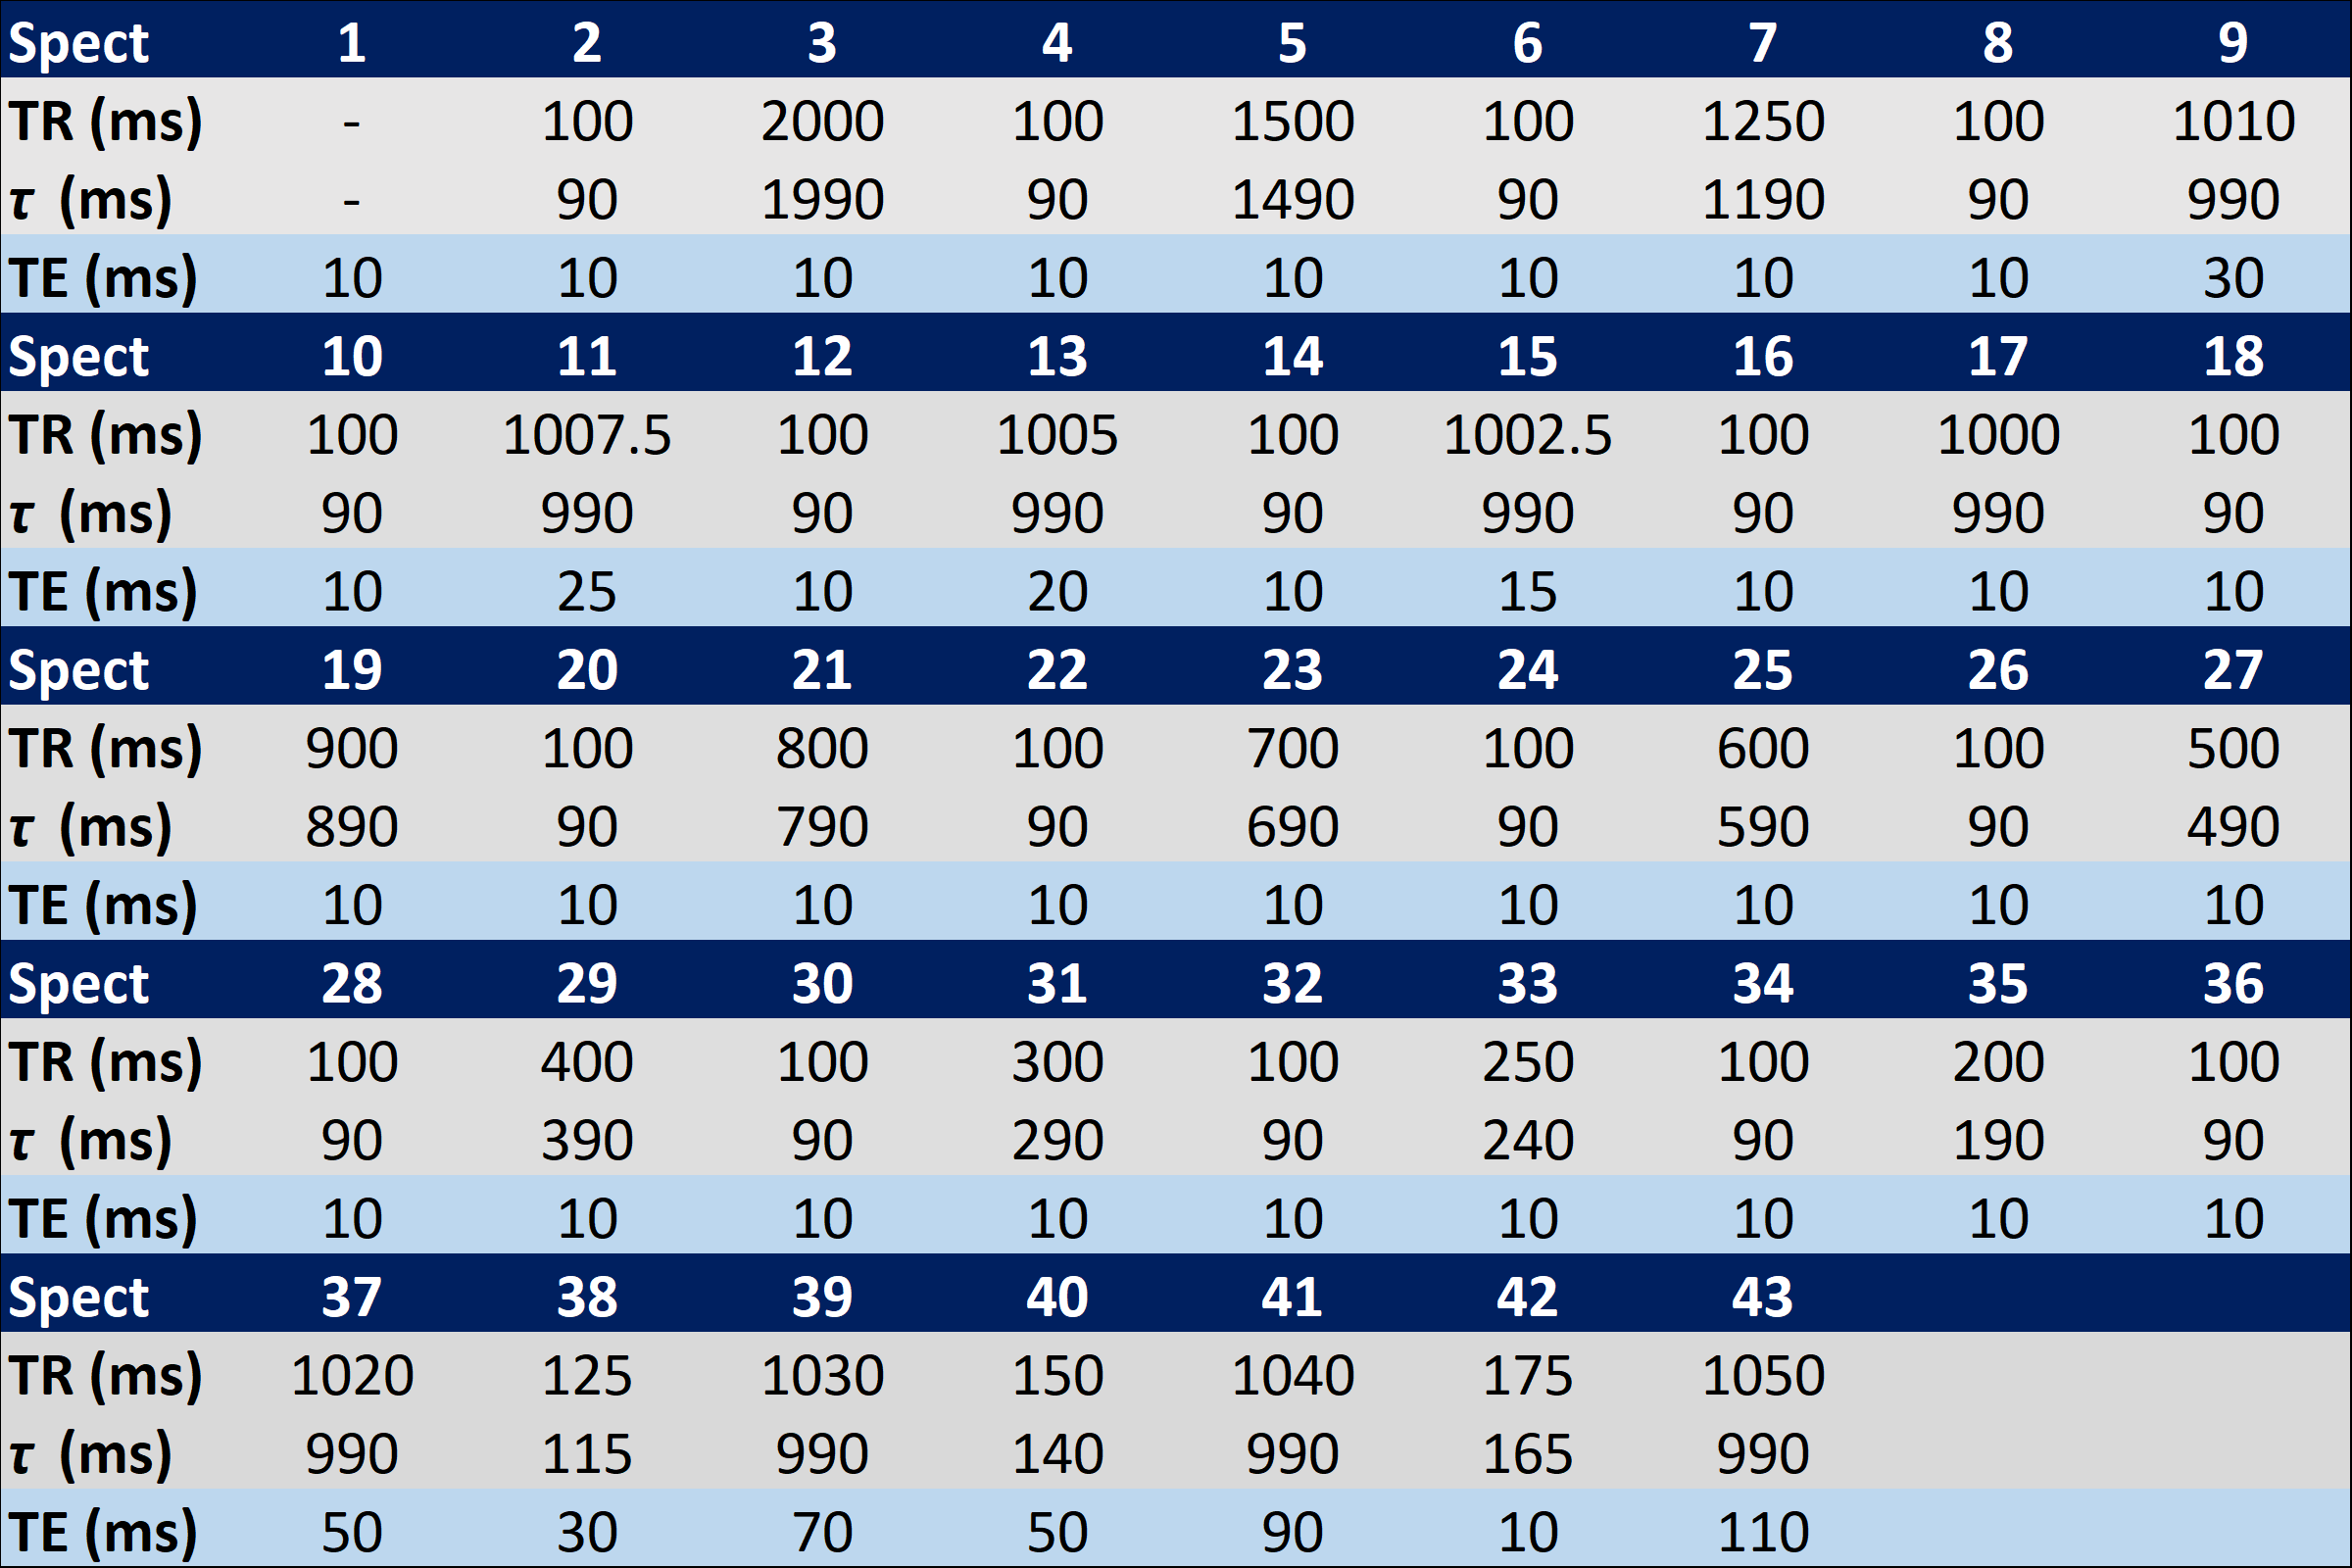
108 adult subjects (mean age 50.1 yrs, range 23-75 yrs, 46 male, 62 female) with known or suspected nonalcoholic fatty liver disease provided written informed consent in this IRB-approved, HIPAA-compliant study and underwent FAC MTRTE at 3 Tesla (GE Signa EXCITE HD, GE Healthcare, Waukesha, WI). The FAC MTRTE sequence acquires 43 STEAM spectra in a single 21 s acquisition (timings shown in Table 1). The large changes in consecutive TRs maximize non-steady-state conditions allowing flip angle estimation. A 20x20x20 mm voxel was placed in the liver, avoiding major blood vessels and bile ducts, the gallbladder, and liver edges. No spatial or chemical saturation was used. Signals from different array elements were combined using an SVD technique (4) and a single experienced observer analyzed the spectra using the AMARES algorithm (5) included in the MRUI software package (6).
To estimate T1 and T2, longitudinal magnetization for each spectrum (Mn) was calculated by
$$M_{n}=M_{n-1}e^{(-\tau_{n}/T1)}cos(\alpha)+M_{0}(1-e^{(-\tau_{n}/T1)})$$
with signal (Sn) given by
$$S_{n}=M_{n}e^{(-TE_{n}/T2)}sin(\alpha)$$
where α is the flip angle, M0 the equilibrium longitudinal magnetization, and τn and TEn as listed in Table 1. The calculated signals for each spectrum were then non-linearly fitted to the measured peak areas. PDFF was estimated as the ratio of corrected fat signal to the sum of corrected water and fat signals, adjusted for fat included in the 'water' peak (7). Estimates of water and fat T1 and T2, and PDFF were compared graphically, and relationships between the observed quantities were investigated using Pearson Correlation.
Results
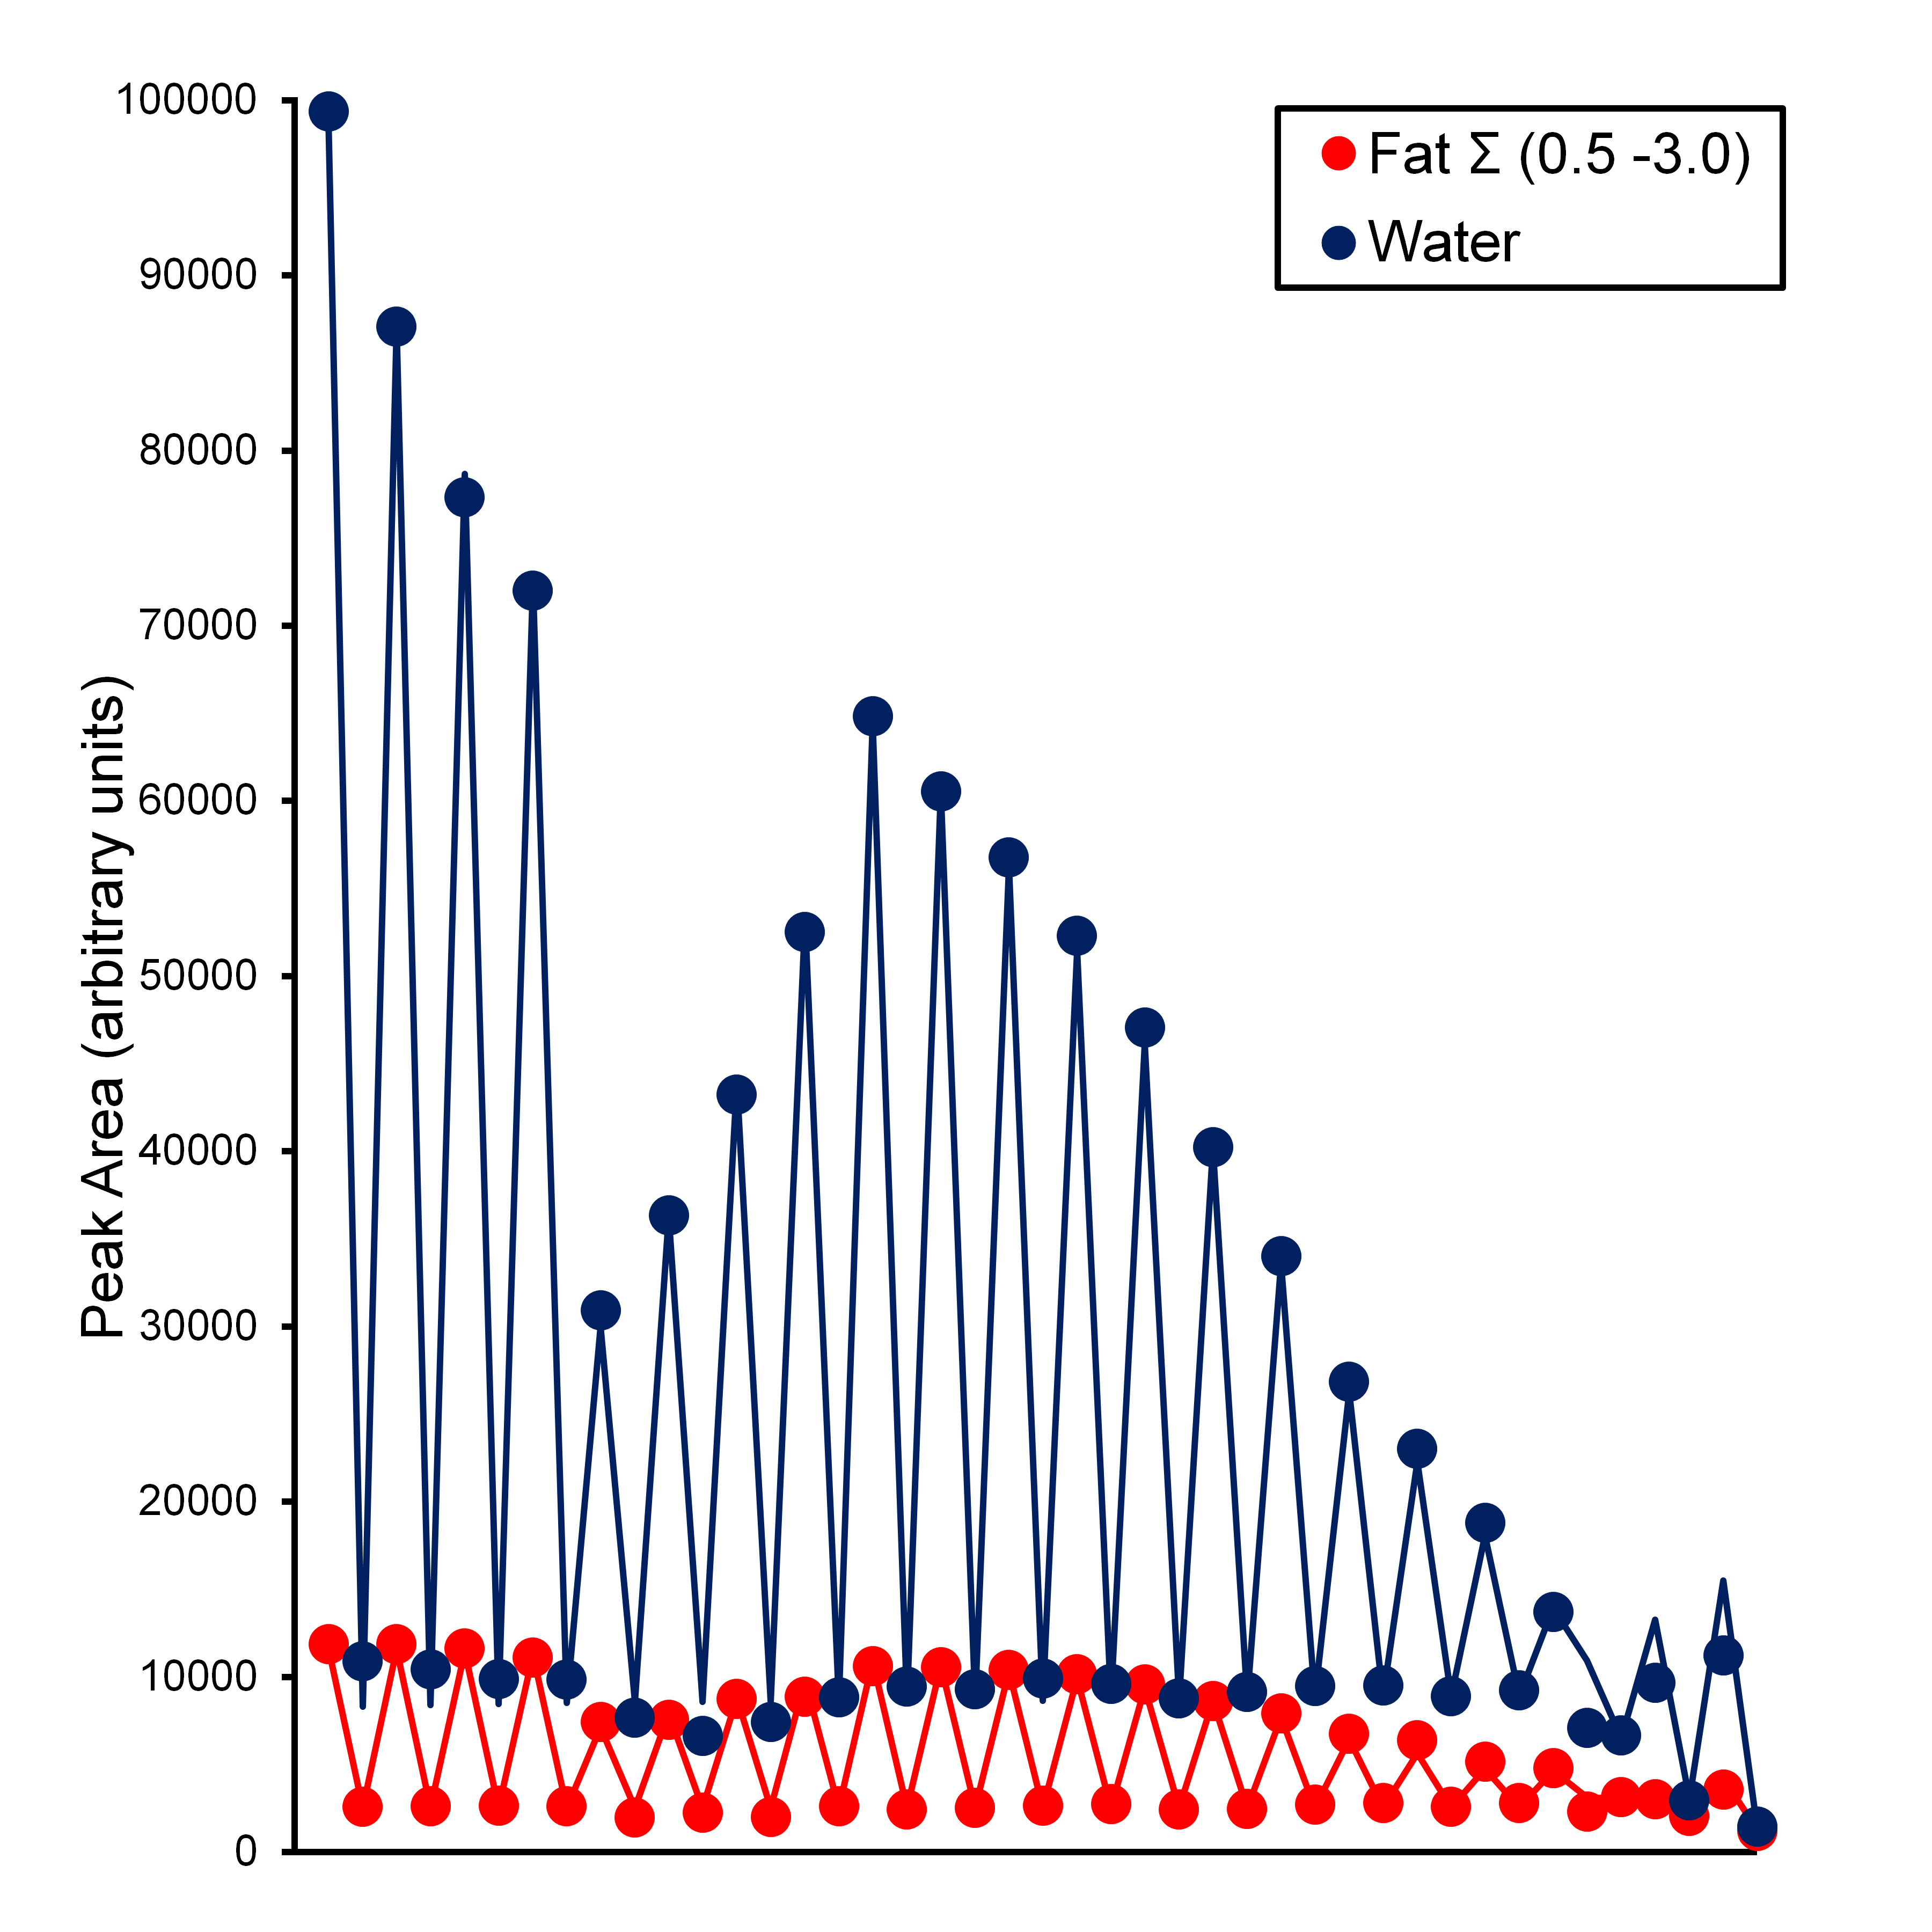
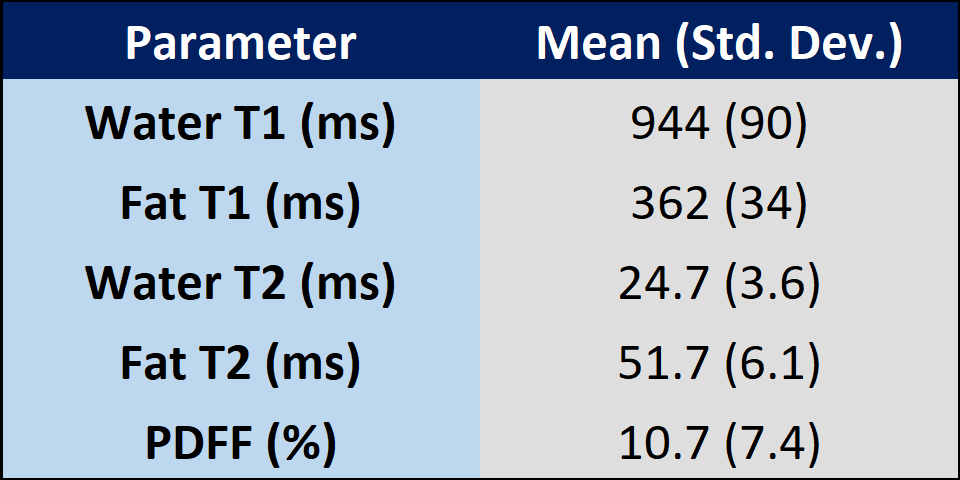
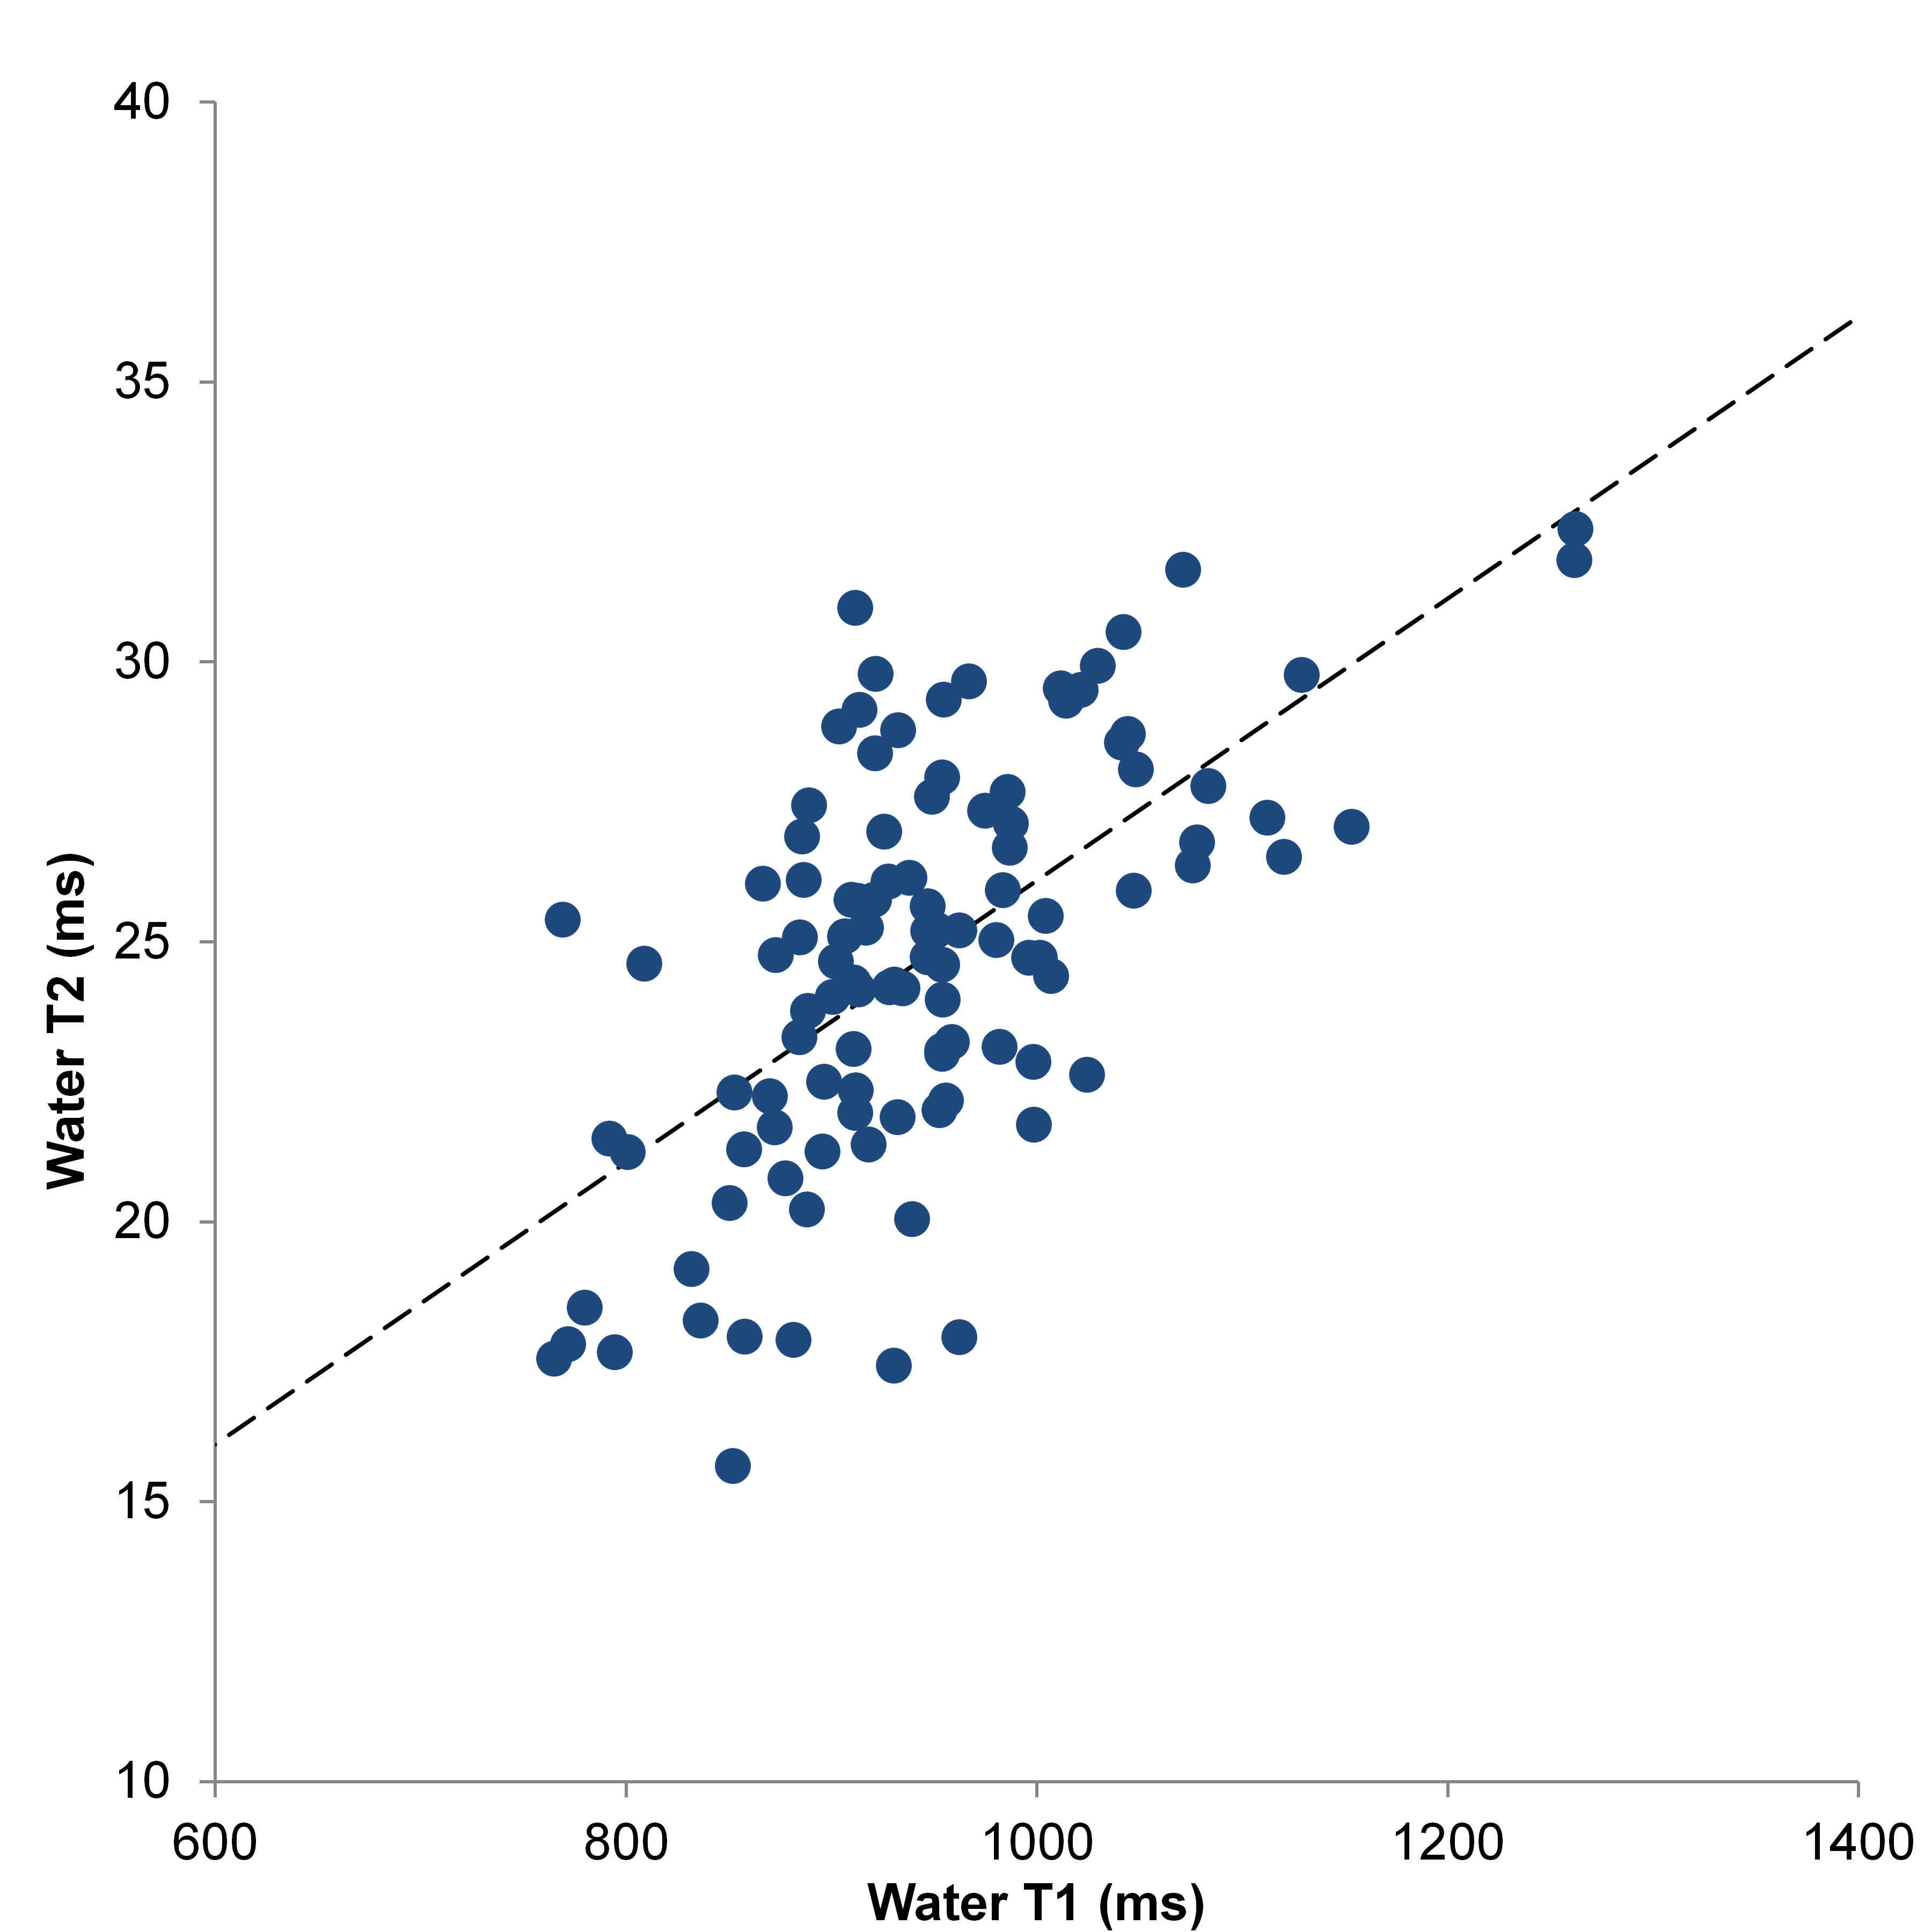
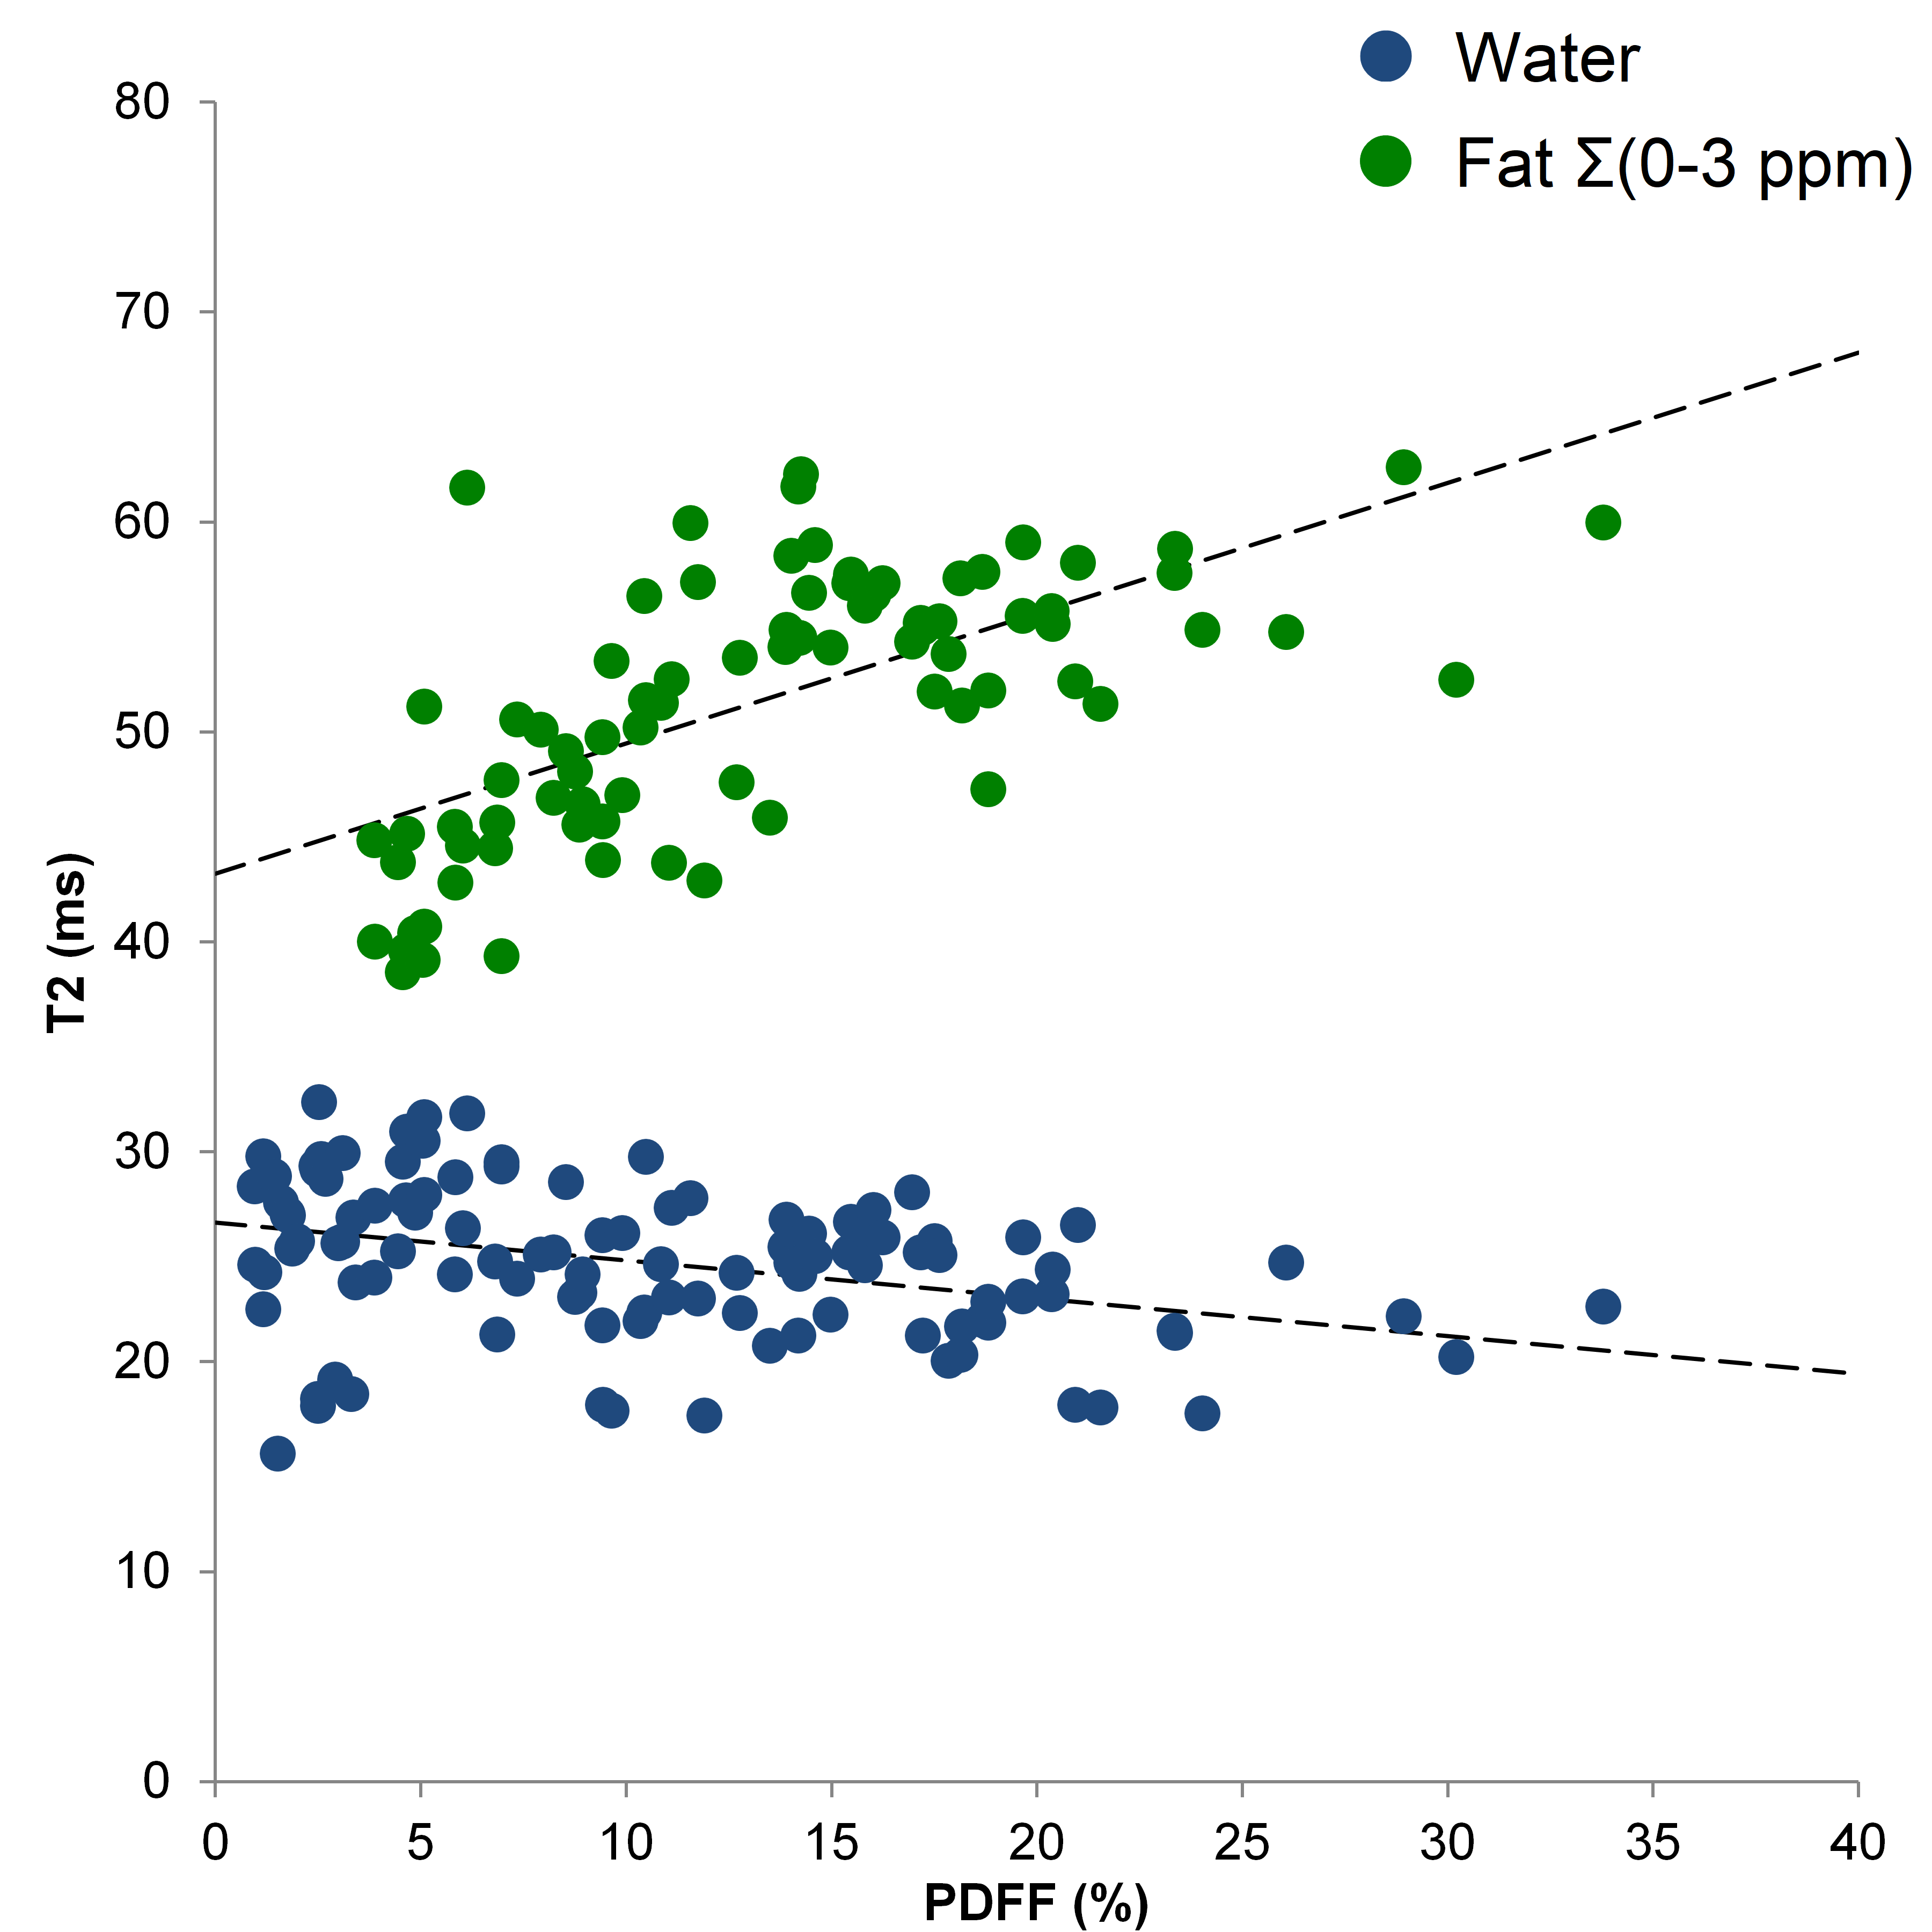
Water and fat signal peak areas and a modeled fit for a typical FAC MTRTE acquisition are shown in Figure 1. Means and standard deviations of liver water and fat T1 and T2, and PDFF are shown in Table 2. For fat T1 and T2 measurements, only values from subjects with PDFF > 4% (n = 80) were used. The strongest correlations were between water T2 and T1 (Figure 2; slope 0.025, intercept 0.92 ms, r = 0.627, p < 0.001) and fat T2 and PDFF (Figure 3; slope 0.62 ms/%PDFF, intercept 43.2 ms, r = 0.654, p < 0.001). Weaker correlations were between water T2 and PDFF (Figure 3; slope -0.180 ms/%PDFF, intercept 26.6 ms, r = -0.372, p < 0.001) and water and fat T1 (slope 0.148, intercept 221 ms, r = 0.363, p < 0.001). No significant correlations were seen for other comparisons (p > 0.05).Discussion
The correlation between water and fat T1 is weaker than observed previously (1), probably because B1 bias effects are minimized or avoided by the new sequence. However, correlations for water and fat T2 are stronger than observed previously, probably because variability introduced by flip angle error is reduced. The correlation between water T2 and PDFF may be, in part, a feature of the pathology of the liver, though why water and fat T2 show differing behaviors with increasing PDFF is not currently fully understood and requires further study.Acknowledgements
No acknowledgement found.References
- Hamilton G, Middleton MS, Schlein AN et al. Proceedings 23rd ISMRM, Toronto, Canada, 2015
- Hamilton G, Middleton MS, Hooker JC et al J Magn Reson Imaging 2015; 42: 1538-1543
- Hamilton G, Schlein AN, Loomba R, Sirlin CB. Proceedings 26th ISMRM, Paris, France, 2018
- Bydder M, Hamilton G, Yokoo T, Sirlin CB. Magn Reson Imaging 2008;26:847-850
- Vanhamme L, van den Boogaart A, Van Huffel S. J Magn Reson 1997;129:35-43
- Naressi A, Couturier C, Devos JM, et al. MAGMA 2001;12:141-152
- Hamilton G, Yokoo T, Bydder M, et al. NMR Biomed. 2011;24:784-790.
Figures