1762
MRI Relaxometry in a Rat Model of Nonalcoholic Steatohepatitis (NASH)1Athinoula A. Martinos Center for Biomedical Imaging, Institute for Innovation in Imaging (i3), Department of Radiology, Massachusetts General Hospital and Harvard Medical School, Charlestown, MA, United States, 2Division of Surgical Oncology, Massachusetts General Hospital and Harvard Medical School, Boston, MA, United States
Synopsis
Nonalcoholic steatohepatitis (NASH), characterized by the presence of steatosis, inflammation
Introduction
Nonalcoholic steatohepatitis (NASH), characterized by the presence of steatosis, inflammation and fibrosis, is the main cause of chronic liver disease in the Western world, owing to its close association with obesity, diabetes, and the metabolic syndrome. Diagnosis, prognosis, surveillance, and treatment decisions in patients with NASH rely on a precise estimation of the degree of fibrosis. While liver biopsy is the gold standard for assessment of fibrosis, it is invasive, costly and has potential complications. Recently, multiparametric MR without intravenous contrast agents has been proposed for the non-invasive diagnosis of liver disease [1,2]. Particularly, longitudinal relaxation time (T1) measurement with iron content correction has been used to stage liver fibrosis. However, NASH is also associated with a significant increase in hepatic fat, which may complicate T1 measurement for staging fibrosis. Here, we aim to evaluate T1 mapping for monitoring disease progression and treatment response in a choline-deficient high-fat diet rat model of NASH.Methods
Animal model: Male Wistar rats were fed a choline-deficient, L-amino acid-defined, high-fat diet consisting of 60 kcal% fat and 0.1% methionine by weight (CDAHFD) for 2, 6 or 9 weeks (N = 8 per time point) to induce NASH. Age- and weight-matched animals receiving normal chow were used as controls (N = 16). There were also two treatment groups: animals received 6 weeks of CDAHFD and subsequently underwent either (1) 3 weeks of daily oral gavage of elafibranor (30 mg/kg), a dual peroxisome proliferator-activated receptor (PPAR-α/δ) agonist, while continuing on CDAHFD (N=8); or (2) switch to normal diet for 3 weeks (N=8). MRI Relaxometry: Animals were anesthetized with isoflurane (1%-2%) and imaged at a 1.5T Siemens clinical MRI scanner. Respiratory-gated, three-dimensional inversion recovery images (inversion times = 50, 100, 200, 250, 300, 400, 1000 and 1500 ms) were acquired for T1 mapping. Image analysis: Longitudinal relaxation time (T1) was quantified from a three-parameter nonlinear least squares fit of the dependence of liver signal intensity (S) on inversion time (TI) with a custom written MATLAB program. ROI analysis of liver tissue was performed on the longitudinal relaxivity (R1=1/T1) maps. Ex-vivo tissue analyses: After MRI, the livers were collected, fixed, and stained with H&E for histologic morphometric quantitation of hepatic steatosis, expressed as the percentage of lipid vacuolization (%LV) using imageJ. Another portion of liver was assayed for hydroxyproline (Hyp) content. Differences among groups were tested with one-way ANOVA followed by Tukey’s post hoc test. Correlation between in vivo MR measurements and ex vivo tissue quantification was assessed by Spearman's rank correlation coefficient.
Results
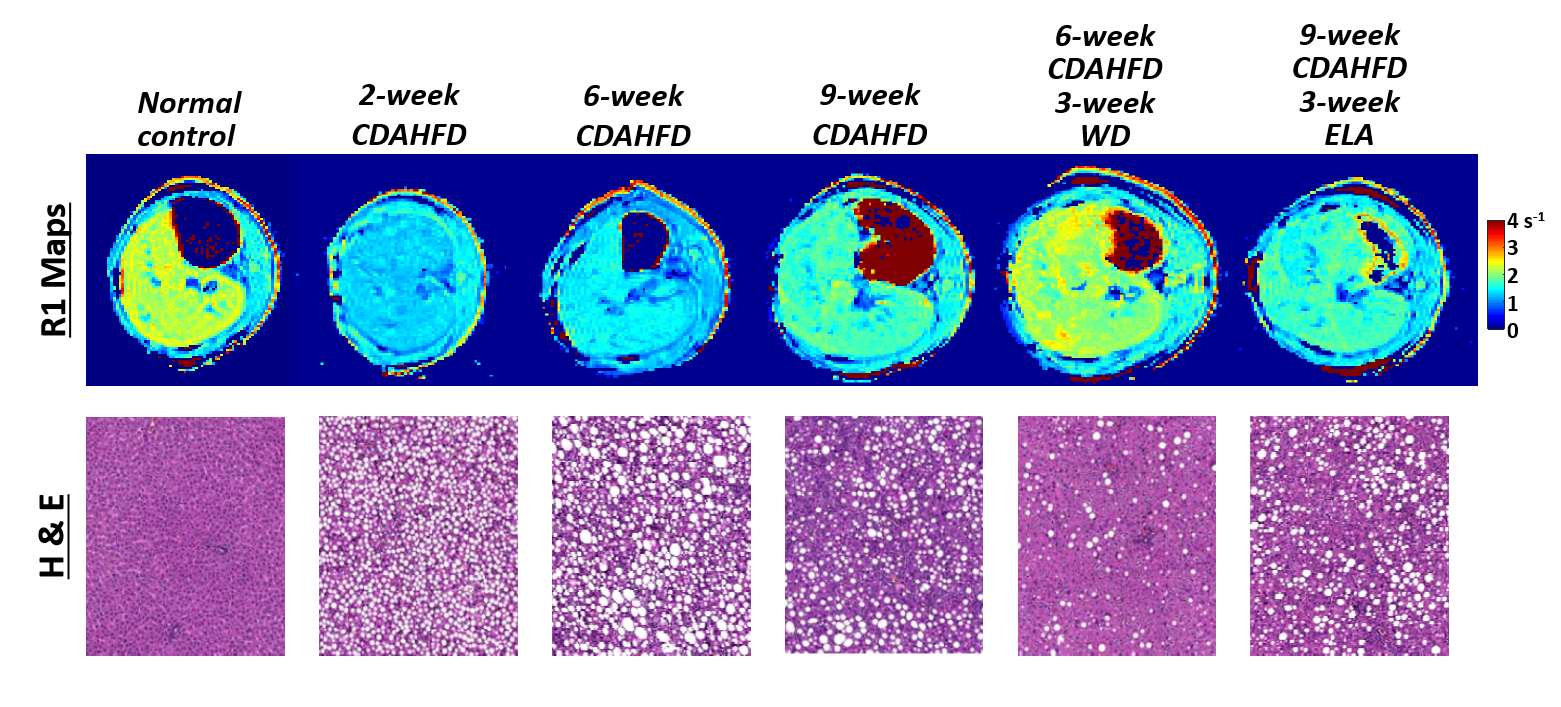
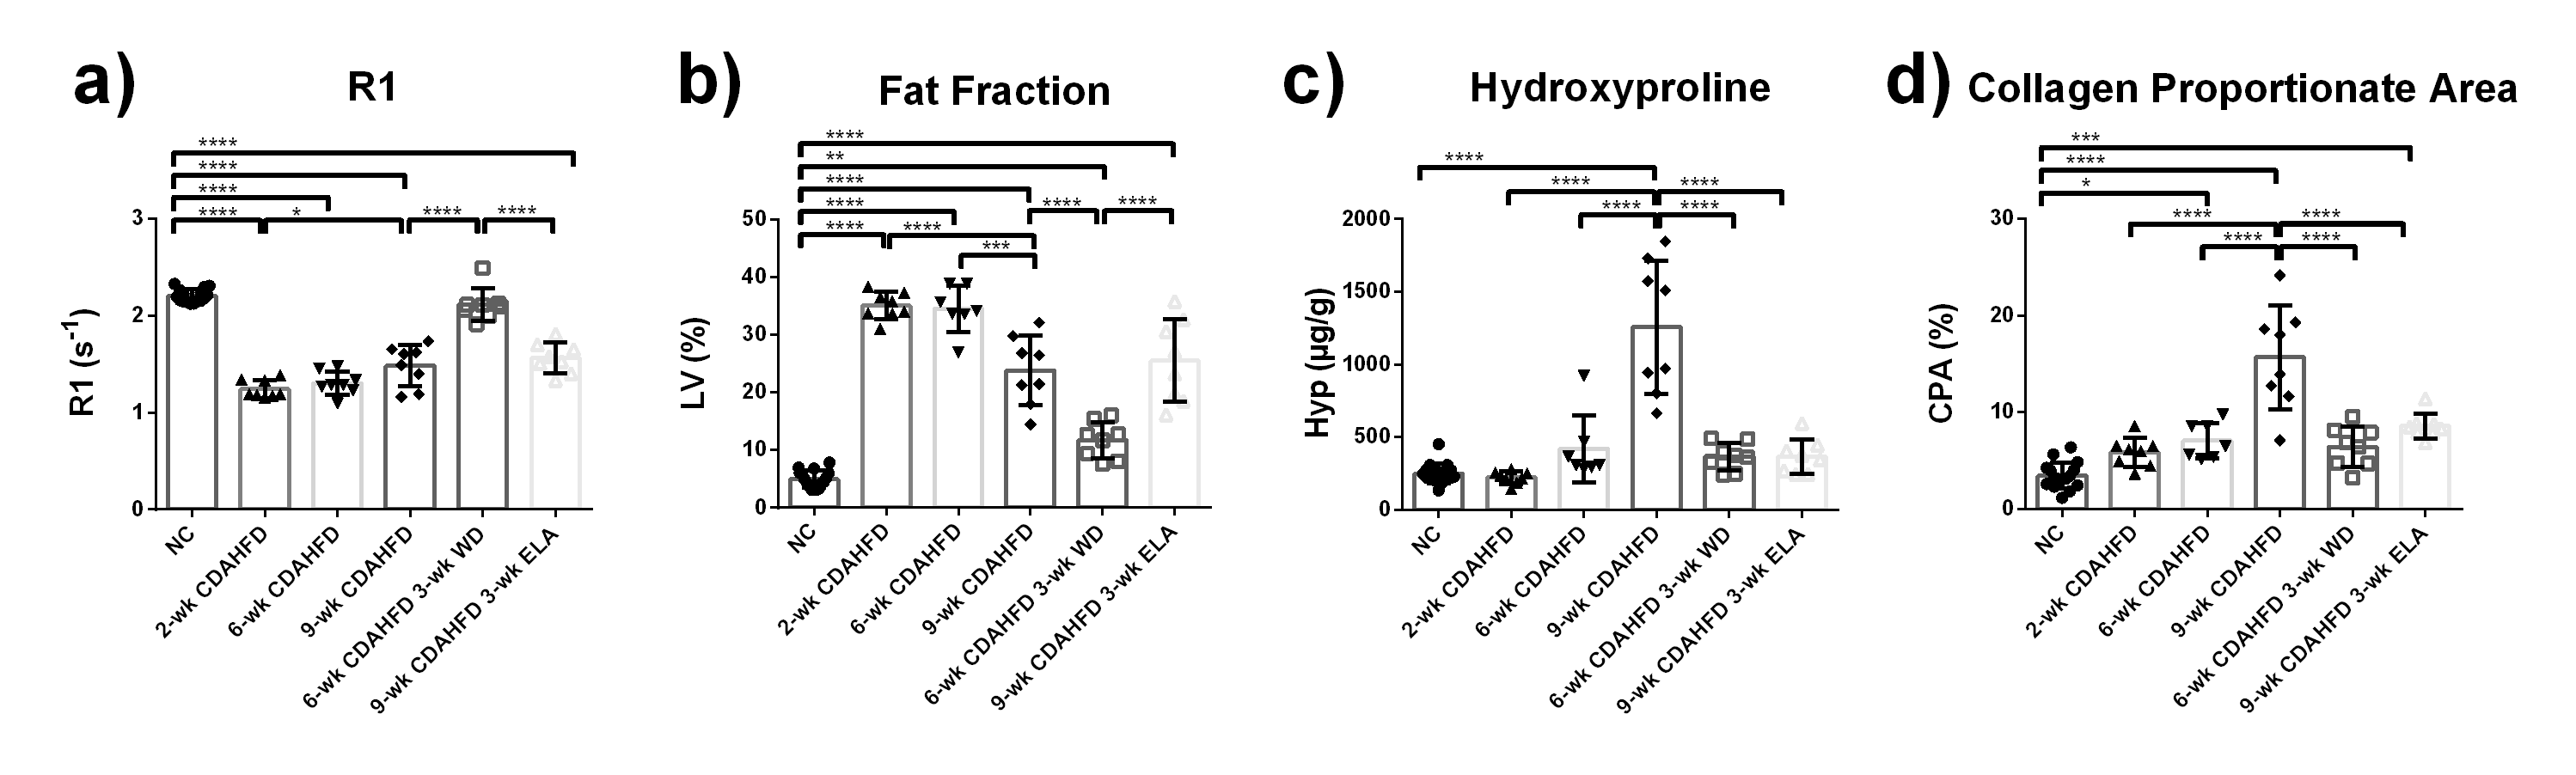
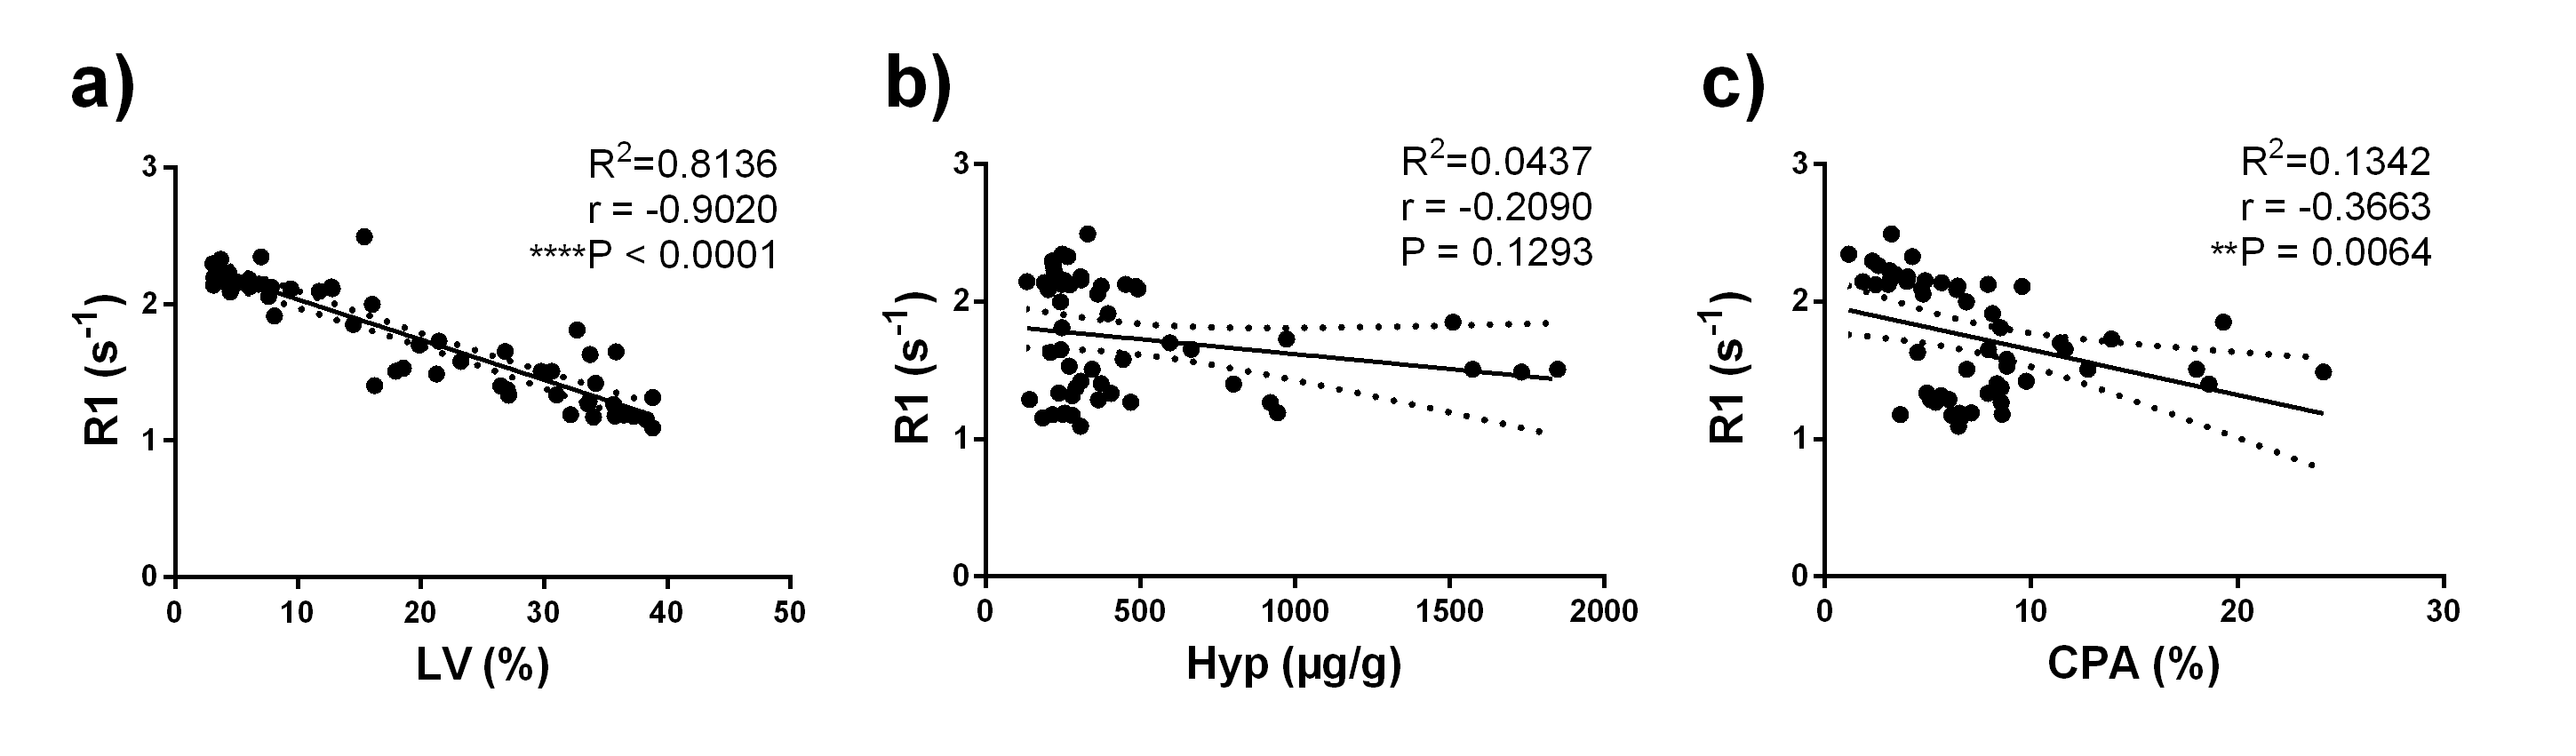
Representative R1 images and corresponding H&E staining are shown in Fig. 1. Compared to normal controls, significantly smaller R1 was found in the rats on CDAHFD at all time points, indicating T1 lengthening as a result of disease (Fig. 2a and 2b). CDAHFD also resulted in large amounts of steatosis as evidenced by the white lipid droplets on the H&E images. Fibrosis increased with longer time on CDAHFD as indicated by increasing Hyp levels (Fig. 2c) and increased CPA values (Fig. 2d). Both the elafibranor group and the diet switch group showed significantly decreased Hyp and CPA values compared to the 9-week CDAHFD animals. However, both R1 and %LV measurements in the elafibranor group remained similar as in 9-week CDAHFD group. Fig. 3 shows a very strong and significant inverse correlation of R1 with %LV (r=-0.90). CPA (r=-0.37) weakly correlated with R1, but Hyp (r=-0.21) did not.Discussion and Conclusion
Using an inversion recovery gradient echo sequence for T1 mapping, this study has shown that the presence of fat influences R1 measurements in the liver, in addition to the previously known effects of T2, magnetization transfer and iron concentration. Recently Mozes et al. used Bloch simulations to show that fat fractions up to 40% will have an additive effect on the measured T1 value at 3T using a bSSFP readout, where the different T1 of fat and water and their opposing phases lead to an apparent lengthening of the T1 recovery in the combined signal [3]. On the other hand, increased T1 has been shown to correlate with liver inflammation score [4]. However, we also found elevated T1 and fat fraction in the rats treated with elafibranor, which has been shown to reduce inflammation in NASH patients [5]. Therefore, the influence of fat should be considered in the assessment of hepatic diseases using T1 measurements, as clinically relevant range of hepatic fat content can mask or exaggerate changes in T1 due to disease and treatment response.Acknowledgements
No acknowledgement found.References
[1] Banerjee R, et al. J. Hepatol. 2014;60:69-77.
[2] Pavlides M, et al. J. Hepatol. 2016;64:308-15.
[3] Mozes FE, et al. J. Magn. Reson. Imaging 2016;44:105-11.
[4] Hoad CL, et al. NMR Biomed. 2015;28:706-14.
[5] Ratziu V, et al. Gastroenterology 2016;150:1147-59 e5.
Figures