1760
IRON MEASUREMENTS BY QUANTITATIVE MRI-R2* AT 3.0 AND 1.5 T IN COMPARISON TO SQUID BIOMAGNETIC LIVER SUSCEPTOMETRY (BLS)Jin Yamamura1, Björn Schönnagel1, Sarah Keller2, Christoph Berliner1, Enver Tahir1, Regine Grosse3, Zhiyue Jerry Wang4, Gerhard Adam1, and Roland Fischer1,5
1Diagnostic and Interventional Radiology, University Medical Center Hamburg-Eppendorf, Hamburg, Germany, 2Radiology, Charité University Medicine, Berlin, Germany, 3Haemato-Oncology, University Medical Center Hamburg, Hamburg, Germany, 4University of Texas Southwestern Medical Center, Dallas, TX, United States, 5UCSF Benioff Children's Hospital Oakland, Oakland, CA, United States
Synopsis
In this study the suitability of a 3.0 T imager for iron measurements over the whole range of possible iron concentrations in the liver and other organs or glands is investigated. For this purpose the results on liver iron is compared for the feasibility of 3.0T to both 1.5T MRI and SQUID BLS.
PURPOSE
The assessment of iron overload in transfusion dependent patients was studied by the new generation of 3 T imagers. From physical principles, a ratio of 2:1 could be expectedbetween the transverse relaxation rates (R2*) at 3.0 and 1.5 Tesla and confirmed for liver and heart in former publications (1,2). We are investigating the suitability of a 3.0 T imager for iron measurements over the whole range of possible iron concentrations in the liver and other organs or glands. Here, we report our results on liver iron comparing the feasibility of 3.0T to both 1.5T MRI and SQUID BLS.MATERIAL AND METHODS
Patients with transfusional siderosis (transfusion dependent thalassemia), hereditary hemochromatosis, DBA, and normal subjects(n=249, age: 7-79 y) underwent a gradient recalled multi-echo (GRE) sequence (R2*). For assessment of transverse relaxation rates R2*, 2D single slice (n = 5-7, 8 mm data acquisition was performed at 1.5 T (Symphony®/Avanto®, Siemens AG, Erlangen, Germany) using a breath-hold GRE sequence (TR = 500 ms, 12 bipolar echoes with TE = 1.3-25.7 ms, t = 1.16 ms, flip angle = 20°, bandwidth 1955 Hz/pixel). At 3.0 T (Ingenia®, Philips AG, Eindhoven, Netherlands), a breath-hold 3D multi-slice (n = 20, 8 mm, oversampling 1.5) data acquisition was used (TR = 24.3 ms, TE = 1.2-23.05 ms, t = 20 · 1.15 ms, flip angle = 3°, bandwidth 1425 Hz/pixel). In patients with suspected severe liver iron burden (LIC > 2000 µg/gliver), an additional 3D sequence with shorter echo times was used (TE = 0.65-16.93 ms, t = 20 · 0.86 ms). In vivo liver iron concentration (LIC, dry-weight conversion factor = 6) was determined from the specific hemosiderin/ferritin magnetic susceptibility as noninvasively measured by SQUID (superconducting quantum interference device) biomagnetic liver susceptometry (BLS), see illustrated Fig. 1. For calibration, R2* was determined from a mono-exponential fit with constant signal level offset to the echo-time dependent signal amplitudes (magnitude) averaged over a right hemispherical liver area corresponding to the magnetic flux sensitivity volume of the BLS sensor assembly. For clinical purpose, signal amplitudes are averaged over the whole liver slice excluding large blood and bile vessels.RESULTS
In patients, liver iron ranged from LIC = 130 to9700 µg/gliver. In the controls, LIC was measured between 176 and 377 µg/gliver (normal range: 100-480 µg/g). At 1.5 and 3.0 T, liver R2* rates ranged from 31 to 2236 s-1 and from 41 to 2344 s-1, respectively. R2* rates were fitted to LIC (BLS) by a Hill type logistic function (R2* = a0+a1/(1+(a2/LIC)1.5), see Fig. 2 and Fig. 3. LIC(R2*) can be calculated from the resulting inverse equations LIC(1.5T) = 42.1·(R2*-21)2/3and LIC(3T) = 25.98·(R2*-21)2/3. From a direct comparison between R2* rates at 3.0 T and 1.5 T (n=9), a non-linear relationship was found between R2*(3T) and R2*(1.5T) due to the higher relaxivity at 3 Tesla. Below R2*(1.5T) < 600 s-1 a linear relationship with a ratio of R2*(3.0)/R2*(1.5T) = 1.85±0.04 could be obtained in contrast to expected ratio of 2:1. These findings agree with similar findings from other reports (1,2). In order to overcome the saturation effect of the 3T relaxivity for severe liver iron overloadone has to put constraints on the signal amplitude. This can be done by a shorter 1stecho time (radial k-spacing), an estimate of the signal amplitude from nearby surrogate tissue (subcutaneous thorax fat), or using the signal intensity ratio method (1).CONCLUSION
The non-linear relationship between R2* and LIC might be expected from the R2 contribution especially at lower LIC and the saturation effect at higher LIC. For liver iron measurements in severely overloaded patients with LIC > 3000 µg/gliver or > 18 mg/gdry weight, 1.5 Tesla imagers are better suited than 3.0 Tesla systems unless ultrashort echo times can be used. For R2* rates below that level, 3.0 T systems with 3D data acquisition are more advantageous, especially for other organs and glands (pancreas, kidney, adrenals) due to a better image quality.Acknowledgements
No acknowledgement found.References
1. Storey P, Thompson AA, Carquevile CL, et al. R2* imaging of transfusional iron burden at 3T and comparison with 1.5T. J Magn Reson Imaging 2007;25:540-547.
2. Meloni A, Positano V, Keilberg P. Et al. Feasibility, reproducibility and reliability for the T2* iron evaluation at 3 T in comparison with 1.5 T. Magn Reson Med 2012;68:543-551.
Figures
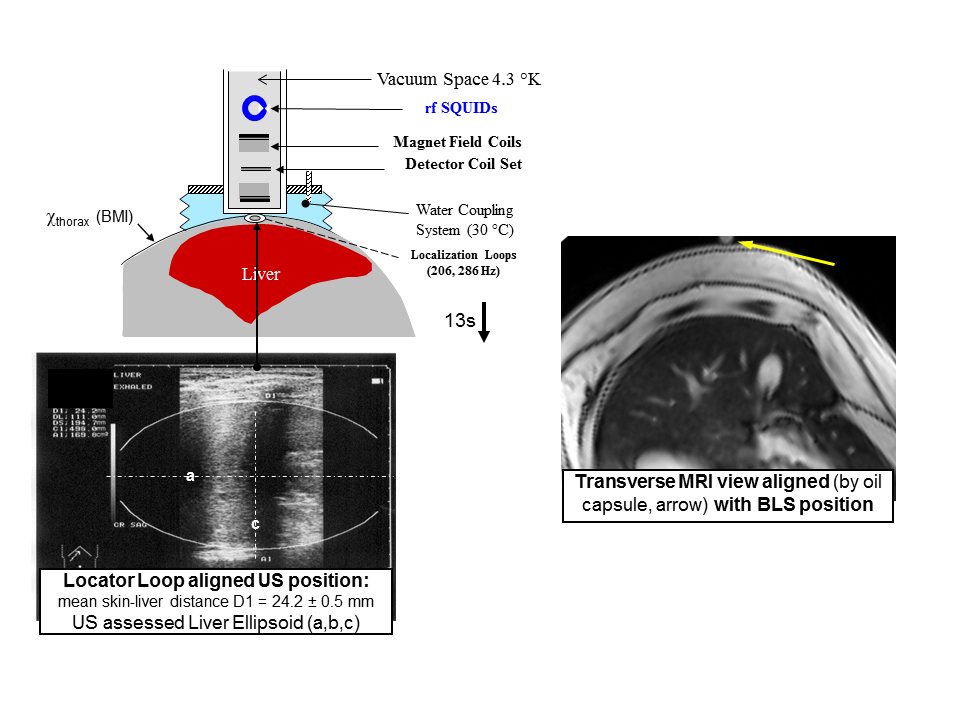
Fig. 1.Schematics of liver iron measurements by SQUID biomagnetometic liver susceptometry (BLS) and MRI. During BLS the subject’s liver position, skin-liver distance, and the anterior liver geometry is determined by sonography (left: US 3.5 GHz linear 10 cm probe). The subject followed by a water coupling system is moved down (13 s, 10 cm) during data acquisition (sampling rate 1 kHz) and this vertical scan is repeated 3 - 5 times. The BLS position was marked by an oil capsule and translated to MRI as indicated by yellow arrow on a rotated transverse MR image (right).
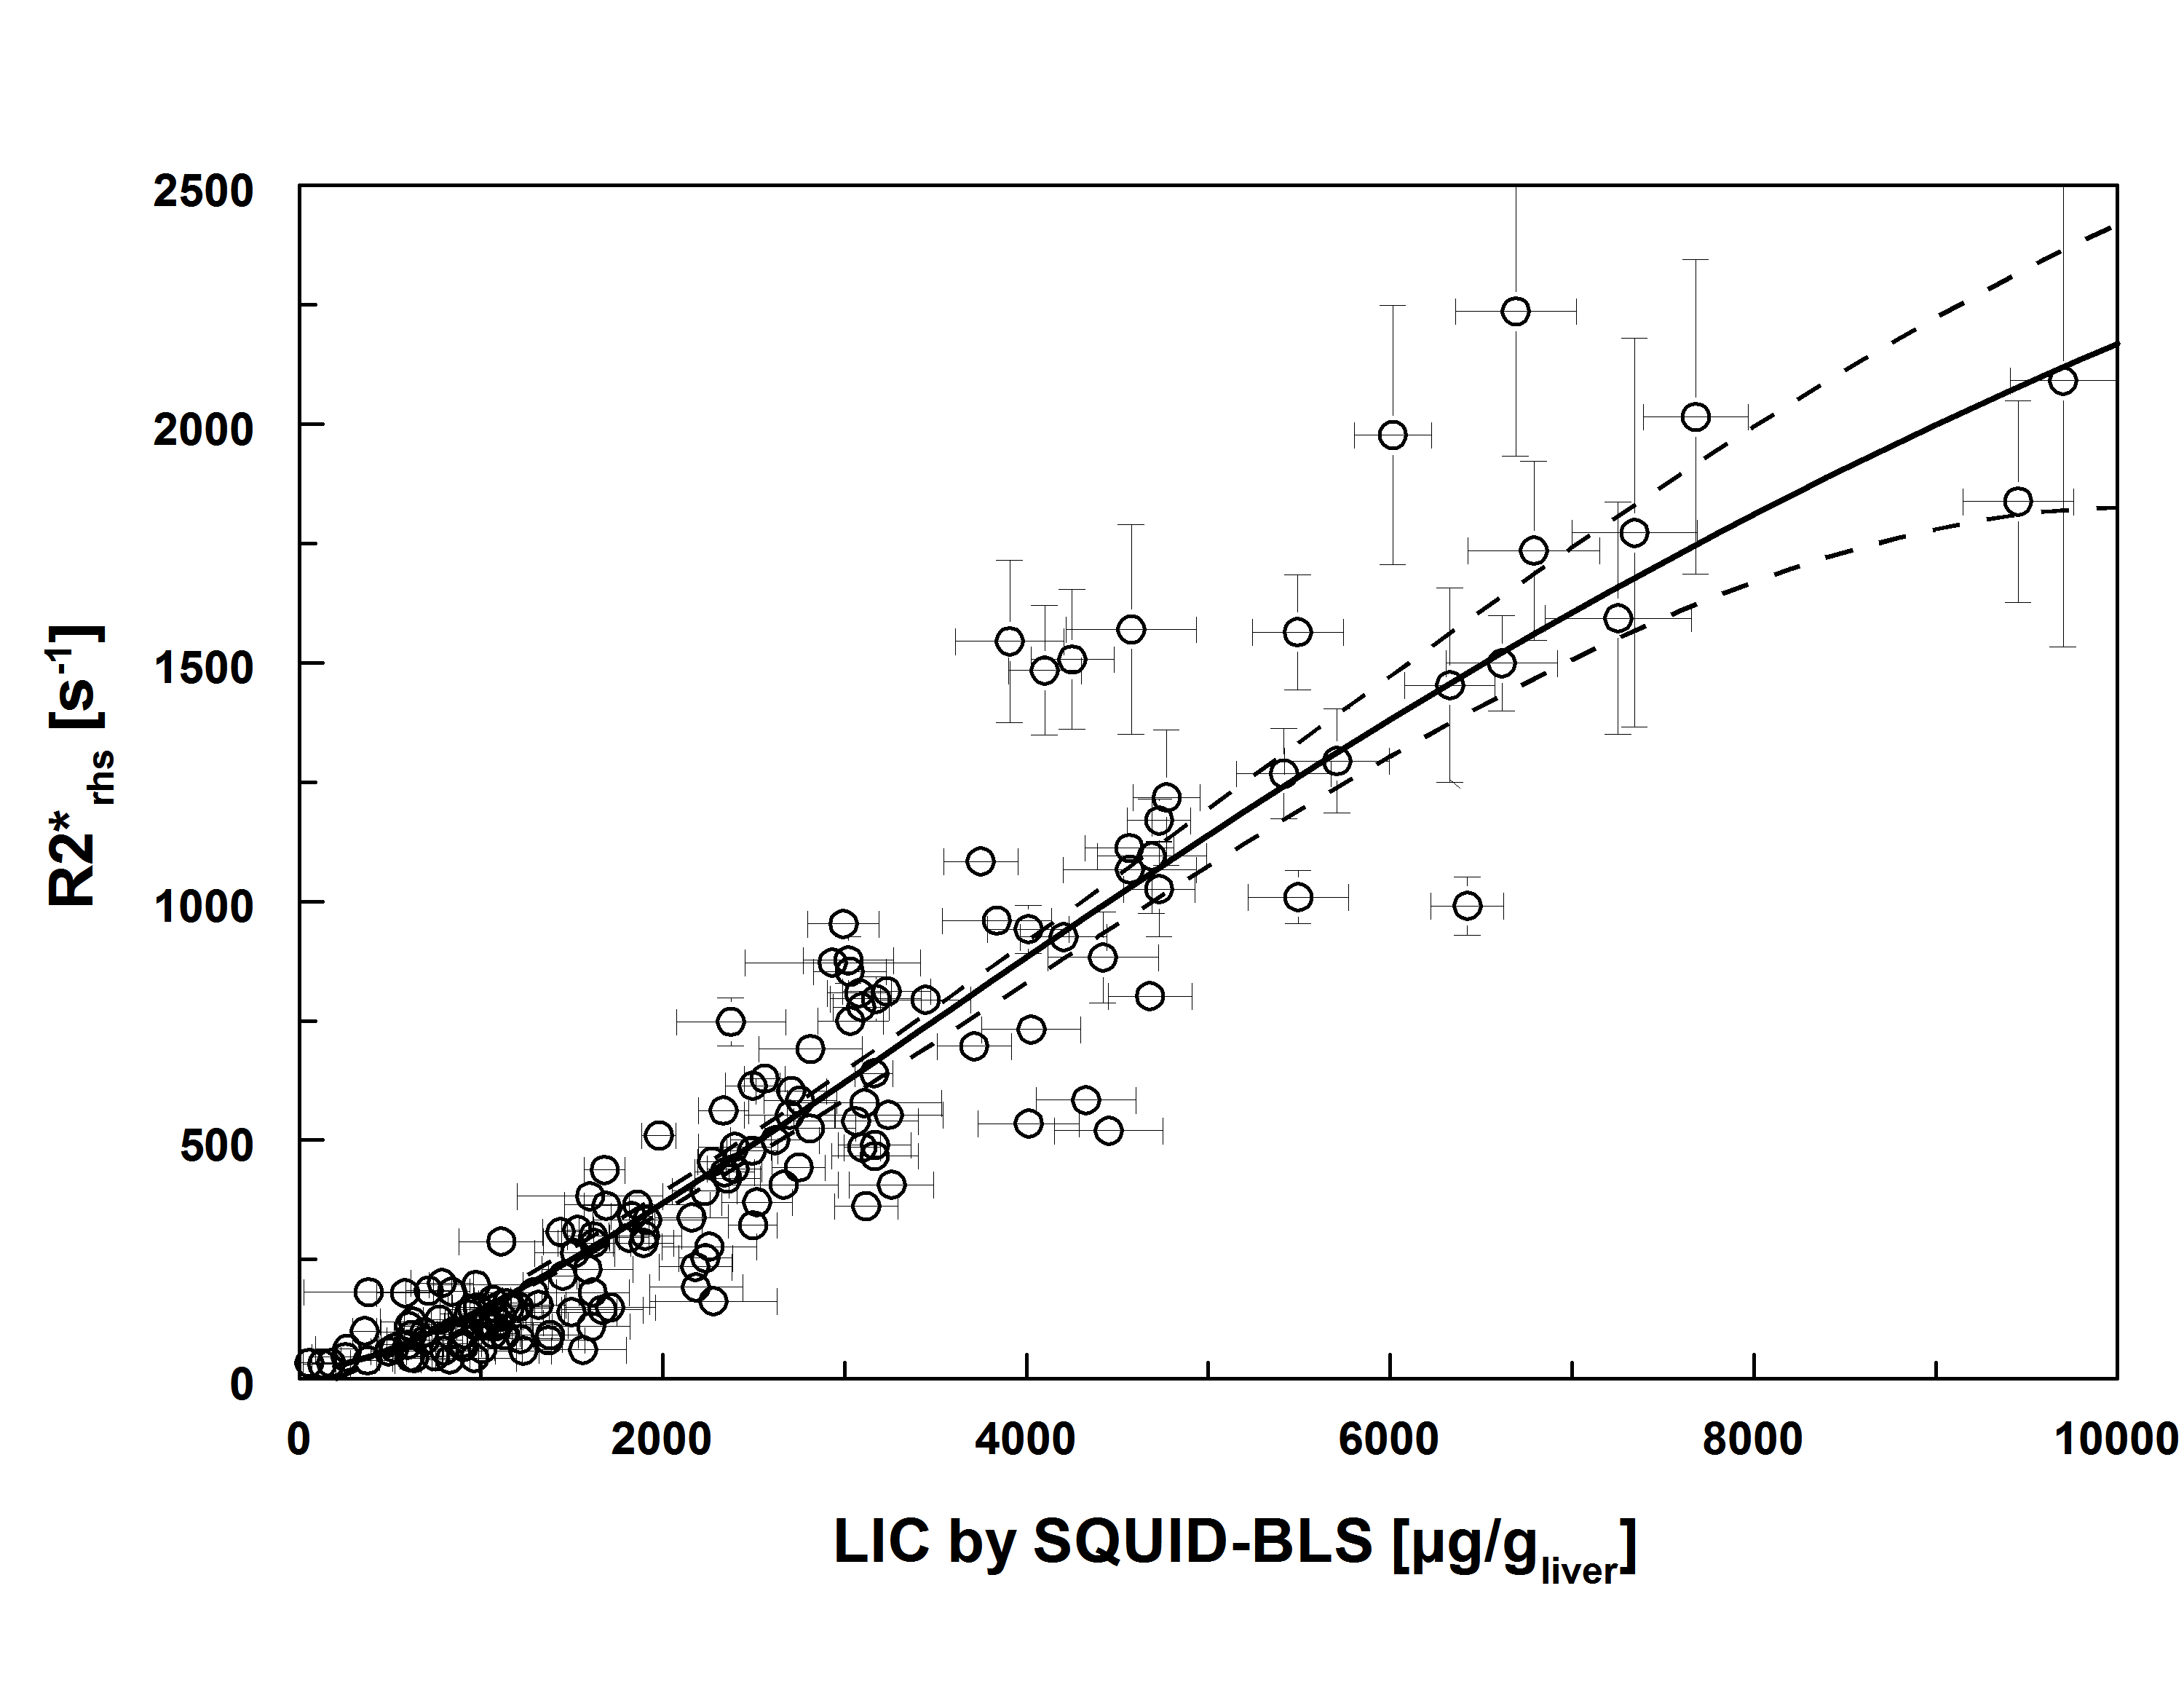
Fig. 2.Liver MRI-R2*rhs(from signal amplitudes of a right hemisphere) at 1.5 T was calibrated by biomagnetic liver susceptometry (BLS) using a logistic function (solid black line: r2= 0.99, dashed lines: 95% prediction range)
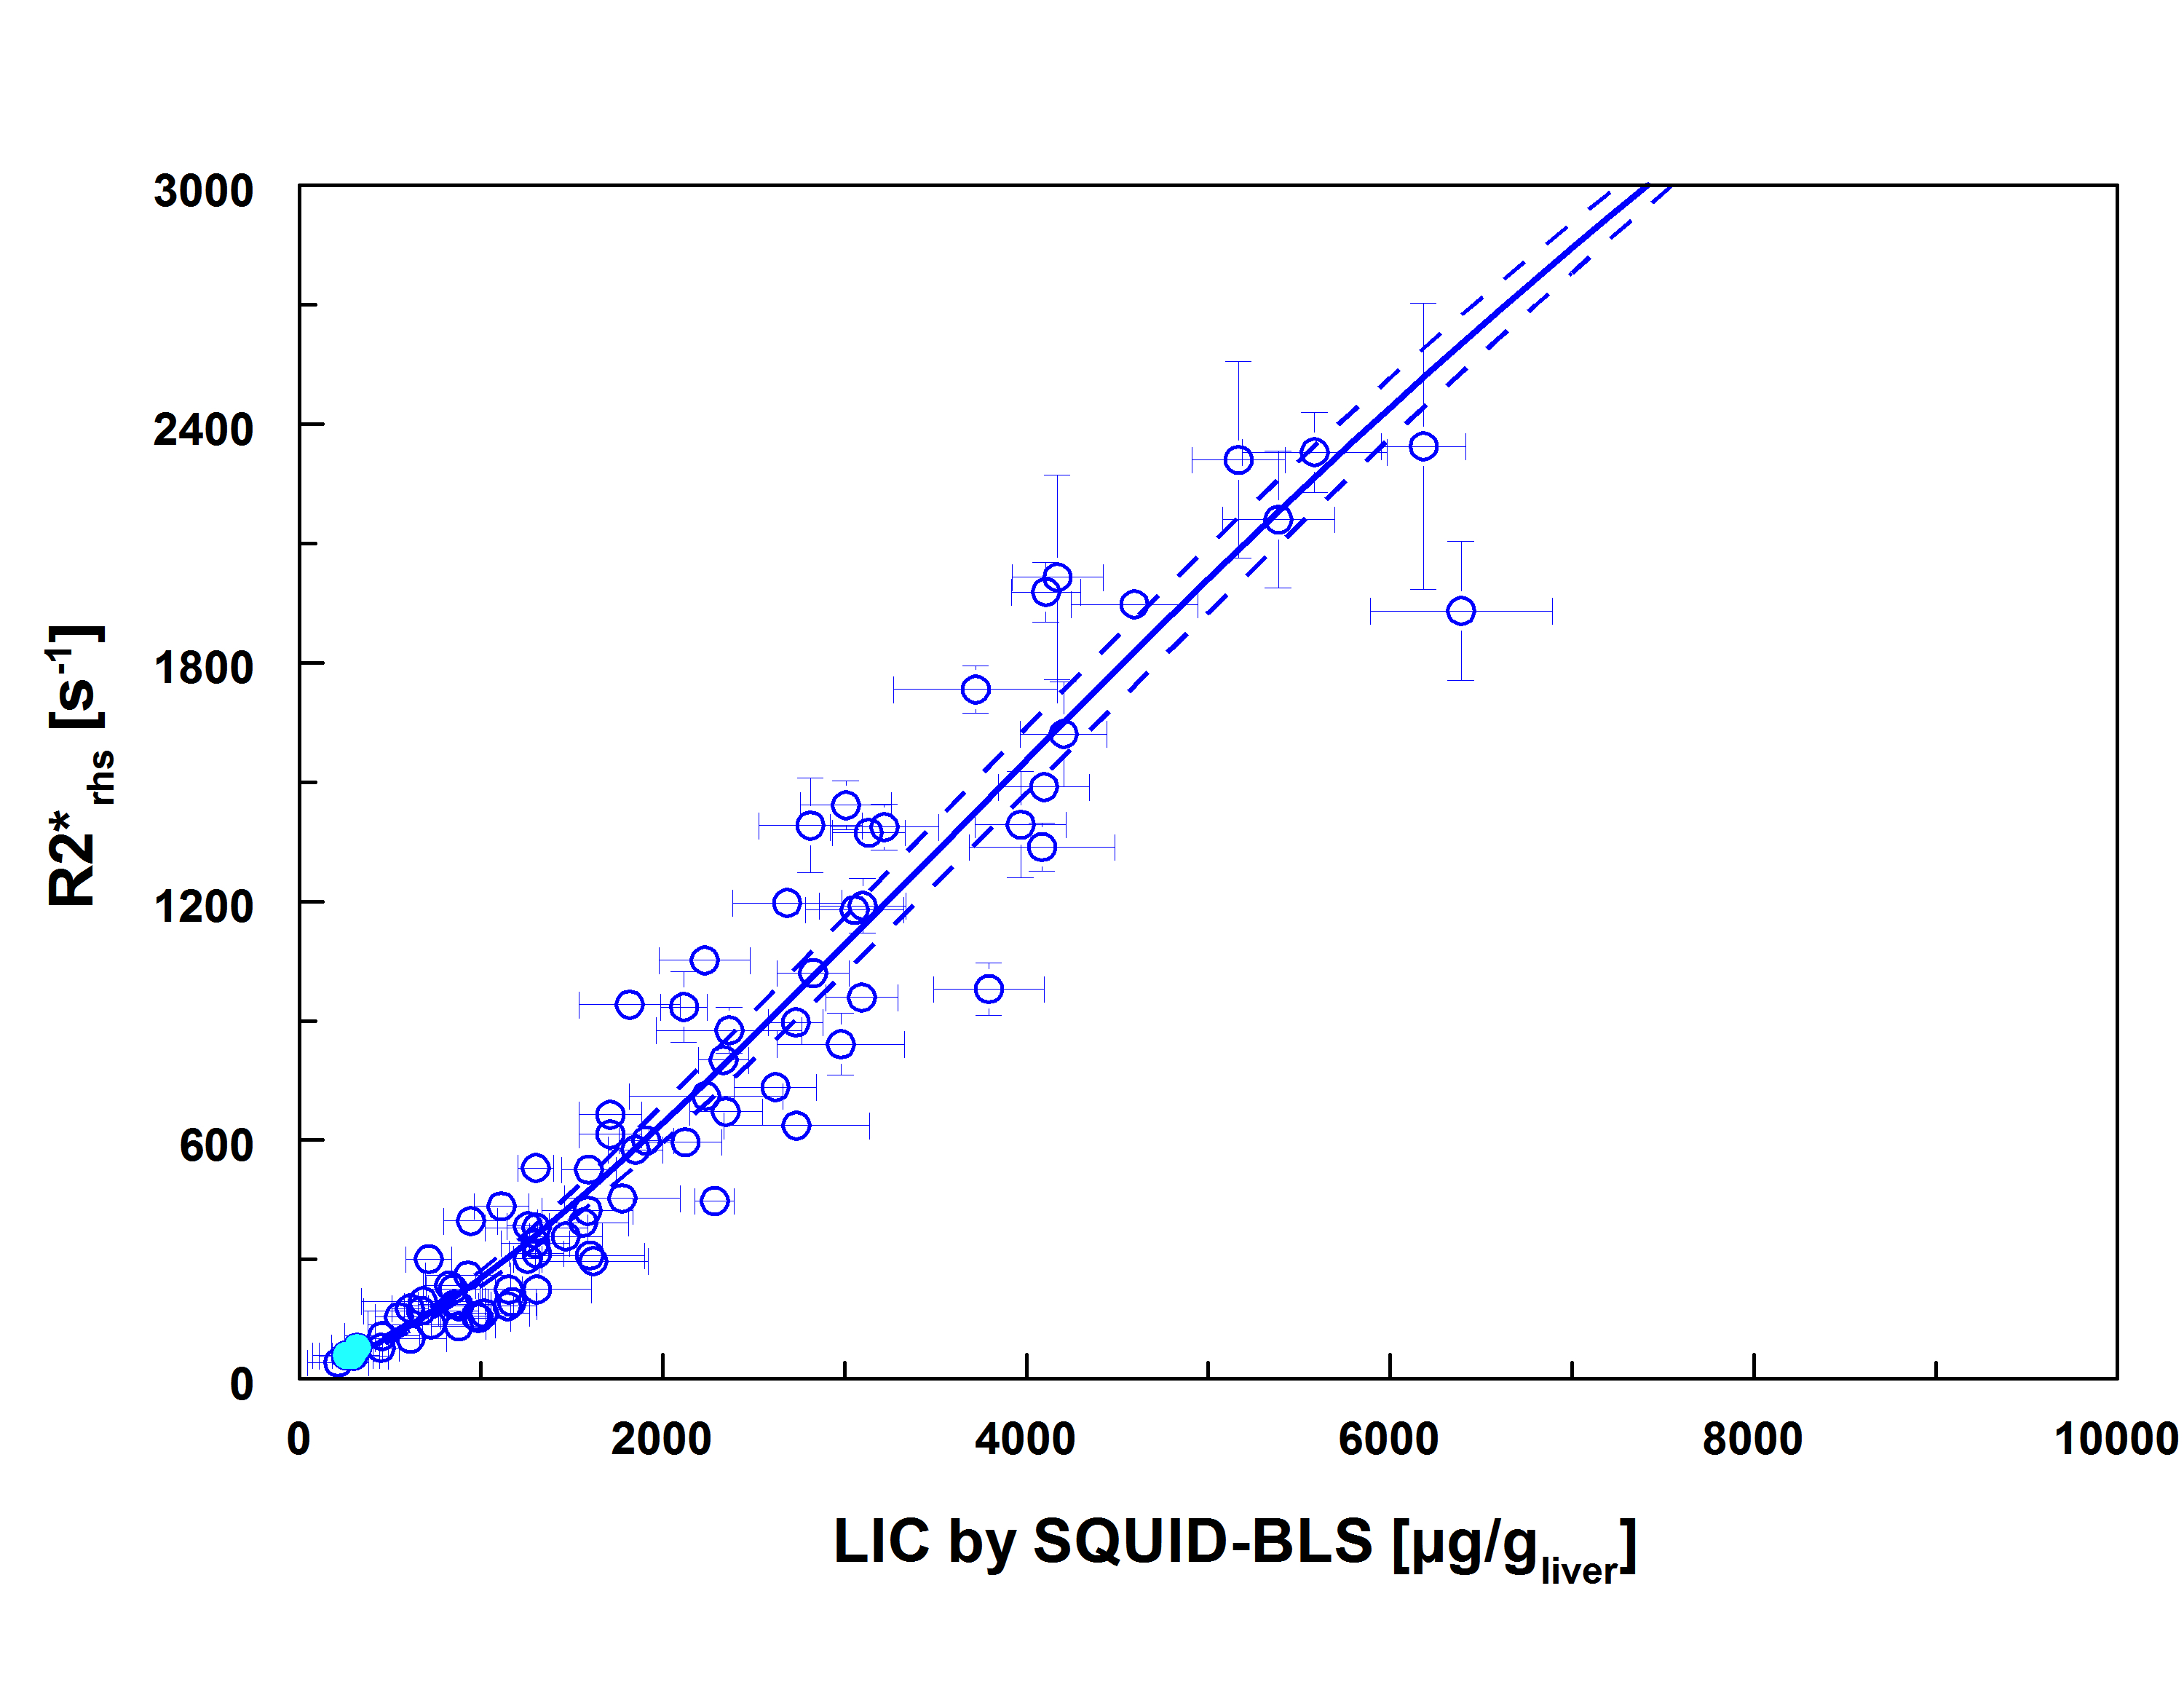
Fig. 3.Liver MRI-R2*rhs(from signal amplitudes of a right hemisphere) at 3.0 T was calibrated by biomagnetic liver susceptometry (BLS) using a logistic function (solid blue line: r2= 0.93, dashed lines: 95% prediction range)