1759
A new calibration between R2* and Liver Iron Concentration derived from 167 clinical cases1Centre for Advanced Imaging, University of Queensland, St Lucia, Qld., Australia, 2School of Health Sciences, University of South Australia, Adelaide, SA, Australia, 3Translational Research Institute, Woolangabba Qld., Australia
Synopsis
The commonly used equation to determine Liver iron concentration (LIC) from R2* was developed from a very small cohort (n=23) and an acquisition approach significantly different to that currently used in clinic. Three subsequent calibrations used progressively larger moderate (n=43-88) to derive divergent results. This study measured liver R2* from 835 gradient echo relaxometry acquisitions in 167 clinical examinations. Correlation between R2* and reference LIC measurement was evaluated for first to third order polynomials. A linear equation provided the best fit, delivering a new calibration equation that differs significantly from earlier work.
Introduction
Gradient echo relaxometry to derive R2* is a popular vehicle for identifying liver iron loading. Acquisition parameters, and methods for quantifying MR signal to fit in models of the transverse signal decay have varied with progressive developments of scanner hardware, but in general employ 8 to 12 tightly spaced gradient echoes. Converting an R2* value to a liver iron concentration relies on empirically developed calibration equations. An early calibration by Wood et al. (1) remains in common use in scientific reports, clinical trial protocols and in commercial software despite being based on only 23 measurements from patients and using a unique TE sampling strategy (TE 0.8-4.8 ms, Δ TE 0.25ms ). In subsequent studies (2-4), only one, employing similar acquisition methods for a larger cohort (n=40) claims agreement with Wood et al. Two further studies offer cohorts up to 80 cases, and suggest different calibration equations. Given the lack of agreement and small sample sizes, we undertook a retrospective reanalysis of the relationship between R2* and LIC with a large collection of MRI data acquired during clinical assessment of iron overload.Method
The study was approved by the Royal Adelaide Hospital (RAH) and University of Queensland research ethics committees. 179 liver iron MR studies using gradient echo relaxometry and SPDA R2-MRI (5) were identified. Two examinations were excluded due to artefacts, and eight were excluded because the original MR images were not available in the patient archive. 169 examinations obtained on 106 individuals were analysed. The reference LIC was determined by SPDA-R2MRI acquisitions analysed in the central laboratory (Resonance Health Pty Ltd, FerriScan ®). Five controlled R2* relaxometry acquisitions were acquired at each examination: Siemens Avanto 1.5T scanner, MAPIT parameter mapping software (Syngo B17). Sequence 12 echo axial FLASH. Flip 20°,TR 200ms TE 0.99-16.5ms, Δ TE 1.41ms, Bandwidth 1950 Hz/pixel. fat suppression, FOV 400 x 200 mm Matrix 128 x 64, slice thickness 10mm. All images were re-evaluated for this study. A ROI covering liver parenchyma, gave the signal level for each of the 60 images per case. The five signal values for each TE contributed to a single curve fitting of a mono-exponential decay with offset (1) to determine R2* using the Levenburg-Marquadt algorithm (Graphpad PRISM 7). Weighted non-linear regression tested the correlation between R2* and LIC for three different models (linear, quadratic and third order), using R2* as the dependant variable. Fits were compared using the extra sum of F test method. The calibration equation was used to calculate LIC from the R2* value (LICR2*) which was compared to the reference value, and values derived using other published calibrations.Results
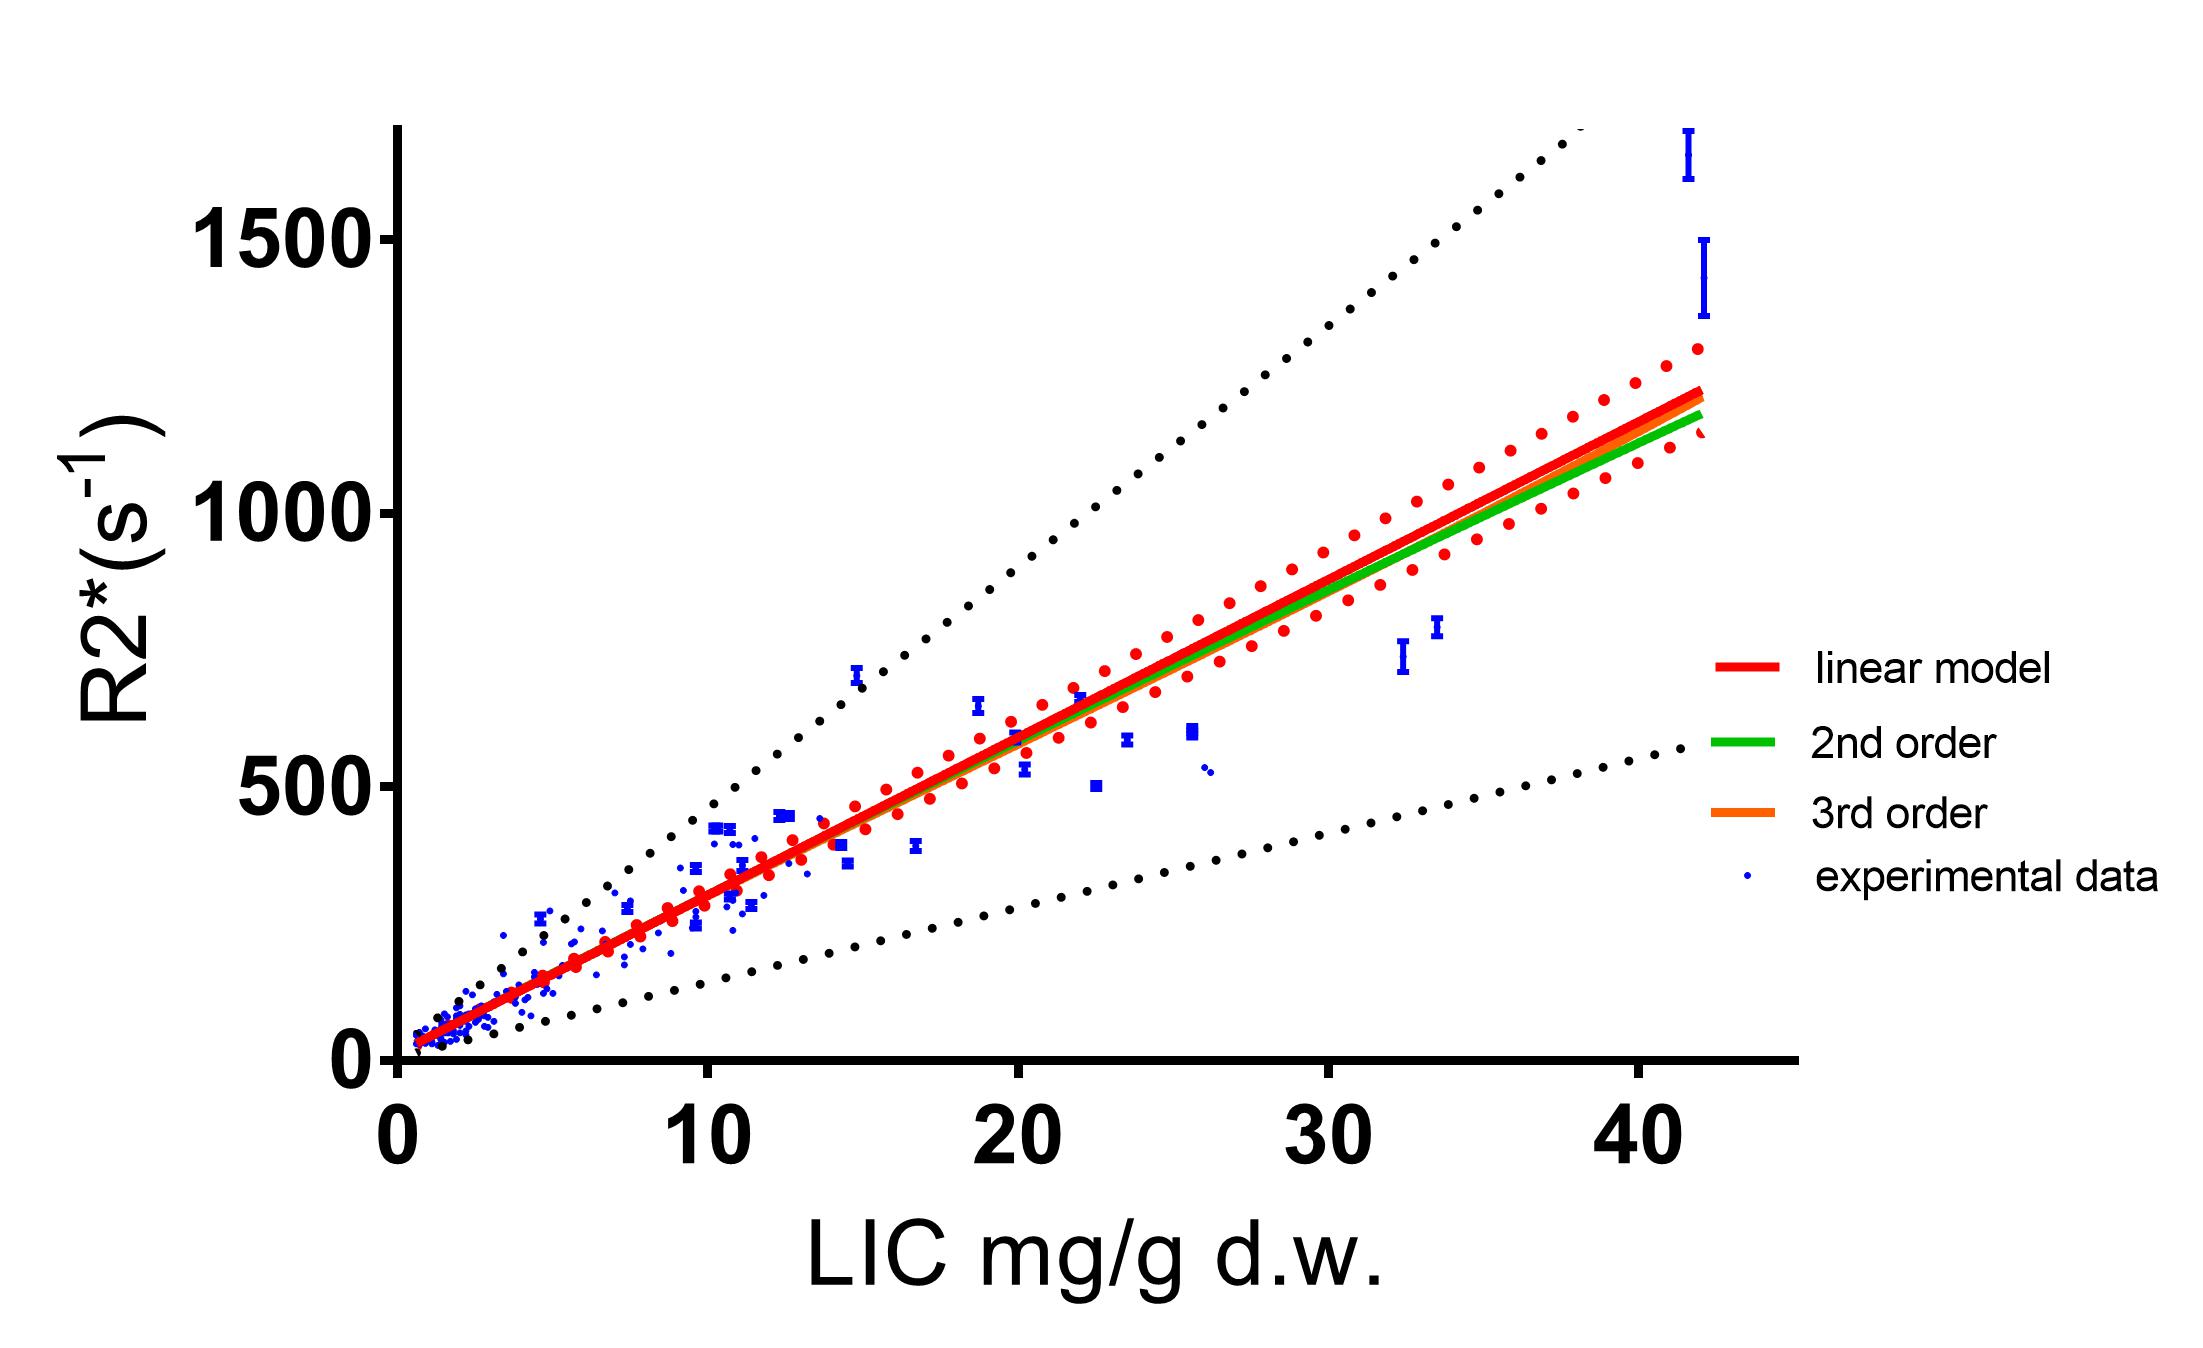
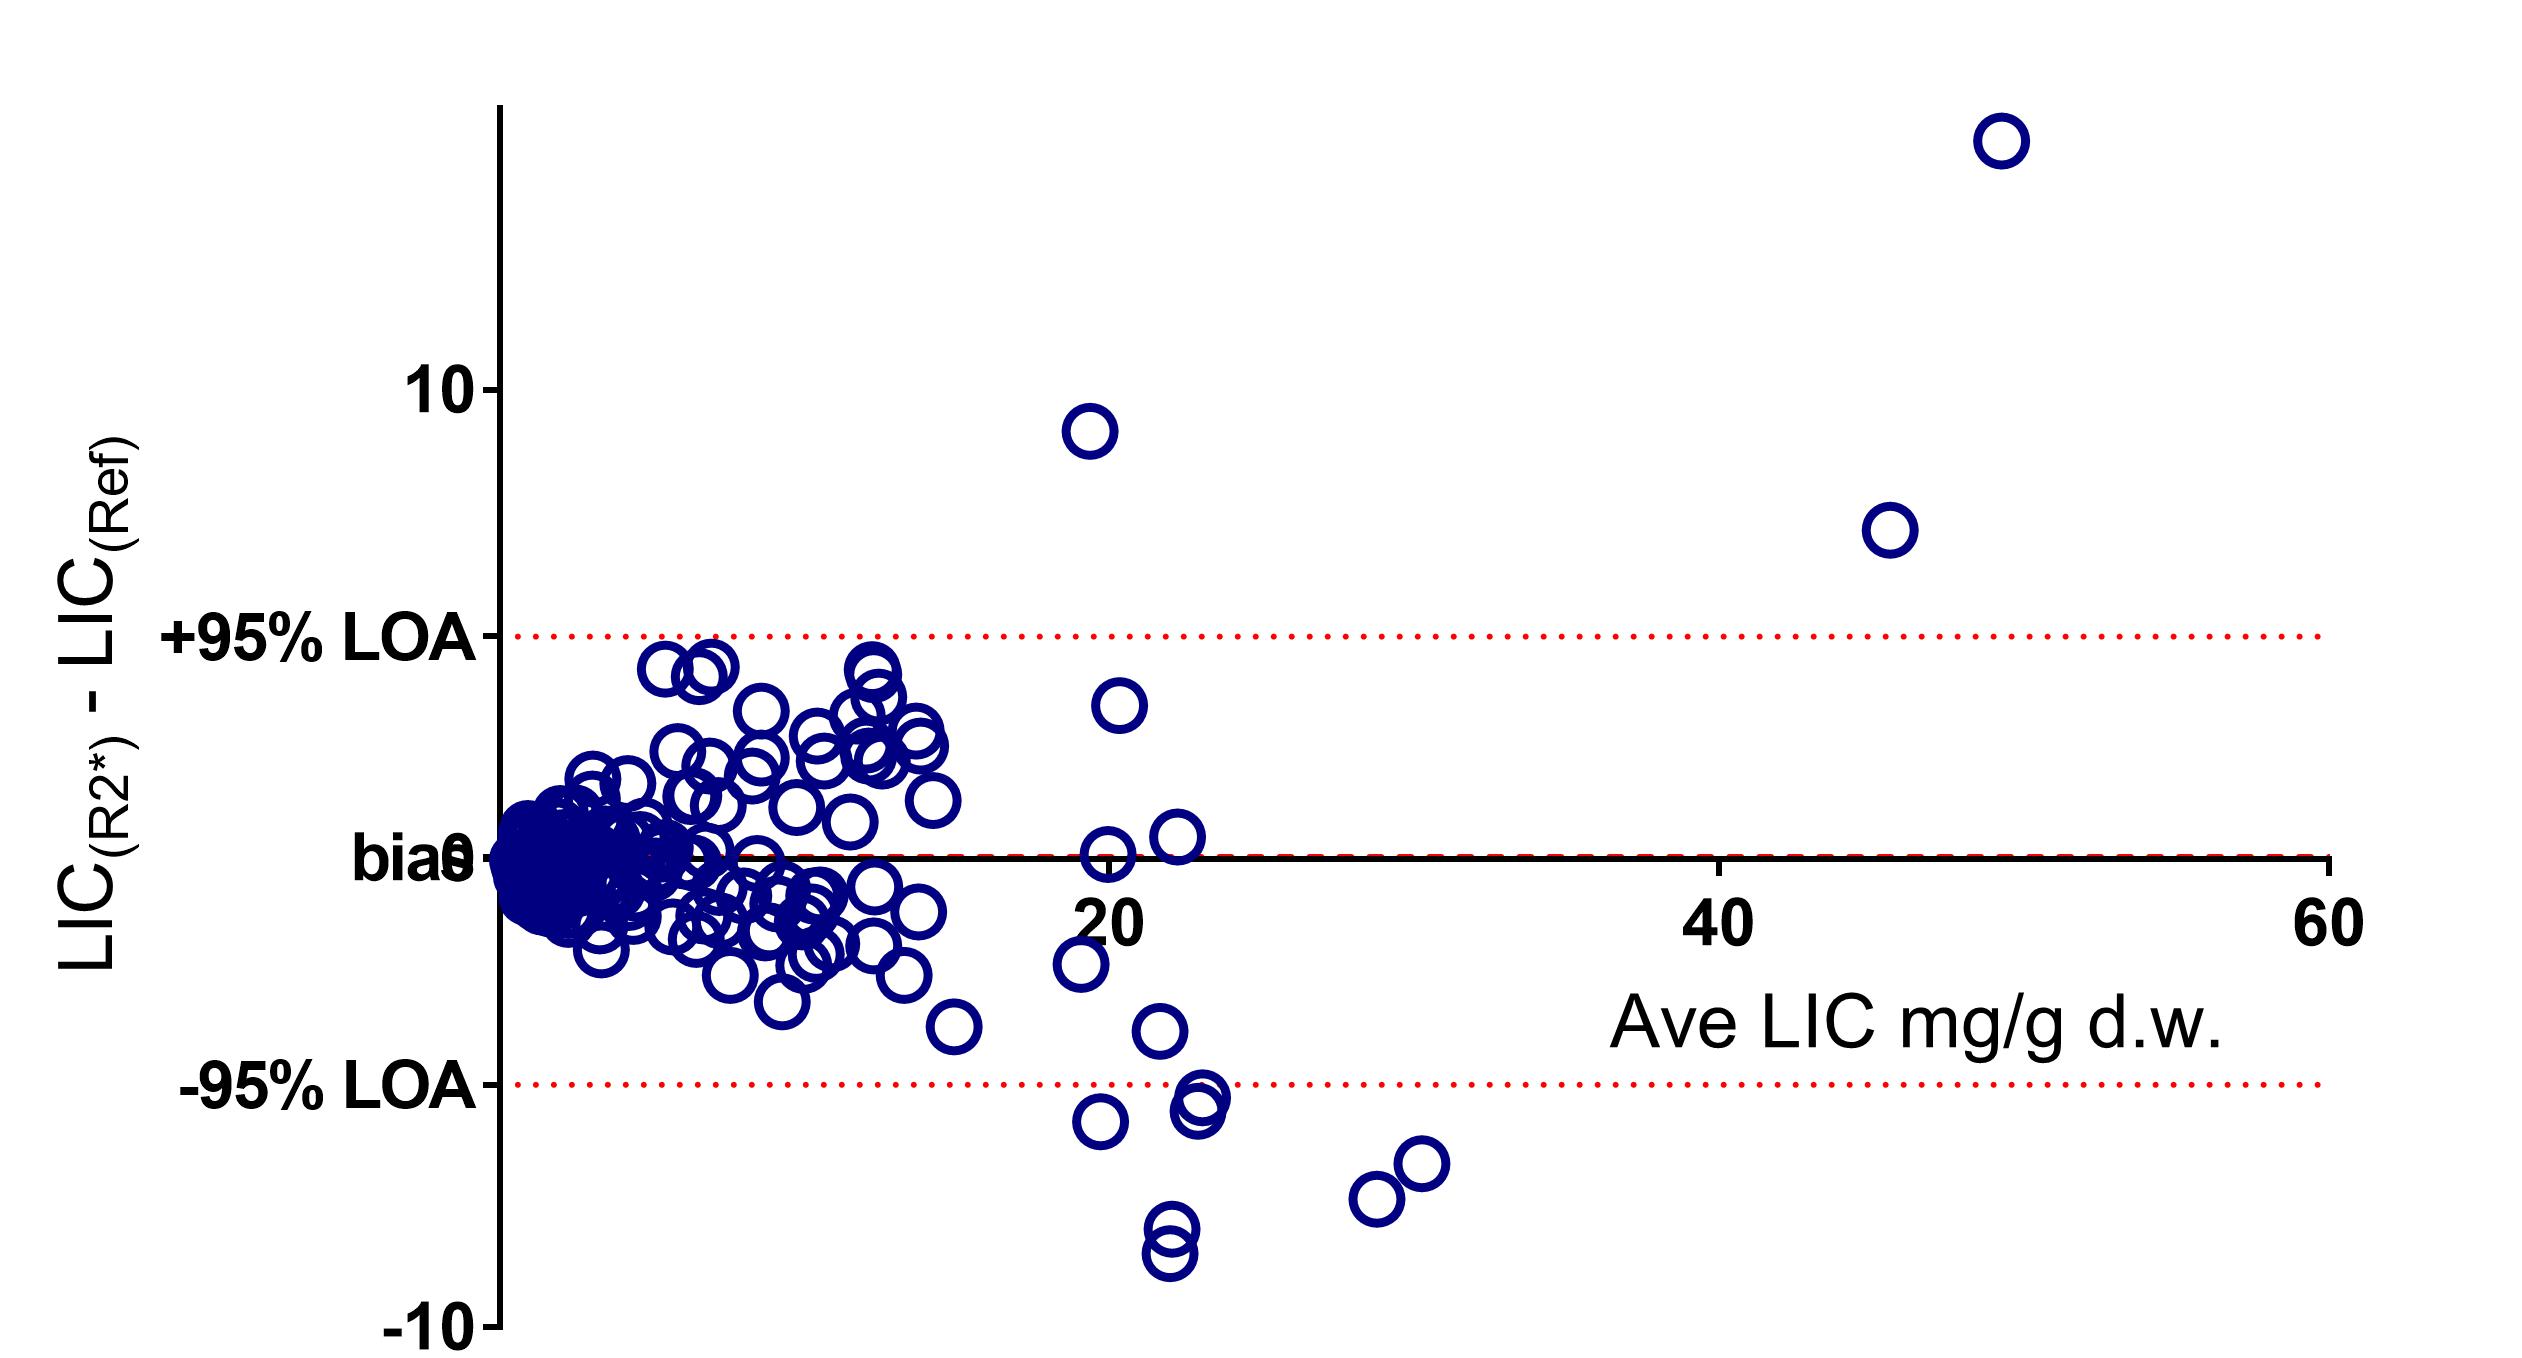
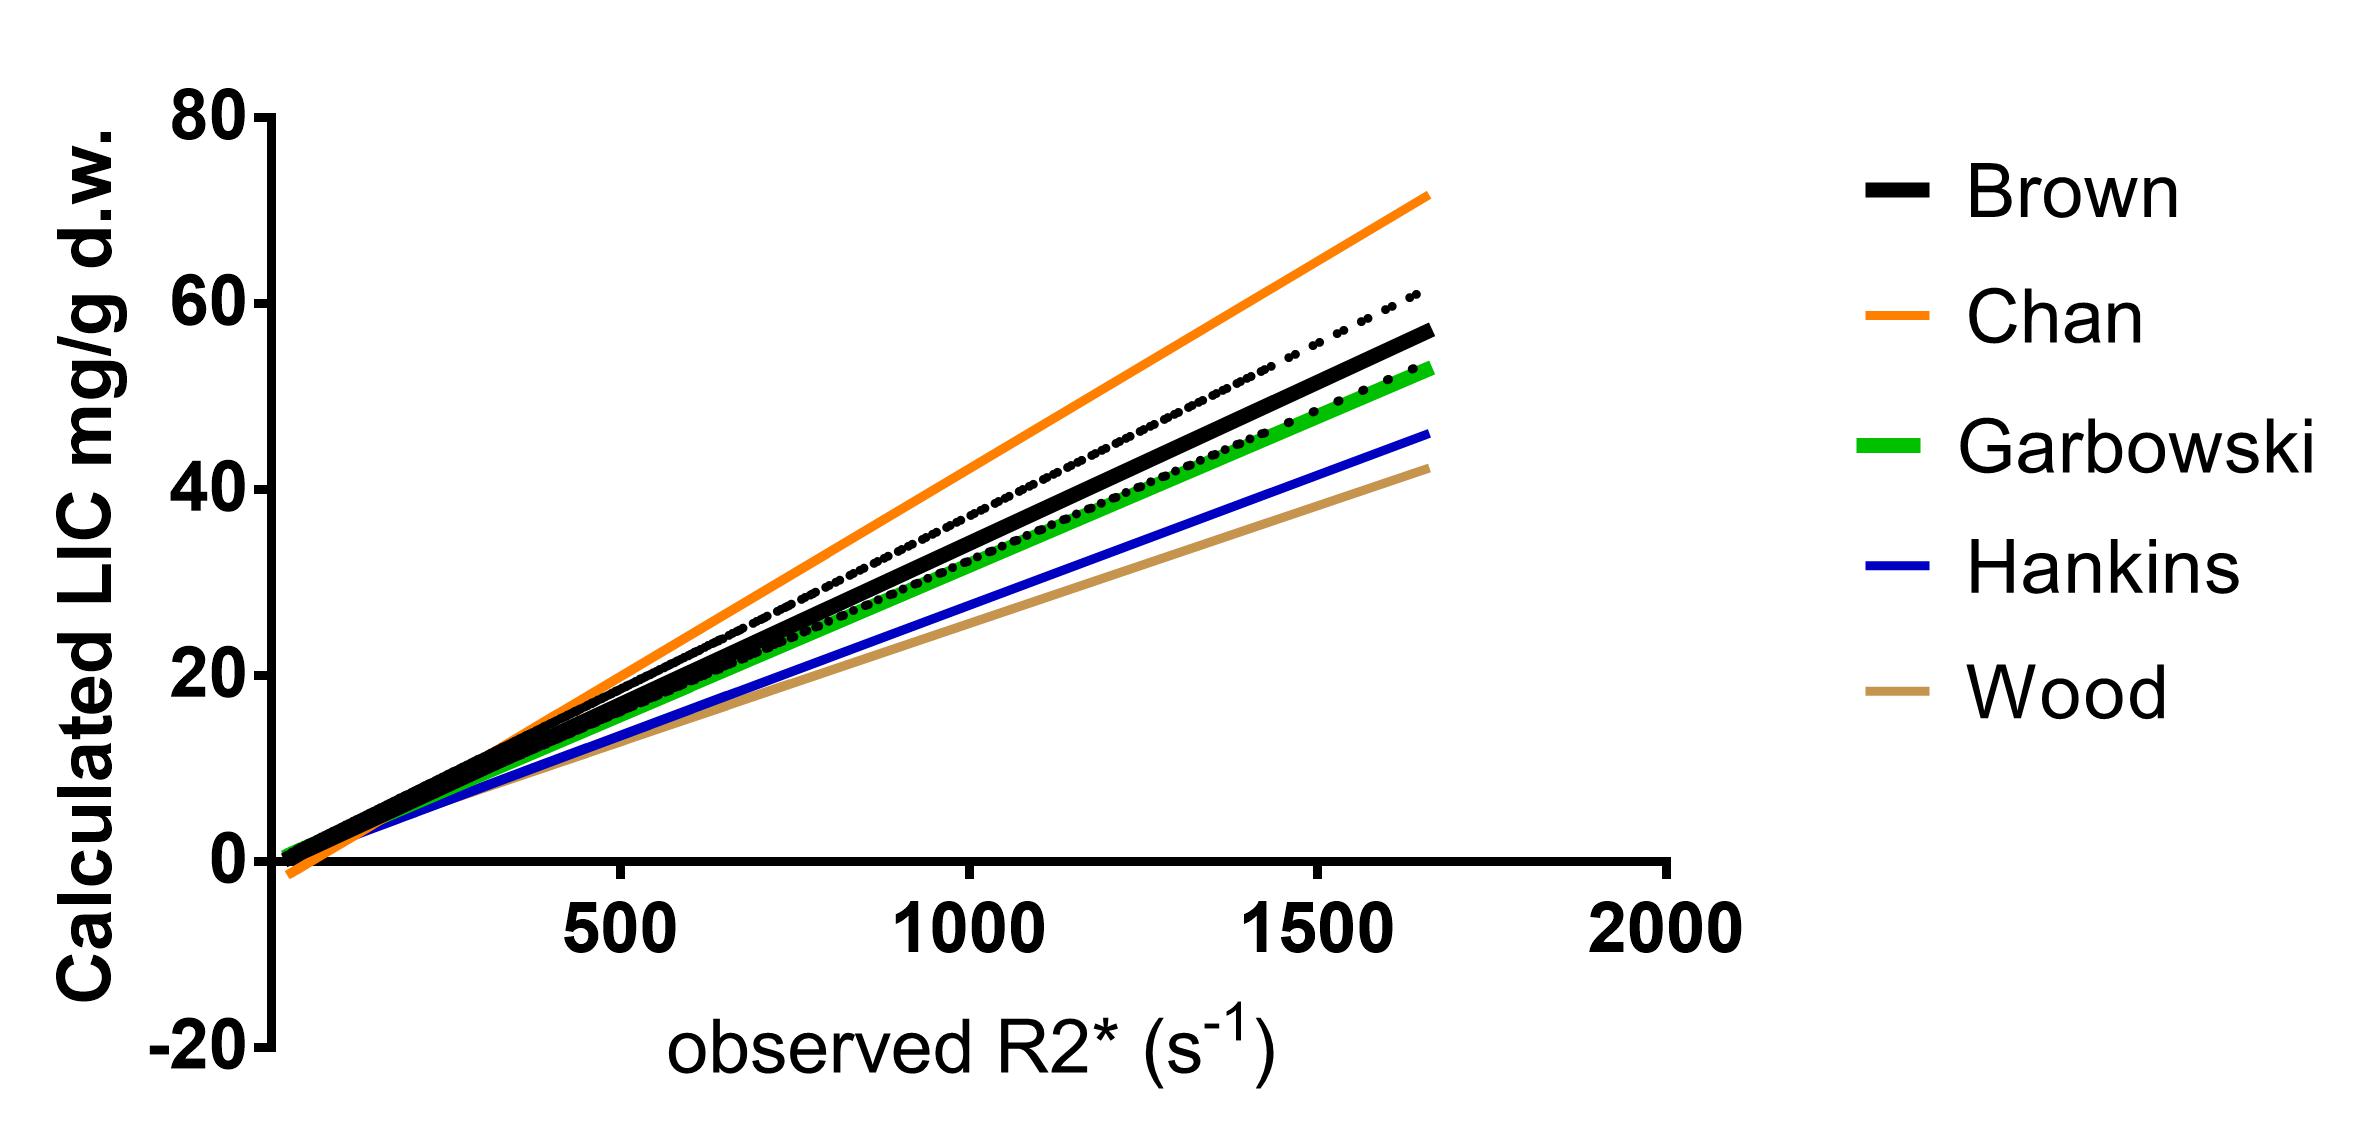
LIC reference values and R2* were both positively skewed. LIC spanned the clinical range (LIC 0.6 to 42.1 mg/g d.w. kurtosis 6, R2* 28 to 1654 s-1 kurtosis 14). R2* and LIC were tightly correlated (Spearman’s ranked rho 0.96, p<0.001) suggesting a calibration was feasible (fig 1). All three models overlapped. The F-test procedures could not reject the simplest model. The linear fit was transposed to create the calibration equation LIC(R2*) = 0.0347 x R2* - 0.48. (95% confidence interval of slope - 0.0372 to 0.0325, Intercept, -0.106 to 0.055). Comparison of the LIC(R2*) and the reference LIC showed a wide 95% confidence interval (+/- 5 mg/g d.w.). (fig. 2) Three of the four prior calibration equations lay outside the 95% confidence interval of calibration for this experiment. (fig. 3)Discussion
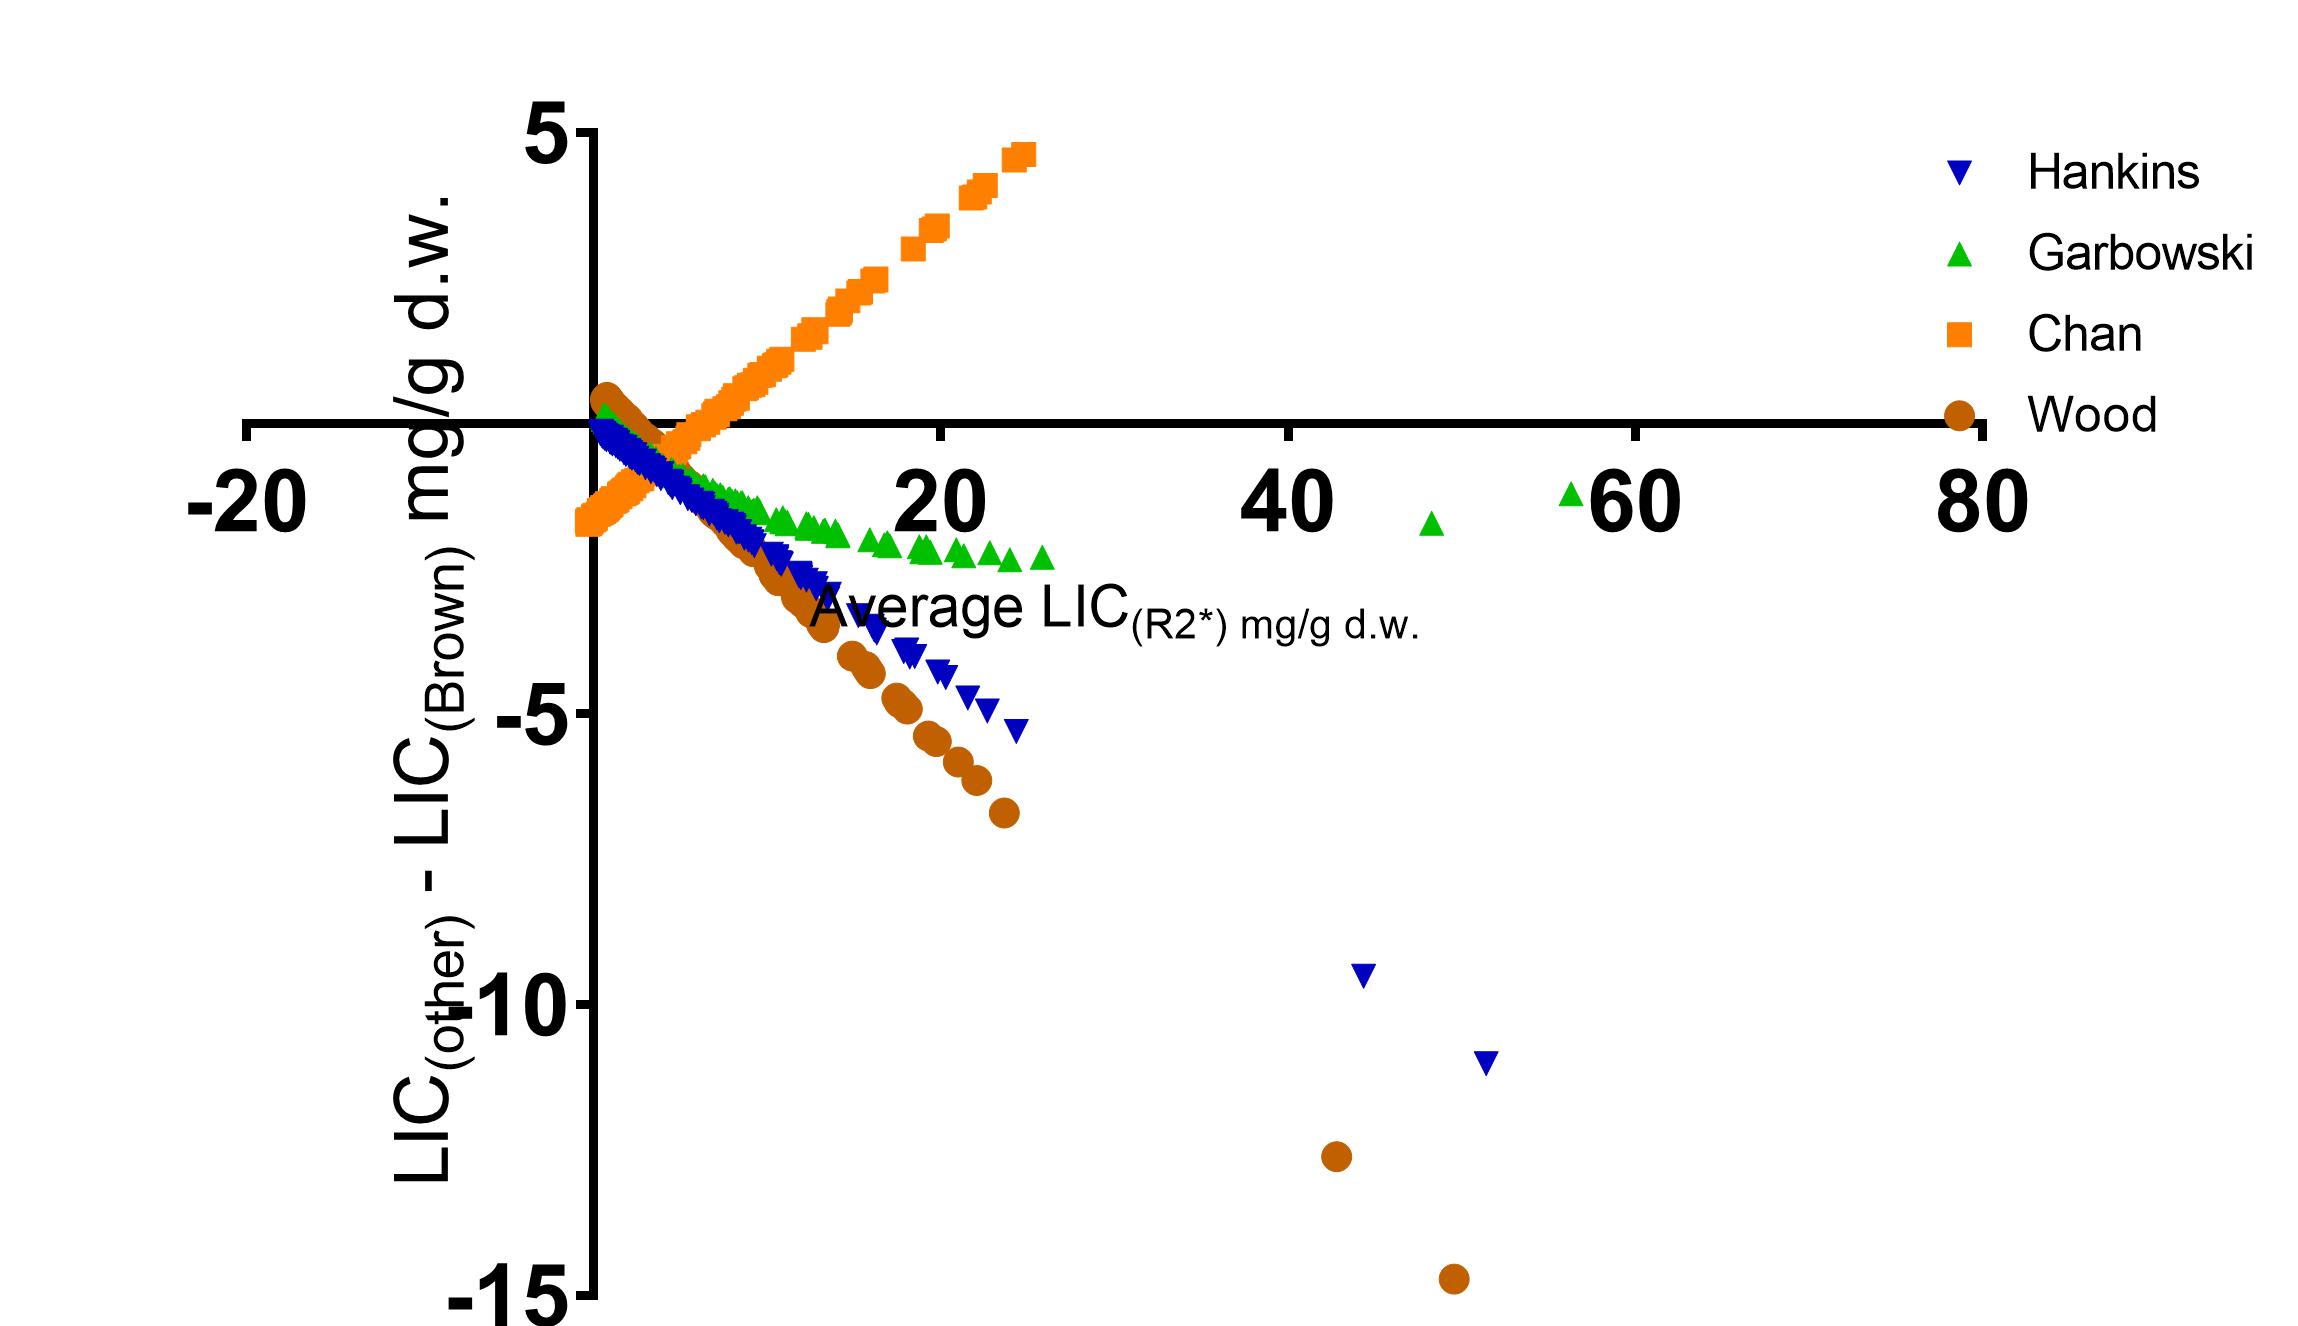
Acquisition and signal modelling methods can influence the observed R2* value across the range of LIC. Our study work used the decay modelling of Wood et al., and the acquisition methods from two other works (3, 4), yet only one (3) lies within the 95% confidence intervals (fig. 3). The calibration differs substantially from the commonly used formula (fig. 4), adding to evidence that its use should be discontinued. We do not conclude that agreement with one other work can establish validity for either, the strength of this calibration lay with the large number of input data points compared to previous studies (167 examinations, 835 gradient echo acquisitions), and its similarity to methods used in the clinic. By employing the validated R2-MRI LIC as its references it extends a method (3,4) that can practically generate larger calibration data pools in the futureAcknowledgements
No acknowledgement found.References
1. Wood JC, Enriquez C, Ghugre N, et al. MRI R2 and R2* mapping accurately estimates hepatic iron concentration in transfusion-dependent thalassemia and sickle cell disease patients. Blood. 2005;106(4)
2. Hankins JS, McCarville MB, Loeffler RB, et al. R2* magnetic resonance imaging of the liver in patients with iron overload. Blood. 2009;113(20)
3. Garbowski MW, Carpenter JP, Smith G, et al. Biopsy-based calibration of T2* magnetic resonance for estimation of liver iron concentration and comparison with R2 Ferriscan. J Cardiovasc Magn Reson. 2014;16(1):40.
4. Chan WC, Tejani Z, Budhani F, et al. R2* as a surrogate measure of ferriscan iron quantification in thalassemia. J Magn Reson Imaging. 2014;39(4)
5. St Pierre TG, Clark PR, Chua-anusorn W, et al. Noninvasive measurement and imaging of liver iron concentrations using proton magnetic resonance. Blood. 2005;105(2)
Figures