1758
Liver proton density fat fraction as a trial endpoint in an international multi-site phase-II trial in patients with type 2 diabetes mellitus following treatment with duodenal mucosal resurfacing1UCL Centre for Medical Imaging, University College London, London, United Kingdom, 2Department of Medical Physics, University College London Hospitals, London, United Kingdom, 3Fractyl Laboratories Inc., Lexington, MA, United States, 4Centre for Obesity Research, University College London, London, United Kingdom, 5National Institute of Health Research, UCLH Biomedical Research Centre, London, United Kingdom
Synopsis
Vendor-certified proton density fat fraction (PDFF) sequences are commercially available across multiple scanner systems and represent a robust method for quantification of liver fat and liver T2* mapping. Type 2 diabetes mellitus (T2DM) is associated with non-alcoholic fatty liver disease and dysregulation of iron homeostasis. Duodenal mucosal resurfacing (DMR) is a novel treatment for patients with T2DM who have poor glycaemic control. We describe our technique for quality assurance across multiple sites using custom fat-water phantoms and report preliminary liver PDFF and liver iron concentration results from a cross-site, multi-vendor study in patients at baseline and 12 weeks after DMR.
Introduction
MRI-based proton density fat fraction (PDFF) has established its potential as a non-invasive, quantitative and accurate liver fat content trial endpoint.1 The accuracy of PDFF derived liver fat fraction (FF) measurements is reliant on correction for T2*-related signal decay.2 PDFF sequences therefore also generate T2* maps, which are used to estimate liver iron concentration (LIC).3 Vendor-derived PDFF sequences (e.g. Philips mDixonQuant, GE IDEAL-IQ) enable multi-site, multi-vendor, multi-field strength studies. Phantom-based quality assurance (QA) is required to ensure baseline coherence and longitudinal stability of measurements.
Type 2 diabetes mellitus (T2DM) prevalence is rising with approximately 382 million people affected globally in 2017.4 T2DM is characterised by insulin resistance in target organs and associated with non-alcoholic fatty liver disease (NAFLD) and dysregulation of iron homeostasis. As the liver represents an important site for glucose and iron metabolism, treatment of T2DM is thought to be associated with reductions in liver fat and liver iron content.5
Current treatments for T2DM include lifestyle modification, anti-diabetic medications and bariatric surgery; however, a growing number of patients have persistent poor glycaemic control. Duodenal mucosal resurfacing (DMR) is a novel endoscopic procedure in which the duodenum is ablated using a specially-designed catheter, with early data demonstrating improvements in glycaemic control in patients with T2DM.6
Revita-2, is a phase-II blinded, sham-controlled, international multi-site, multi-vendor cross-over trial (NCT02879383) designed to evaluate the effects of DMR on glycaemic control and liver FF and LIC using MRI-PDFF in patients with T2DM. Each of the study sites completed up to 5 training (non-randomised) cases to familiarise themselves with the procedure prior to randomisation. We utilised a custom-built liquid emulsion-based QA phantom and report preliminary baseline and 12-week post-treatment PDFF results from the non-randomised cohort.
Methods
Data were acquired at 6 scanning sites (3 Phillips 3T systems; 1 GE 3T system; 2 GE 1.5 systems).
Phantom QA studies:
Six identical fat-water liquid-emulsion based QA phantoms were constructed using known concentrations of peanut oil and 0.008% carrageenan solution, covering a range of PDFF values (Figure 1a,b). Baseline scans were performed centrally on a Phillips 3T Ingenia system (acquisition parameters Figure 2a). Each site performed an initial assessment scan of their phantom locally and at 6 monthly intervals with specified acquisition parameters (Figure 2b). All scans were reviewed to ensure compliance with acquisition parameters.
Circular regions of interest (ROIs) were placed on PDFF maps for each tube (Figure 1c). Measured and reference PDFF values were compared using linear regression (Figure 3a). Central and local baseline scans of each phantom and subsequent interval QA scans were compared using Bland-Altman limits of agreement (Figure 3b).
Patient studies:
T2DM patients (n=20) were recruited prospectively as per trial inclusion criteria. Subjects underwent MRI-PDFF of the liver at baseline and 12 weeks following DMR treatment using specified acquisition parameters (Figure 2b).
Studies were analysed using a custom online platform (Ambra Health, New York, USA). A circular ROI measuring up to 20mm2 in diameter was placed in each of the 9 Coinaud liver segments colocalised on PDFF maps and T2* maps, avoiding vessels and the biliary tree (Figure 4a).
LIC (μmol/g) was estimated from T2* data based on previously published methods.3
Absolute and relative (% of baseline) within-subject change in liver FF and LIC were assessed using the t-test.
Results
Reference and measured phantom FF were correlated for all sites (r2=0.997, p<0.0001), Figure 3a. Bland-Altman 95% limits of agreement for baseline and 12-week PDFF were 0.57±3.53% (Figure 3b).
All liver segments demonstrated statistically significant reductions in FF (p<0.05, Figures 4b,5a,b), with an average 12-week reduction across all liver segments in absolute FF of -5.9% (p=0.008) and relative FF of -28.2% (p=0.002).
The average 12 week change in absolute and relative LIC across all liver segments (Figure 5c,d) was -0.87μmol/g (p=0.1197) and -2.8% (p=0.3729) respectively.
Conclusions
We demonstrate use of MRI-PDFF-derived liver FF and LIC as trial endpoints in a multi-site, multi-vendor, multi-field strength study. QA phantom measurements demonstrated good coherence with reference measurements and stability over a 6-month period.
MRI-PDFF demonstrated statistically significant changes in absolute and relative liver FF in a cohort of 20 patients 12 weeks after DMR. Reduction in liver fat deposition may lead to reduced insulin resistance and improve hepatic glucose metabolism. Further longitudinal assessment of liver FF in this cohort will enable analysis of change over a longer time period and appraise the potential for sustained reductions in liver FF.
There was no significant change in LIC 12 weeks after DMR. We plan to make further longitudinal assessments of LIC in this cohort and correlate with biochemical markers of diabetes.
Acknowledgements
NS, ST, MHC and RB receive funding from the UCL/UCLH BRC. DM is employed by Fractyl Laboratories Inc.References
1. Caussy C, Reeder SB, Sirlin CB, Loomba R. Noninvasive, Quantitative Assessment of Liver Fat by MRI-PDFF as an Endpoint in NASH Trials. Hepatology. 2018;68:763–72.
2. Bray TJ, Chouhan MD, Punwani S, Bainbridge A, Hall-Craggs MA. Fat fraction mapping using magnetic resonance imaging: insight into pathophysiology. Br J Radiol. 2017;20170344.
3. Paisant A, d’Assignies G, Bannier E, Bardou-Jacquet E, Gandon Y. MRI for the measurement of liver iron content, and for the diagnosis and follow-up of iron overload disorders. Presse Med. 2017;46:e279–87.
4. IDF diabetes atlas - 2017 Atlas.
5. Fernández-Real JM, Manco M. Effects of iron overload on chronic metabolic diseases. lancet Diabetes Endocrinol. 2014;2:513–26.
6. Rajagopalan H, Cherrington AD, Thompson CC, Kaplan LM, Rubino F, Mingrone G, et al. Endoscopic Duodenal Mucosal Resurfacing for the Treatment of Type 2 Diabetes: 6-Month Interim Analysis From the First-in-Human Proof-of-Concept Study. Diabetes Care. 2016;39:2254–61.
Figures
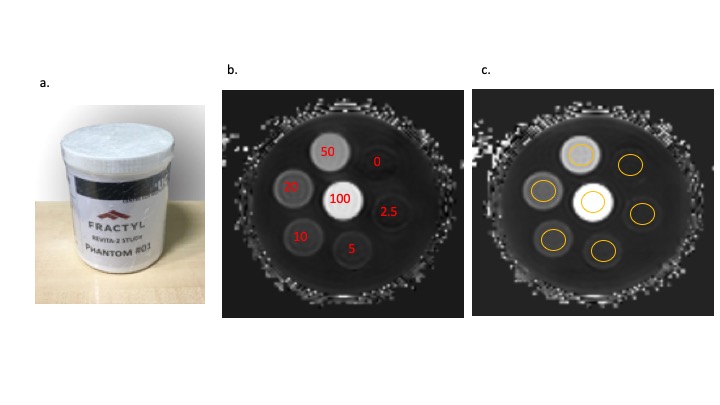
Figure1.
a. Photograph of the custom-built phantom
b. PDFF map with reference fat fractions (%) shown in red
c. PDFF map with example ROI placement for phantom analysis and quality assurance
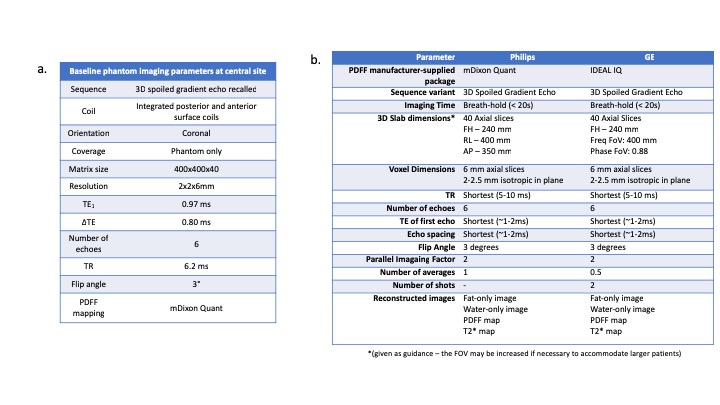
Figure 2. Acquisition parameters.
a. Acquisition parameters for central baseline phantom imaging
b. Acquisition parameters for patient and phantom studies for all sites
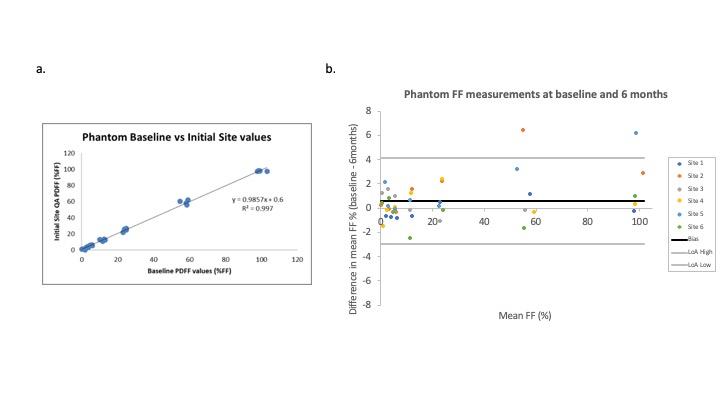
Figure 3. Results of the phantom quality assurance.
a. Scatterplot of reference vs. measured FF (%)
b. Bland-Altman plot demonstrating differences in phantom FF measurements at baseline and 6 months for 6 sites (bias 0.57% ± 3.53)
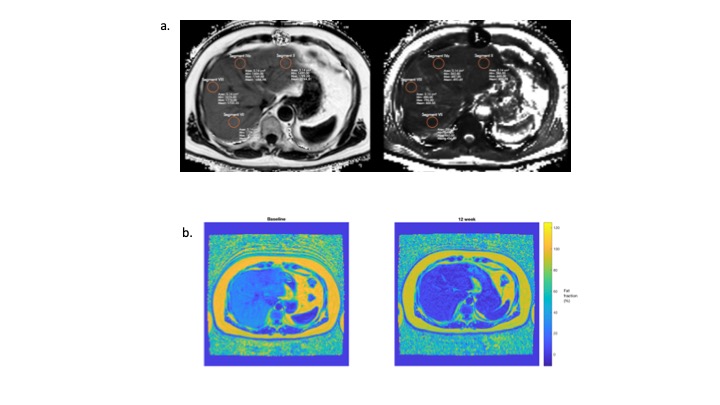
Figure 4.
a. Example of ROI placement on colocalised PDFF (left) and T2* (right) maps
b. Baseline (left) and 12-week (right) post-treatment images from a single subject. Reduction in signal reflects a reduction in PDFF following treatment
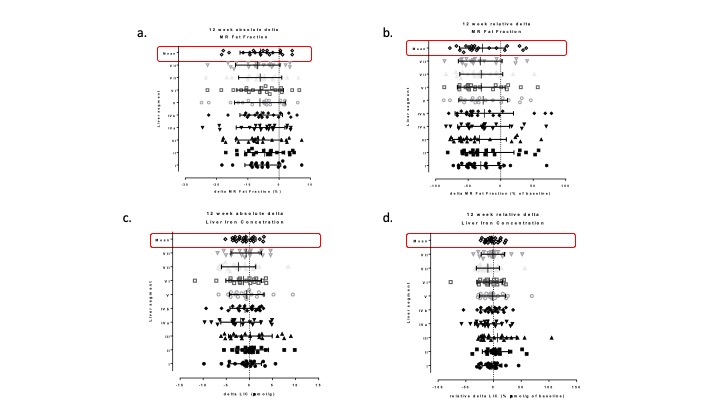
Figure 5. Results of liver fat fraction and LIC measurements.
a. Change in absolute liver FF at 12 weeks for each segment and the mean of all segments
b. Change in relative (as a % of baseline) liver FF at 12 weeks for each segment and the mean of all segments
c. Change in absolute LIC at 12 weeks for each segment and the mean of all segments
d. Change in relative LIC at 12 weeks for each segment and the mean of all segments