1755
Quantitative DCE-MRI Analysis without an Arterial Input Function: A Comparison Study with Compartment Modeling in Liver Lesions1Cornell University, New York, NY, United States, 2Weill Cornell Medicine, New York, NY, United States
Synopsis
Dynamic contrast-enhanced magnetic resonance imaging (DCE-MRI) is a noninvasive
Introduction
Dynamic contrast-enhanced magnetic resonance imaging (DCE-MRI) is a non-invasive technique to characterize tissue through studying dynamics of enhancement curves after administration of contrast agent. The traditional Kety’s compartment modeling (CM) is a quasi-conservation of mass equation of local contrast agent concentration and some global input flow (typically known as arterial input function, AIF) and only incorporates temporal dynamics of the contrast agent. Quantification of perfusion parameters are highly dependent on the selected AIF including magnitude, shape, and its location. In this study we compare this standard CM method with a newly proposed quantitative transport mapping (QTM) approach which 1) does not require an AIF and 2) incorporates both temporal and spatial dynamics of the contrast agent for analysis.Methods
7 patients with liver lesions including metastasis (n=1), hemangioma (n=1), focal nodular hyperplasia (n=2), and hepatocellular carcinoma (n=3) were included in this study after removing all patient identifiers. T1-weighted images using 3D stack of spiral sequence (1) were acquired at 1.5 Tesla (GE Healthcare) before and after the injection of contrast agent (gadoxetate). Image parameters were: scan time 54s, frame rate 2.6s, 15º flip angle, 1.76×1.76×5 mm3 voxel size, TR/TE 6/0.6ms. Slices with the most prominent tumors were selected in aorta (AO) along with portal vein (PV) ROIs as the inputs. Signal intensity was converted to relative enhancement (2) and Kety’s based dual input single CM was used:
$$(k_a,k_p,k_2 )=argmin\sum_{t}||\dot{C}(t)-k_aC_a(t)-k_pC_p(t)+k_2C(t)||_2^2, [1]$$
With $$$\dot{C}(t)$$$ the temporal derivative of concentration $$$C(t)$$$, $$$C_a(t)$$$ AO concentration, $$$C_p(t)$$$ PV concentration, inflow rate constants $$$ (k_a,k_p)$$$ and outflow rate $$$(k_2)$$$. A linear formulation combined with a conjugate gradient solver allowed a significant speeding up of the perfusion parameter mapping (3).
QTM is based on the observation that the transport of molecular particles is governed by the Fokker-Planck (FP) equation that describes the temporal and spatial evolution of the probability density function of the velocity of the particles (4). In our study, the FP equation was solved in a Bayesian setting by regularization the gradient of the velocity field (5,6):
$$\textbf{U}=argmin\sum_{t}||\dot{C}(t,\textbf{r})-\triangledown C(t,\textbf{r}).\textbf{U}(\textbf{r})||_2^2+λ(||\triangledown u(\textbf{r})||_2^2+(||\triangledown v(\textbf{r})||_2^2+(||\triangledown w(\textbf{r})||_2^2), [2]$$
Where the first term is the FP based data fidelity, $$$ \textbf{U}(\textbf{r})={u}(\textbf{r})\widehat{x}+{v}(\textbf{r})\widehat{y}+{w}(\textbf{r})\widehat{z}$$$ the 6D velocity vector field, $$$\triangledown$$$ spatial gradient, and $$$λ$$$ regularization parameter. The velocity is assumed to be constant over time and the flow is incompressible. Velocity magnitude ($$$ |\textbf{U}|=\sqrt{u^2+v^2+w^2}$$$) is calculated from velocity vector field.
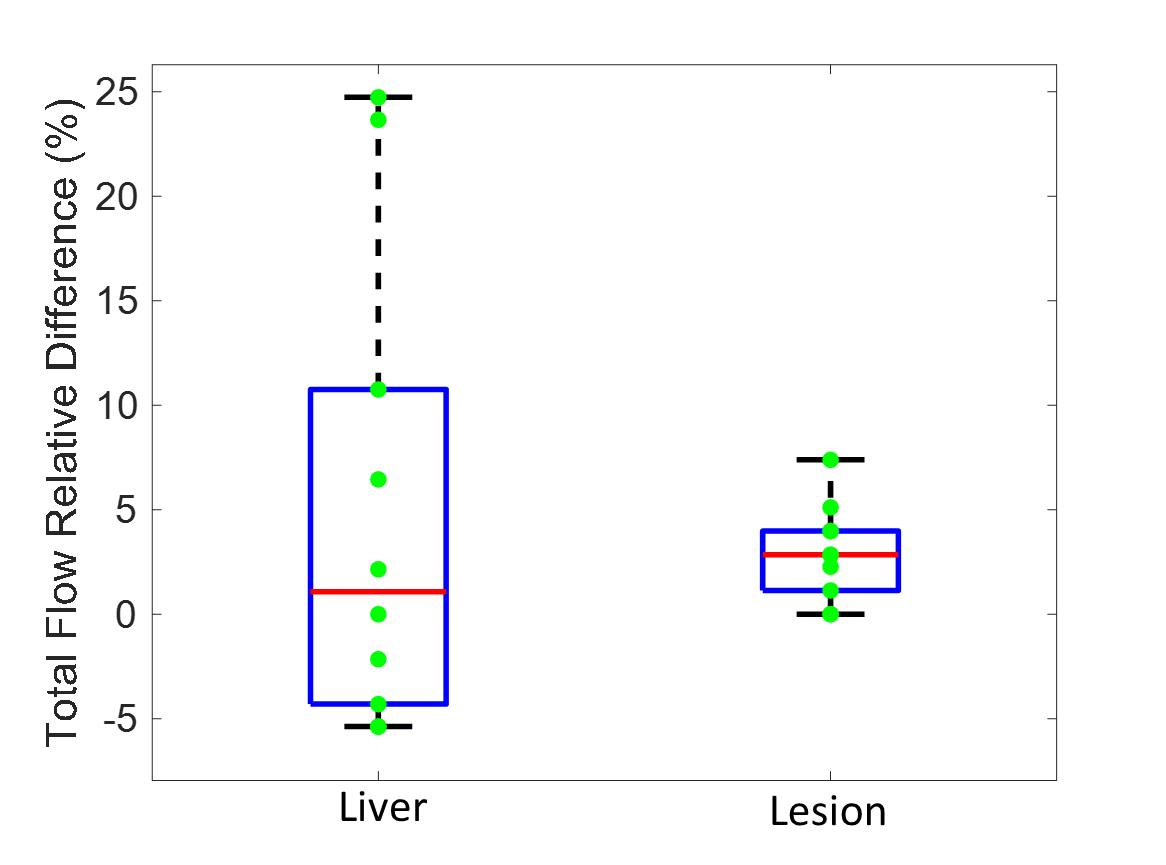
A correlation was performed between the two methods. To test sensitivity of CM to choice of input function (IF) ROIs (liver, lesion) were selected in one FNH case. Since liver is mostly supplied by the PV and the lesion by AO, in liver only the PV input function was changed by selecting different slices on which the PV input function ROI (n=10) was drawn. In the lesion case, only the AIF (n=10) was changed similarly.
Results
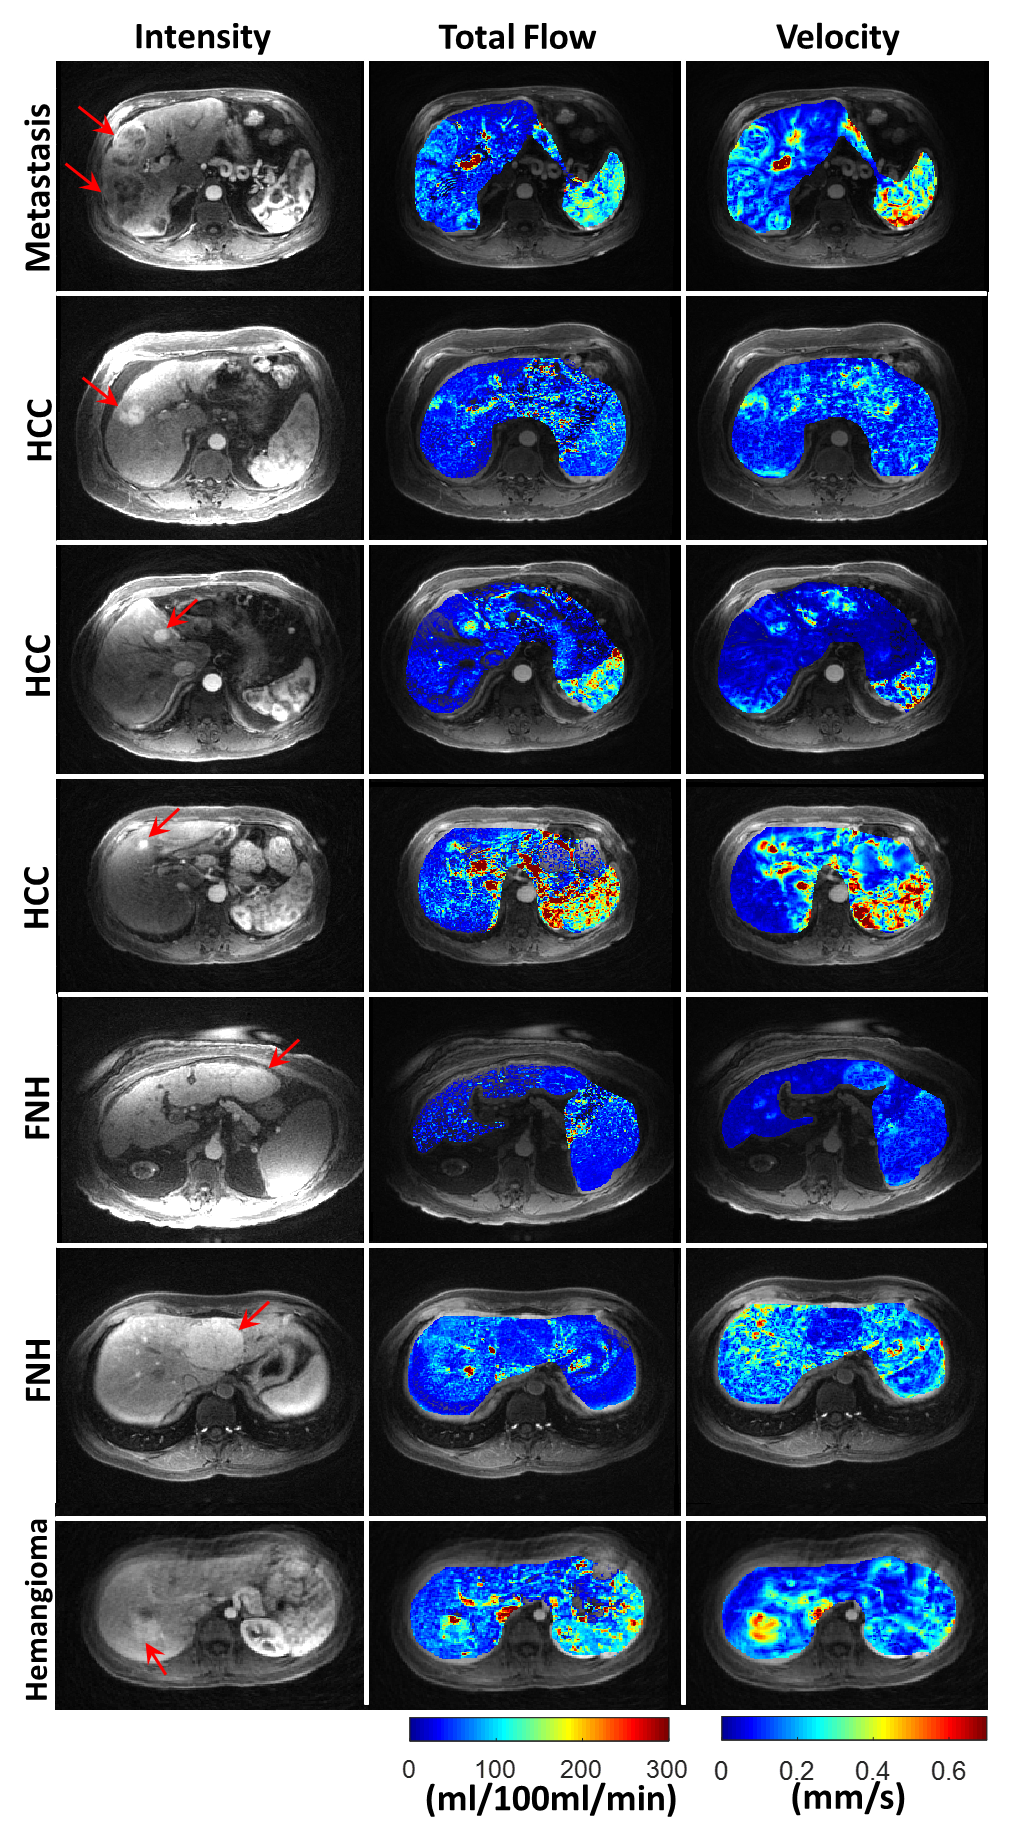
In Figure 1, lesions are shown with red arrows. The corresponding total flow $$$(k_a+k_p)$$$ from CM is compared with the results from QTM (velocity magnitude). In metastasis, HCC, and hemangioma cases, elevated flow and velocity is observed compared to background liver. In FNH, both higher and lower total flow and velocity is observed, with the two methods in agreement. The mean Pearson value (r=0.52) shows moderate correlation between these two methods with the highest correlation in metastasis (r=0.71) and lowest correlation in FNH (r=0.46). Figure 2 shows the sensitivity of the CM to the choice of IF ROI. In the lesion maximum relative difference of 7.4% was observed while in the liver this number was 24.7%.
Conclusion
In this study, we showed that the proposed technique can produce results that correlate with those from standard CM analysis of DCE-MRI data. While the CM parameters are subject to variation depending the shape, magnitude of the input function and ROI location, the proposed method is free from these assumptions. In addition, while connectivity of the voxels (one voxel is input to other neighboring voxel) is ignored in CM and the same input function is used for all voxels, the proposed method incorporates this information. To calculate flow rates from velocity in the proposed method, vasculature structure within the voxels is required which is currently ignored and can be challenging to construct particularly in lesions.Acknowledgements
No acknowledgement found.References
1. Cooper MA, Nguyen TD, Xu B, et al. Patch based reconstruction of undersampled data (PROUD) for high signal-to-noise ratio and high frame rate contrast enhanced liver imaging. Magn Reson Med 2015;74(6):1587-1597.
2. Schabel MC, Parker DL. Uncertainty and bias in contrast concentration measurements using spoiled gradient echo pulse sequences. Phys Med Biol 2008;53(9):2345-2373.
3. Jafari R, Chhabra S, Prince MR, Wang Y, Spincemaille P. Vastly accelerated linear least-squares fitting with numerical optimization for dual-input delay-compensated quantitative liver perfusion mapping. Magn Reson Med 2017;79(4):2415-2421.
4. Darve E, Solomon J, Kia A. Computing generalized Langevin equations and generalized Fokker-Planck equations. Proc Natl Acad Sci U S A 2009;106(27):10884-10889.
5. Spincemaille P, Zhang Q, Nguyen TD, Wang Y. Vector Field Perfusion Imaging. Proc. Intl. Soc. Mag. Recon. Med. 25, 2017.
6. Zhou L, Spincemaille P, Zhang Q, Nguyen TD, Wang Y. Vector Field Perfusion Imaging: A validation Study by using Multiphysics model. Proc. Intl. Soc. Mag. Recon. Med. 26, 2018.
Figures