1754
Correlation between susceptibility, R2* and PDFF in liver1Meinig School of Biomedical Engineering, Cornell University, New York, NY, United States, 2Department of Radiology, Weill Medical College of Cornell University, New York, NY, United States, 3Radiology, UCSD, San Diego, CA, United States, 4Radiological Sciences, UCLA, Los Angeles, CA, United States
Synopsis
A susceptibility difference between the water and fat components in liver should give rise to a linear increase in R2* with proton density fat fraction (PDFF). This is observed empirically although the value of the susceptibility difference is subject to variability (from ~0 ppm to 0.75ppm). The present abstract aims to measure the susceptibility difference directly by measuring liver susceptibility as a function of the PDFF in patients with fatty liver.
Introduction
There have been several independent reports of correlation between R2* and (proton density fat fraction) PDFF in liver [1-3]. The effect persists across field strength and modeling method indicating there is a genuine dependence of R2* on PDFF. Two recent studies investigated the origin of the effect in terms of a fat-water susceptibility difference between water and fat using numerical simulation and theoretical calculation [4-5].
Assuming a model of spheres (fat droplets) with susceptibility Xf embedded in a medium (water) with susceptibility Xw, the rate of exponential signal loss (R2*) arising from the induced dipole field was predicted as a function of the susceptibility difference, dX = Xf - Xw, and quantity of fat (i.e. PDFF).
Ref [4] found that dX = 0.5 ppm could predict the empirically observed slope of PDFF vs R2* whereas Ref [5] found that incorporating dX = 0.21-0.25 ppm in the PDFF model eliminated the dependence of R2* on PDFF. One problem is that these are indirect measures of dX that assume the susceptibility difference is responsible for all of the effect.
With advances in quantitative susceptibility mapping (QSM), it is possible to measure the susceptibility of the liver (Xliver) directly. Plotting Xliver vs PDFF should give a slope that yields the value of dX. The present study aims to directly measure Xliver as a function of PDFF and thereby obtain the susceptibility difference between parenchyma and fat in liver.
Methods
This was a retrospective, cross-sectional study of consecutive liver examinations at 3T who had undergone gradient echo imaging: TR 10.5 ms, TE 0.9-9.0 ms (15 echos acquired in 5 interleaves), flip angle 2, resolution 2x2x8mm, coronal plane. To date, 16 subjects have been processed with up to 70 additional datasets remaining. Magnitude/phase images were exported offline to MATLAB for PDFF and QSM modeling.
PDFF: the complex signal variation with TE was fitted to a mono-exponential decay with fixed fat spectrum (corresponding to 2.5 double bonds per triglyceride molecule). Fieldmap smoothing was employed to remove fat-water swaps. The result was maps of PDFF, R2* and fieldmap.
QSM: fieldmaps generated from the PDFF modeling were used for QSM using Total Field Inversion [6] which involves simultaneous background field removal and local field inversion. A binary mask of the abdominal aorta was used for zero referencing [7].
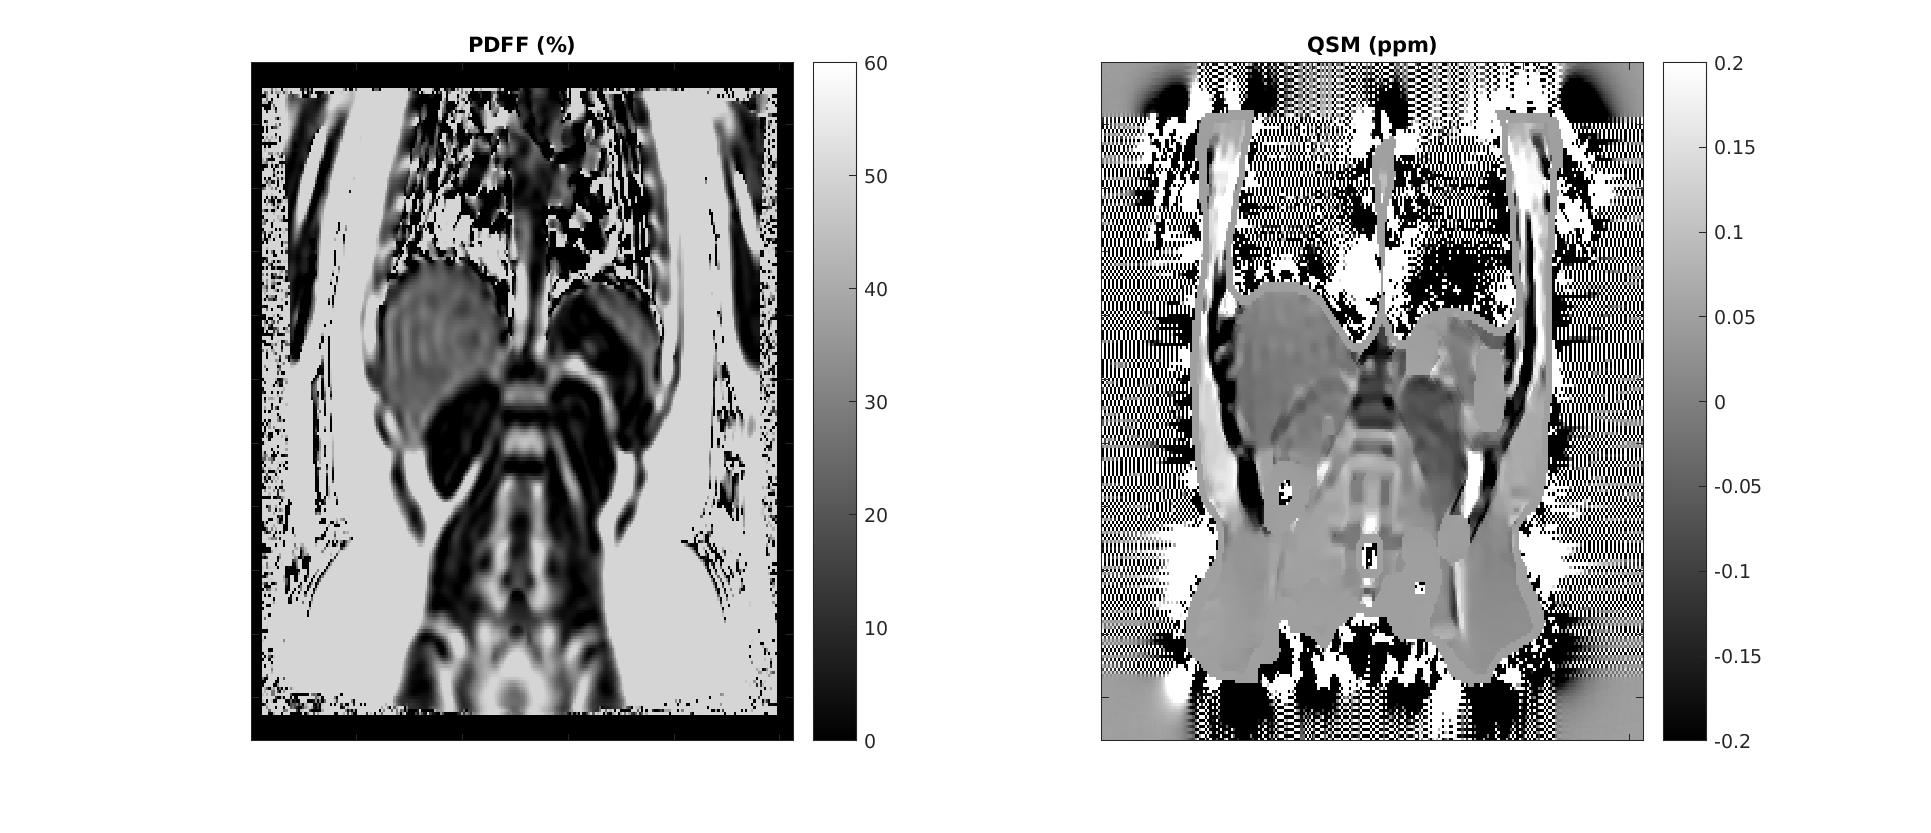
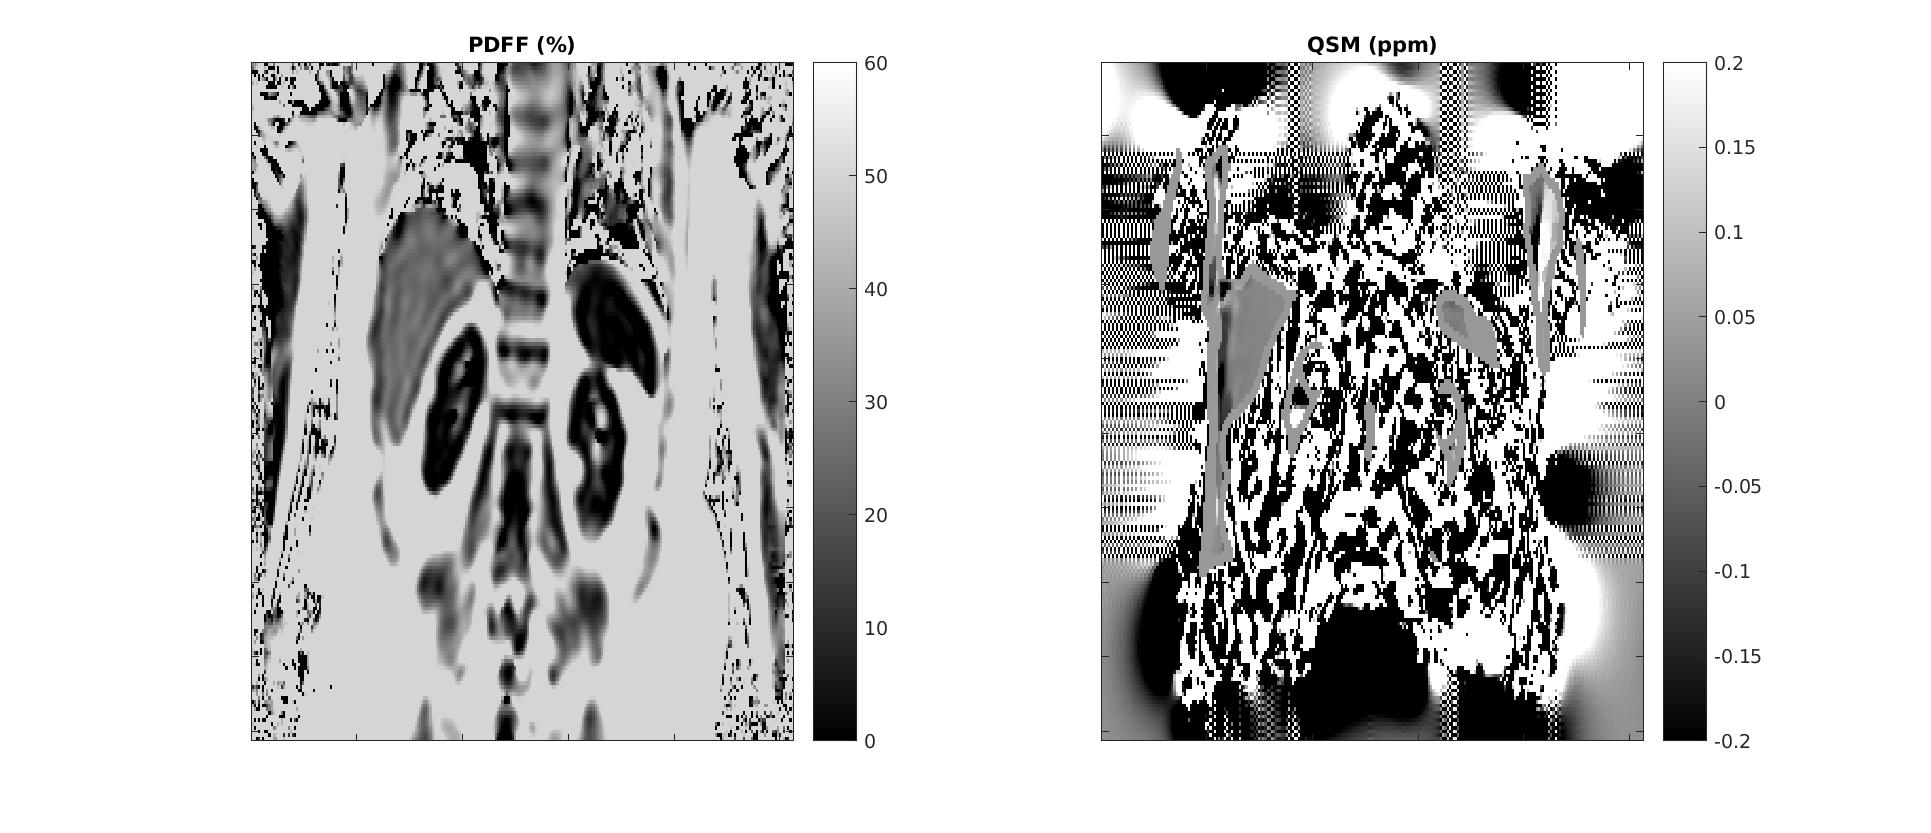
Quality assurance: examples of acceptable maps are shown in Figure 1 and unacceptable maps are shown in Figure 2. Failures typically occurred at edge slices due to aliasing along the slab-direction or excessive motion artifact or uncorrected parallel imaging aliasing.
ROI analysis: regions of interest of around 200 voxels were drawn on the PDFF map in the right lobe of the liver, taking care to avoid large vessels and imaging artefacts. The corresponding QSM maps were also inspected to ensure that gross defects were not present. Out of 204 total acquired slices, 116 were deemed acceptable for the ROI analysis.
Results and Discussion
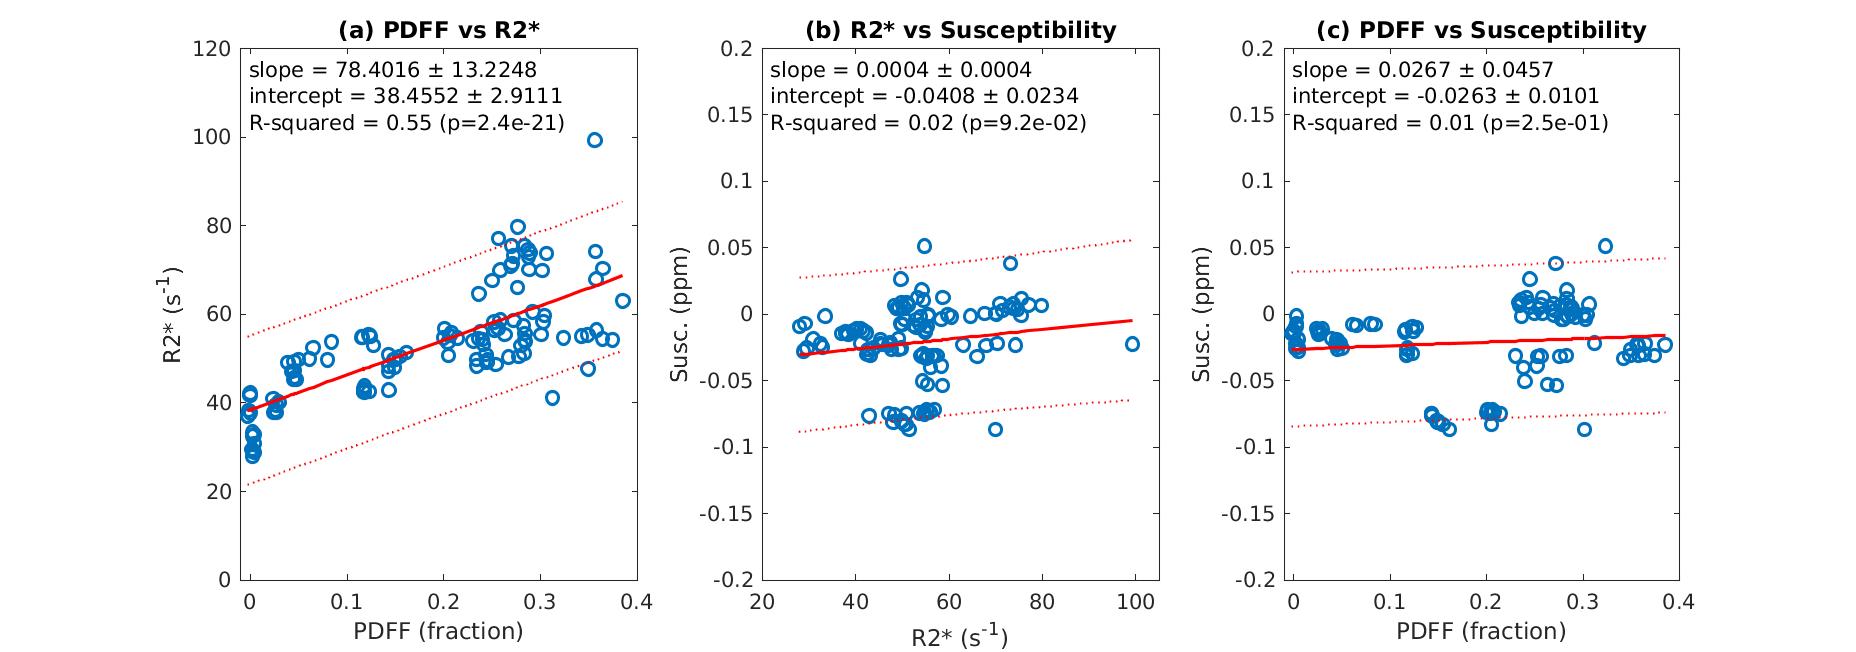
Figure 3 shows linear regression plots for (a) PDFF vs R2*, (b) R2* vs QSM and (c) PDFF vs QSM. Positive correlations were detected in all three cases but only significant for the first plot.
Plot (a) has a significant slope of 78.4 which is in agreement with several previous studies [1-3] confirming the strong correlation between PDFF and R2*.
Plot (b) has a slope of 0 within error which essentially agrees with Ref [8] over this small range of R2* (since there is no iron overload in these subjects).
Plot (c) also has a slope of 0 within error. A previous study in 38 patients also found no significant correlation between PDFF and QSM [9]; however they also found no correlation between PDFF vs T2* which conflicts with previous studies and the present study.
A low value of dX would mean that the correlation between PDFF and R2* can not be explained by susceptibility-induced dephasing by fat droplets, which is a surprising result considering recent simulation and theoretical results [4-5]. These predict values of around 0.21 to 0.5 ppm and are in agreement with the previously reported 0.26 ppm difference between liver and subcutaneous fat [7]. The authors are investigating the role of PDFF modeling assumptions such as fieldmap smoothing in QSM estimation. The inclusion of the remaining 70 subjects’ data in the analysis may also lead to a more definitive result.
Acknowledgements
No acknowledgement found.References
[1] Lee JT, Liau J, Murphy P, Schroeder ME, Sirlin CB, Bydder M. Cross-sectional investigation of correlation between hepatic steatosis and IVIM perfusion on MR imaging. Magn Reson Imag 2012; 30: 572
[2] Hernando D, Haufe WM, Hooker CA, Schlein A, Wolfson T, Artz NS, Reeder SB, Sirlin CB. Relationship between liver proton density fat fraction and R2* in the absence of iron overload. Proc ISMRM 2015:4118
[3] Mamidipalli A, Hamilton G, Manning P, Hong CW, Park CC, Wolfson T, Hooker J, Heba E, Schlein A, Gamst AM, Durelle J, Paiz M, Middleton MS, Schwimmer JB, Sirlin CB. Cross-Sectional Correlation Between Hepatic R2* and Proton Density Fat Fraction (PDFF) in Children With Hepatic Steatosis. J Magn Reson Imaging 47(2) 2018 p418-424
[4] Changqing Wang, Benjamin Andrew Ratliff, Claude B. Sirlin, Scott B. Reeder, Diego Hernando. Monte Carlo Modeling of Liver MR Signal in the Presence of Fat. ISMRM 2018:2264
[5] Mark Bydder, Ludovic de Rochefort, Gavin Hamilton, Nikolaus Szeverenyi, Claude Sirlin. The change in R2* with PDFF in liver can be explained by the water/fat susceptibility difference. ISMRM 2018:2771
[6] Liu Z, Kee Y, Zhou D, Wang Y, Spincemaille P. Preconditioned total field inversion (TFI) method for quantitative susceptibility mapping. Magn Reson Med 2017;78(1):303-315
[7] Liu Z, Spincemaille P, Yao Y, Zhang Y, Wang Y. MEDI+0: Morphology enabled dipole inversion with automatic uniform cerebrospinal fluid zero reference for quantitative susceptibility mapping. Magn Reson Med 2018;79(5):2795-2803
[8] Samir D. Sharma, Diego Hernando, Debra E. Horng, Scott B. Reeder. Quantitative Susceptibility Mapping in the Abdomen as an Imaging Biomarker of Hepatic Iron Overload. Magnetic Resonance in Medicine 74:673–683 (2015)
[9] B. Leporq, S.A. Lambert, M. Ronot, V. Vilgrain, B.E. Van Beers. Simultaneous MR quantification of hepatic fat content, fatty acid composition, transverse relaxation time and magnetic susceptibility for the diagnosis of nonalcoholic steatohepatitis. NMR Biomed 2017;30:e3766
Figures