1753
Non-invasive assessment of hepatic fibrosis and inflammatory activity in patients with chronic hepatitis B:Comparison of multiple diffusion-weighted MR imaging models1Department of Radiology, Henan Provincial People’s Hospital, People’s Hospital of Zhengzhou University, Zhengzhou, China, 2Department of Pathology, Henan Provincial People’s Hospital, People’s Hospital of Zhengzhou University,Zhengzhou, 450003, China., Zhengzhou, China, 3Cooperative Innovation Center of Internet Healthcare & School of Software and Applied Technology, Zhengzhou University, Zhengzhou, 450001, China., Zhengzhou, China
Synopsis
In this study, we assessed the value of various diffusion parameters obtained from monoexponential, biexponential, and stretched-exponential DWI models in predicting the hepatic fibrosis (HF) stage and inflammatory activity grade in patients with chronic hepatitis B (CHB). We found that true diffusion coefficient (Dt) and distributed diffusion coefficient (DDC) are promising indicators and outperform the standard apparent diffusion coefficient (ADCst) for HF staging and inflammatory activity grading. We believe that biexponential and stretched-exponential model could be more helpful compared with monoexponential model in monitoring the progression of HF and inflammatory activity, guiding therapy, and assessing the effect of the treatment.
Introduction
In patients with chronic hepatitis B (CHB), the hepatic fibrosis (HF) stage and inflammatory activity grade are critical indicators for therapeutic strategies and prognosis. However, patients with CHB usually show no symptoms or only present with mild abdominal distension, making it difficult to stage HF and grade inflammatory activity. Invasive liver biopsy is the current gold standard for assessing HF and inflammation, but this technique has some limitations.1
Diffusion-weighted imaging (DWI) with multiple b-values as a non-invasive and non-contrast MRI technique has shown potential in the assessment of HF.2,3 The parameter ADCst obtained from a monoexponential DWI model has been used for the detection and semi-quantification of HF and has shown to be useful in the evaluation of HF.3,4 However, ADCst values might not accurately represent water molecular diffusion in biological tissues because they are impacted by the microcirculation of the blood in the capillaries.
Some prior studies have showed that biexponential or stretched-exponential DWI models may provide more accurate information with respect to water diffusion.5-8 The biexponential model introduced by Le Bihan et al.5 could allow the separation of water molecular diffusion from microcirculation in vivo. However, its value in HF stage and inflammatory activity grade has not been well investigated until recently. The stretched exponential model proposed by Bennett et al.6 was used for describing the distributed diffusion effect and the heterogeneity of intravoxel diffusion rates and could truly reflect the physiological characteristics of tissue in vivo. Because DWI with different models may display different aspects of biological tissue properties, it should be valuable for comparing their roles in evaluating HF and inflammation. To our knowledge, no comparison of the monoexponential, biexponential, and stretched exponential DWI model in the assessment of HF and inflammatory activity in CHB has been investigated so far.
Purpose
To compare the value of various diffusion parameters obtained from monoexponential, biexponential, and stretched exponential DWI models in staging HF and grading inflammatory activity in patients with CHB.
Methods
Between June 2014 and December 2016, a total of 82 patients with CHB and 30 healthy volunteers underwent prospective DWI with 13 b-values on a 3T MRI unit. All the patients had a definite hepatitis B virus infection history of more than 6 months. HF and inflammatory activity were staged according to the internationally available METAVIR scoring system. The standard apparent diffusion coefficient (ADCst) was calculated using a monoexponential model. The true diffusion coefficient (Dt), pseudo-diffusion coefficient (Dp), and perfusion fraction (f) were calculated using a biexponential model. The distributed diffusion coefficient (DDC) and water-molecule diffusion heterogeneity index (α) were calculated using a stretched-exponential model. Receiver operating characteristic (ROC) curves were performed for diffusion parameters to compare the diagnosis performance for staging HF and inflammatory activity.
Result
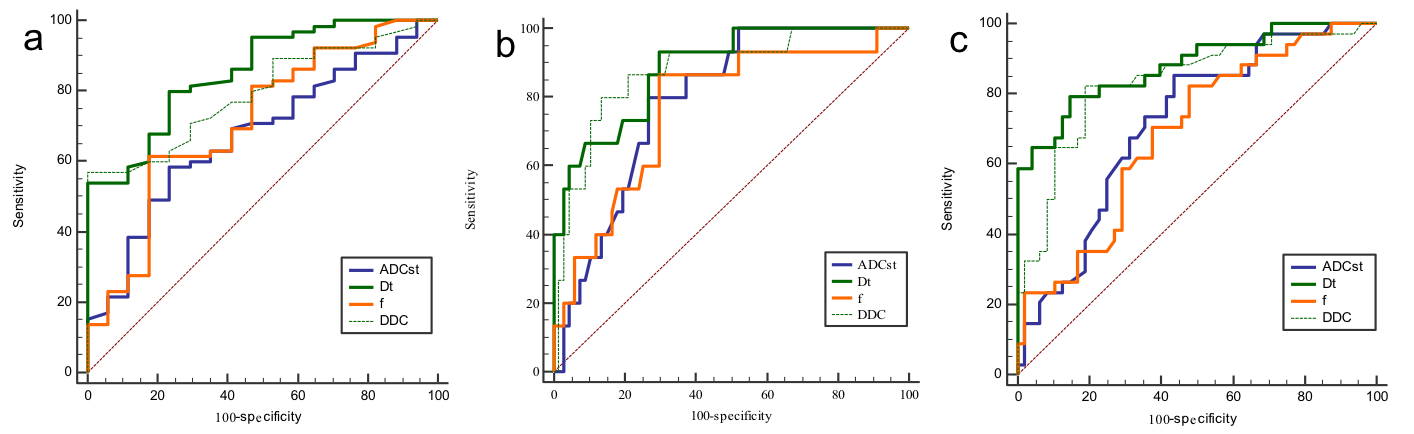
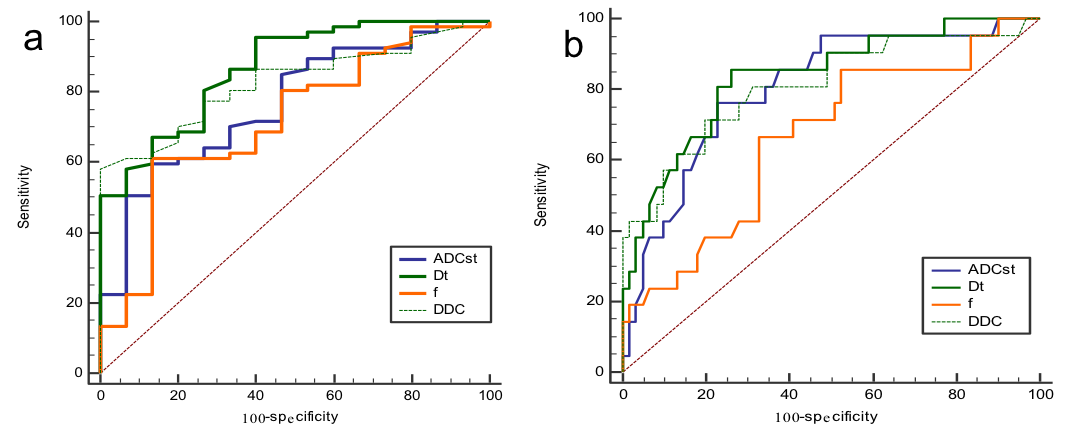
Patients with significant fibrosis (≥F2) had lower hepatic ADCst, Dt, f, and DDC values than those without or with early fibrosis (≤F1) and healthy volunteers (all P < 0.05). The area under the receiving operating characteristic curve (AUC) values for diagnosis of fibrosis stage ≥F2/≥F3/F4 with ADCst, Dt, f, and DDC were 0.673/0.717/0.791, 0.854/0.881/0.886, 0.711/0.689/0.768, and 0.794/0.834/0.878, respectively (Fig.1 ). Patients with moderate-to-severe inflammatory activity (≥A2) had lower hepatic ADCst, Dt, f, and DDC values than those without or with mild activity (≤A1) and healthy volunteers (all P < 0.05). The AUC values for the diagnosis of ≥A2/A3 inflammatory activity with ADCst, Dt, f, and DDC were 0.767/0.803, 0.867/0.836, 0.717/0.665, and 0.826/0.811, respectively (Fig.2 ).
Discussion
In this study, our results showed that Dt and DDC had higher diagnostic performances than the other diffusion parameters (ADCst, Dp, f, and α) in differentiating significant HF (≥F2) and moderate-to-severe activity (≥A2). In addition, Dt, DDC, f, and ADCst showed significantly lower values in ≥F2 than in ≤ F1 and in ≥F3 than in ≤F2, whereas Dp and α did not show any differences between the above groups. Moreover, Dt, DDC, and ADCst showed significantly lower values in ≥A2 than in ≤A1 and in A3 than in ≤A2. As such, Dt and DDC might serve as optimal diffusion parameters for detecting significant HF and moderate-to-severe inflammatory activity for patients with CHB compared to other diffusion parameters.
Conclusion
Dt and DDC are promising indicators and outperform ADCst in staging HF and inflammatory activity in patients with CHB.
Acknowledgements
This research was supported by the NNSFC (81720108021, 81772009, 81601466, 81641168, 31470047), National Key R&D Program of China (YS2017YFGH000397), Scientific and Technological Research Project of Henan Province (182102310162) and the Key Project of Henan Medical Science and Technology Project (201501011).References
1. A.A. Bravo, S.G. Sheth, S. Chopra. Liver biopsy, N Engl J Med 2001; 344(26): 495-500.
2. Sandrasegaran K, Akisik FM, Lin C, et al. Value of diffusion-weighted MRI for assessing liver fibrosis and cirrhosis. AJR Am J Roentgenol 2009; 193(6): 1556-1560.
3. Taouli B, Koh DM. Diffusion-weighted MR imaging of the liver. Radiology 2010; 254(1): 47-66.
4. Fujimoto K, Tonan T, Azuma S, et al. Evaluation of the Mean and Entropy of Apparent Diffusion Coefficient Values in Chronic Hepatitis C: Correlation with Pathologic Fibrosis Stage and Inflammatory Activity Grade. Radiology 2011; 258(3): 739-748.
5.Le Bihan D, Breton E, Lallemand D, et al. MR imaging of intravoxel incoherent motions: application to diffusion and perfusion in neurologic disorders. Radiology 1986; 161(2): 401-407.
6.Bennett KM, Schmainda KM, Bennett RT, et al. Characterization of continuously distributed cortical water diffusion rates with a stretched-exponential model. Magn Reson Med 2003; 50(4): 727-734.
7.Yoon JH, Lee JM, Baek JH, et al. Evaluation of hepatic fibrosis using intravoxel incoherent motion in diffusion-weighted liver MRI. J Comput Assist Tomogr 2014; 38(1): 110-116.
8.Liu X, Zhou L, Peng W, et al. Comparison of stretched-exponential and monoexponential model diffusion-weighted imaging in prostate cancer and normal tissues. J Magn Reson Imaging 2015; 42(4): 1078-1085.
Figures