1752
Staging liver fibrosis with T1rho MR imaging and ultrasonic elastography alone and in combination in patients with chronic hepatitis B1Tianjin First Center Hospital, Tianjin, China, 2Clinical Science, Philips Healthcare, Beijing, China
Synopsis
In this article, we compare the diagnostic efficiency of T1rho, ultrasonic elastography (UE) and the combination of them in staging liver fibrosis. Thirty-two patients with chronic hepatitis B underwent T1rho MRI and UE were analyzed. T1rho is better than UE in staging liver fibrosis, and the combination of T1ho and UE can improve the diagnostic efficiency in differentiating F1 from F2-4.
Purpose
Liver fibrosis commonly occurs in almost all cases of chronic liver disease. Due to the possibility of reverse, patients with obvious fibrosis should be treated immediately [1, 2]. Ultrasonic elastography is widely used for screening fibrosis in clinical practice, but the result is affected by some factors [3-5]. T1rho reflects the interactions between motionrestricted water molecules and their local macromolecular environment, it may be sufficiently sensitive for evaluating liver fibrosis [6]. The purpose of this study is to compare and combine the value of T1rho MRI and ultrasonic elastography (UE) in staging liver fibrosis in patients with chronic hepatitis B (CHB).Materials and methods
Thirty-two CHB patients with different fibrosis stages (F1: n=13; F2: n=11, F3-4: n=8) were prospectively assessed with T1rho MRI and UE. Liver T1rho and liver stiffness (LS) values were measured and compared among different fibrosis stages using One way ANOVA followed with Turkey testing or Kruskal-Wallis followed with Nemenyi testing. The diagnostic performance for diagnosis different fibrosis stages were evaluated for each modality alone and in combination using receiver operating characteristic analysis.Results
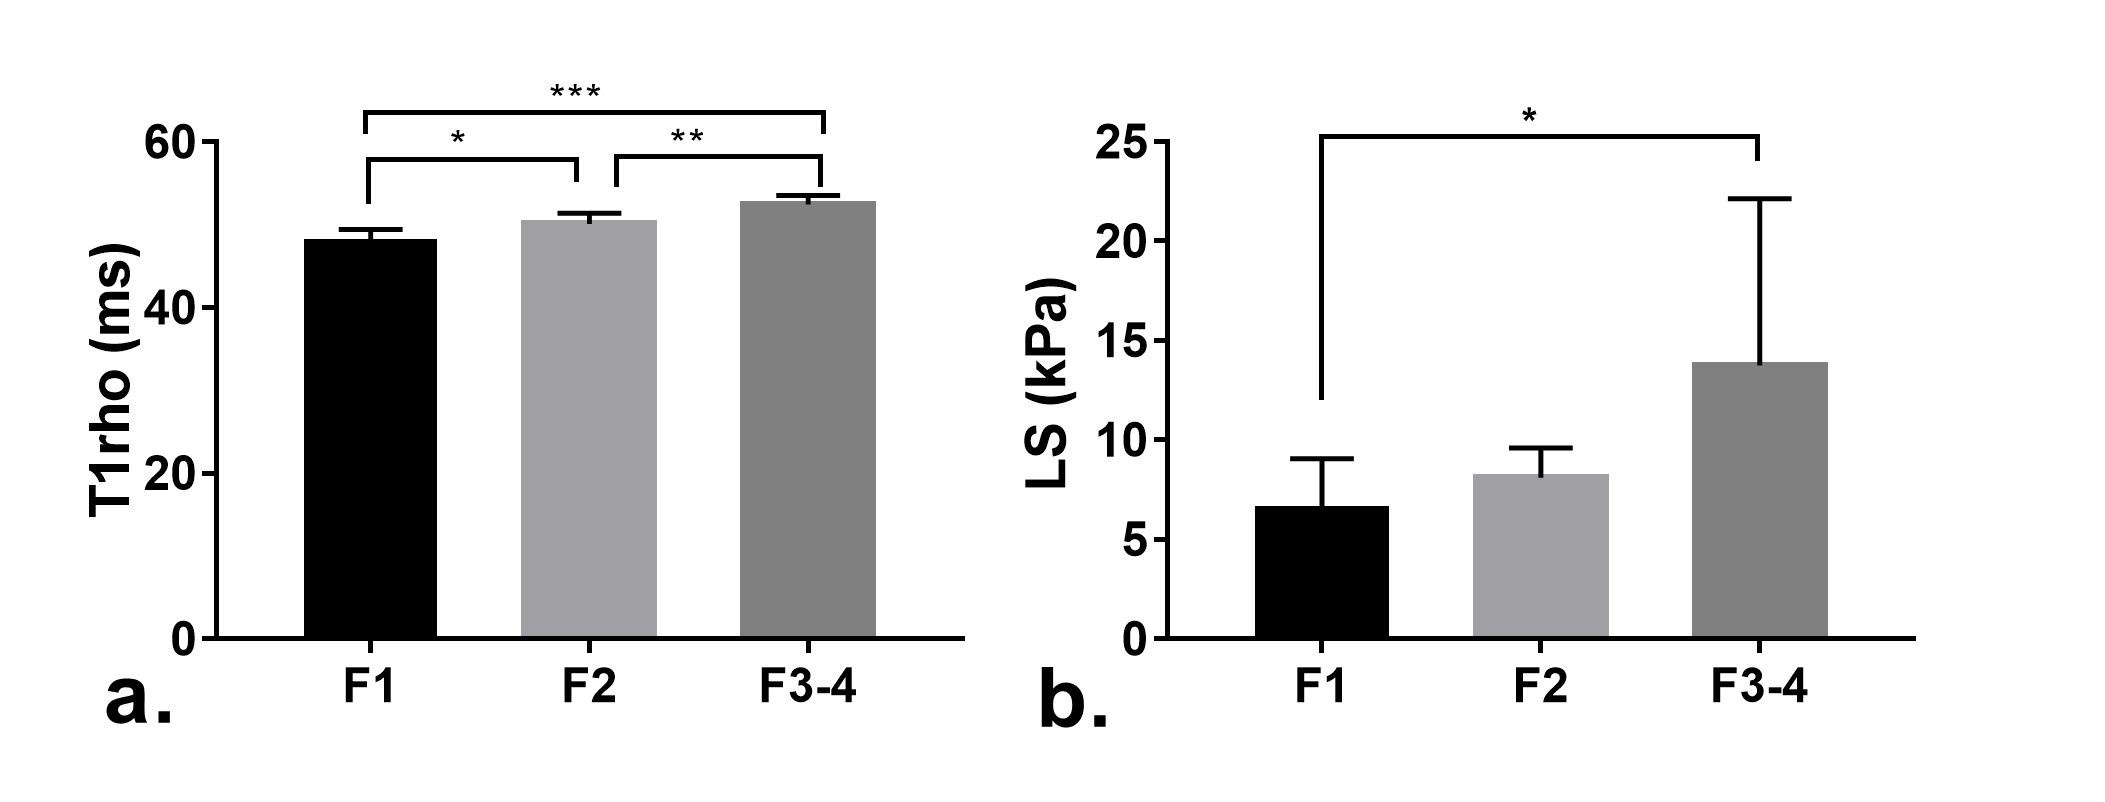
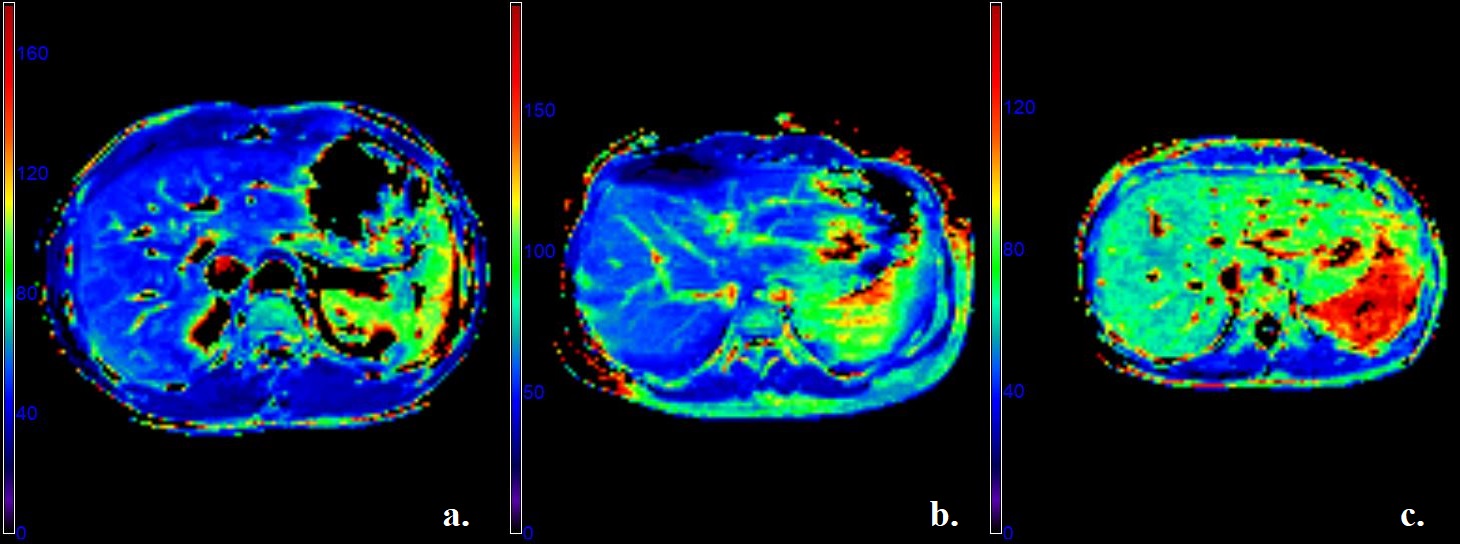
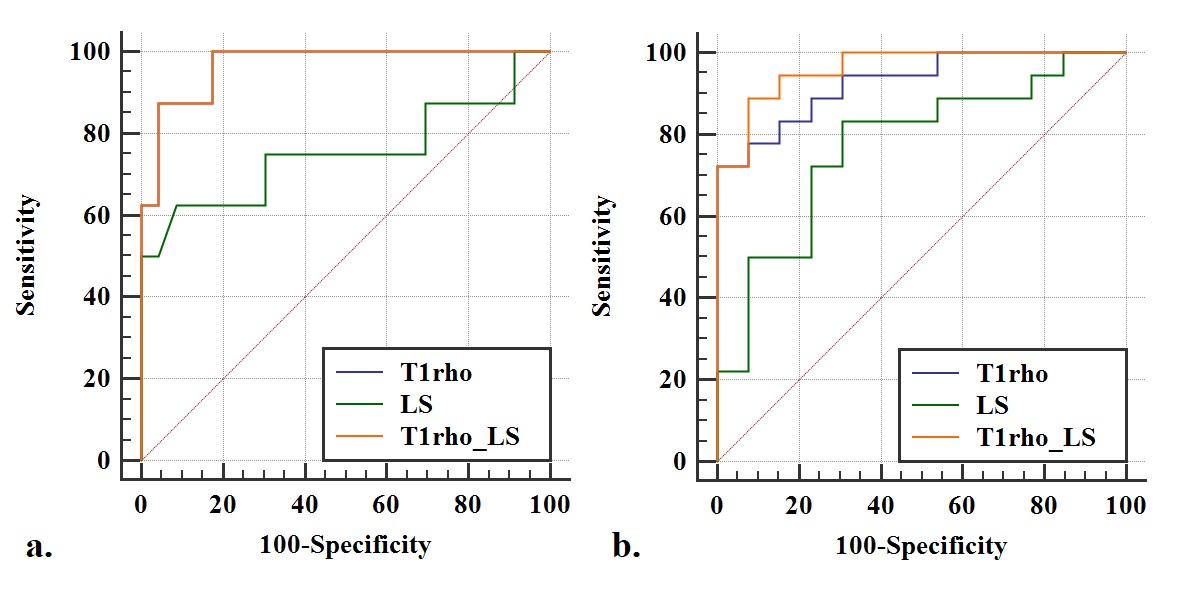
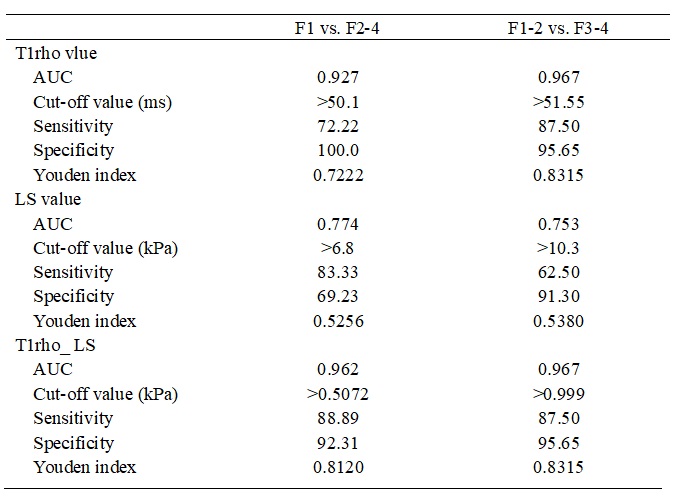
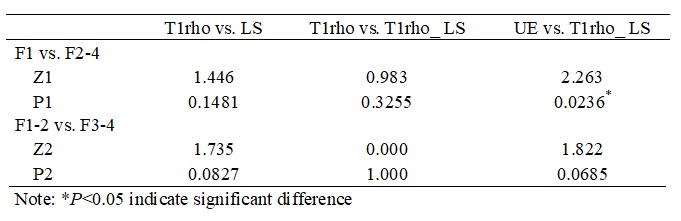
Both liver T1rho (F1: 47.96±1.51ms; F2: 50.13±1.30ms; F3-4: 52.46±1.12ms; F=27.706, P<0.001) and LS values (F1: 6.58±2.49kPa; F2: 8.12±1.49kPa; F3-4: 13.75±8.30kPa; P=0.024) increased as the progression of liver fibrosis. Figure 1 and 2 showed the difference of liver T1rho and LS values in different fibrosis stages. Liver T1rho values showed significant difference between any two groups (all P<0.01), LS values only showed significant difference between F1 and F3-4 (P=0.009). Liver T1rho and LS values correlated with fibrosis stages with r=0.829 (P<0.001) and 0.497 (P=0.004), respectively. The diagnostic performance of liver T1rho and LS values for differentiating fibrosis stages was shown in Table 1. The area under ROC curve (AUC) of T1rho is higher than LS in differentiating F1 from F2-4, and F1-2 from F3-4. Combining T1rho and LS improved the AUC to 0.962 for differentiating F1 from F2-4, and provided 88.89% sensitivity and of 92.31% specificity, but had no advantage on differentiating F1-2 from F3-4, when compared with T1rho alone (Table 2, Figure 3).Discussion and Conclusion
Our results showed that the diagnostic efficiency of T1rho was better than UE in differentiating F1 from F2-4, F1-2 from F3-4, but there’s no statistic difference. Combining T1rho and LS can’t improve the diagnostic efficiency obviously, but can improve the sensitivity and specificity in differentiating F1 from F2-4.Acknowledgements
NoReferences
1. Marcellin P, Gane E, Buti M, Afdhal N, Sievert W, Jacobson IM, et al. Regression of cirrhosis during treatment with tenofovir disoproxil fumarate for chronic hepatitis B: a 5-year openlabel follow-up study. Lancet 2013;381:468-475.
2. Sarin SK, Kumar M, Lau GK, Abbas Z, Chan HL, Chen CJ, et al. Asian-Pacific clinical practice guidelines on the management of hepatitis B: a 2015 update. Hepatol Int 2016;10:1-98.
3. Sagir A, Erhardt A, Schmitt M, Häussinger D. Transient elastography is unreliable for detection of cirrhosis in patients with acute liver damage. Hepatology 2008;47:592-595.
4. Calvaruso V, Cammà C, Di Marco V, Maimone S, Bronte F, Enea M, et al. Fibrosis staging in chronic hepatitis C: analysis of discordance between transient elastography and liver biopsy. J Viral Hepat 2010;17:469-474.
5. Tsochatzis EA, Gurusamy KS, Ntaoula S, Cholongitas E, Davidson BR, Burroughs AK. Elastography for the diagnosis of severity of fibrosis in chronic liver disease: a meta-analysis of diagnostic accuracy. J Hepatol 2011;54:650-659.
6. Markkola AT, Aronen HJ, Paavonen T, Hopsu E, Sipilä LM, Tanttu JI, et al. Spin lock and magnetization transfer imaging of head and neck tumors. Radiology 1996;200:369-375.
Figures