1751
Liver injury monitoring, fibrosis staging and inflammatory grading with T1rho MR imaging: an experimental study in rats with carbon tetrachloride intoxication1Tianjin First Center Hospital, Tianjin, China, 2Clinical Science, Philips Healthcare, Beijing, China
Synopsis
In this article, we investigate the value of T1rho MRI in monitoring CCl4-induced liver injury, staging liver fibrosis and grading inflammation activity in a rat model. Forty-one model rats underwent black blood T1rho MRI in multiple time points, and eleven normal rats selected as control group. Liver T1rho values were measured in different time points and compared between different fibrosis stages and inflammation grades. Our result showed that T1rho MRI can be used to monitor CCl4-induced liver injury. Changes of liver T1rho values were the result of a combination of liver fibrosis and inflammation activity, and inflammation activity had a greater impact on liver T1rho values than fibrosis.
Purpose
To investigate liver T1rho changes as the progression and regression of CCl4-induced liver injury, and the merit of T1rho relaxation for liver fibrosis and inflammation activity evaluation in a rat model.Materials and methods
Model Rats of CCl4-induced liver fibrosis (fibrosis group: n=41; regression group: n=20) and controls (n=11) underwent black blood T1rho MRI. Injection of CCl4 was twice weekly for up to 12 weeks in fibrosis group, and up to 6 weeks in regression group. MR scanning time points were at base line and 2, 4, 6, 8, 10 and 12 weeks after CCl4 injection in fibrosis group, and baseline, 2, 4, 6 (CCl4 withdrawal), 7, 8, 10 and 12 weeks in regression group. Liver T1rho values were measured, and liver histology was also sampled at these time points. Liver T1rho values in different time points, fibrosis stages and inflammatory grades were compared.Results
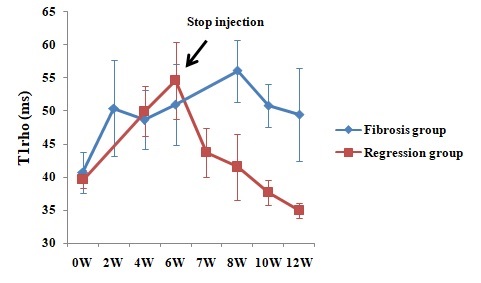
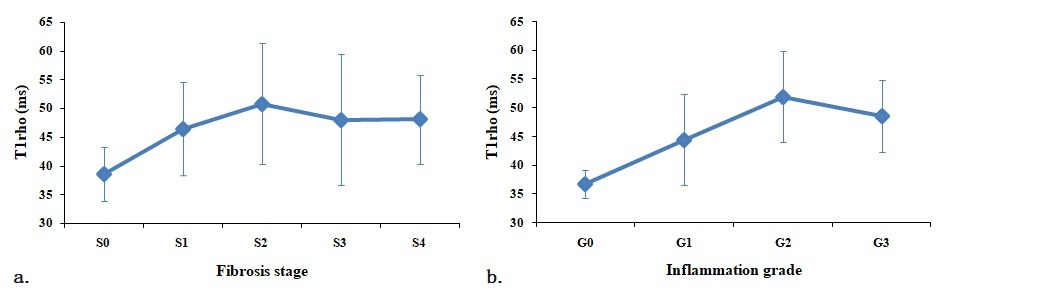
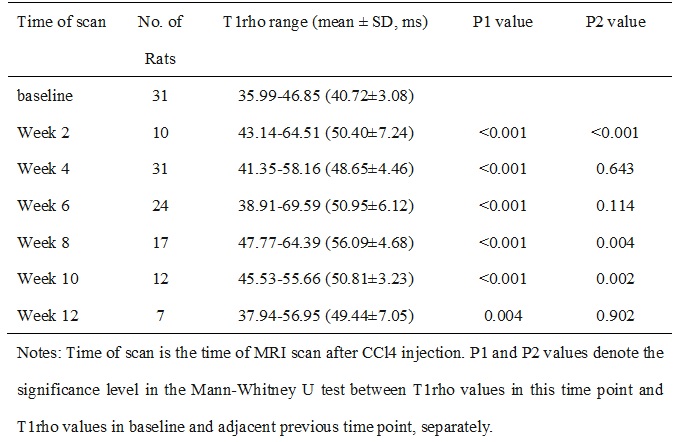
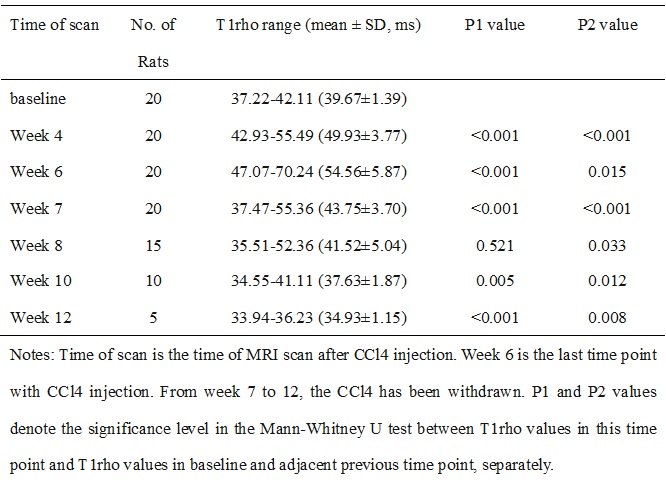
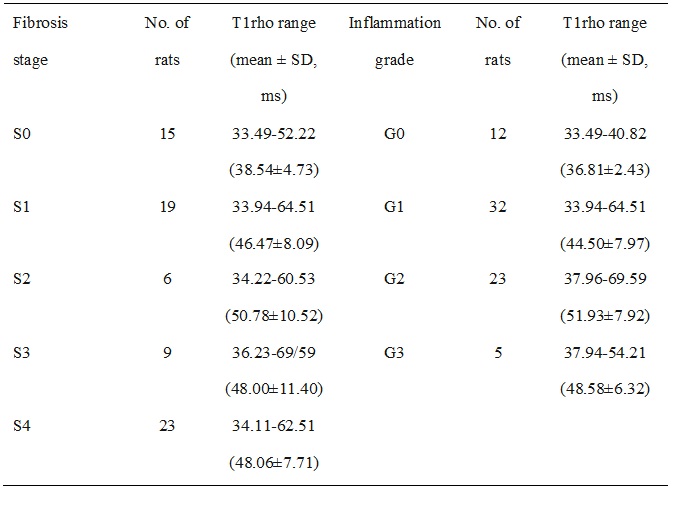
Liver T1rho values tended to increase with the increase of CCl4 injection duration within week 8, and then decreased. Liver T1rho values tended to decrease after the withdrawal of CCl4, dropped to baseline after two weeks, and then fell below baseline (Figure 1; Table 1, 2). Liver T1rho values of S0 was significantly lower than that of any other stage (all P<0.05, Table 3), and there was a low correlation between fibrosis stages and T1rho values (r=0.362, P=0.002, Figure 2a, 3). Liver T1rho values of G0 was significantly lower than that of any other inflammation grade, and G1 was lower than G2 (all P<0.01, Table 3). There was a moderate correlation between inflammation grades and T1rho values (r=0.568, P<0.001, Figure 2b). Liver T1rho values of rats with same inflammation grades showed no difference among different fibrosis stages, and only liver T1rho values of S3 showed significant difference among different inflammation grades (P=0.024). When taking inflammation grade as control variable, there was no significant correlation between liver T1rho values and fibrosis stages (r=-0.086, P=0.476). When taking fibrosis stage as control variable, there still has a moderate correlation between liver T1rho values and inflammation grades (r=0.447, P<0.001). At multiple regression analysis, inflammation grade was an independent variable associated with liver T1rho values (P<0.001).Discussion and Conclusion
Our results showed that liver T1rho values increased gradually after the injection of CCl4 and decreased gradually after withdraw of CCl4 injection. These findings highlight the potential value of T1rho for monitoring liver injury in CCl4-induced fibrosis model, as has been indicated in previous studies [1-2]. When liver T1rho values between different fibrosis stages and inflammation grades were compared seperately, liver T1rho values showed significant differences between different fibrosis stages and inflammation grades, and correlated with fibrosis stages and inflammation grades. However, when we take fibrosis stages or inflammation grades as a control variety, liver T1rho values only correlated with inflammation grades. And multiple regression analysis showed inflammation grade was an independent variable associated with liver T1rho values. So, changes of liver T1rho values were the result of a combination of liver fibrosis and inflammation activity, and inflammation activity had a greater impact on liver T1rho values than fibrosis.Acknowledgements
NoReferences
1. Sepponen RE, Pohjonen JA, Sipponen JT, Tanttu JI. A method for T1 rho imaging. J Comput Assist Tomogr, 1985;9(6):1007-1011.
2. Xie Y, Zhang H, Jin C, Wang X, Chen J, Xu Y. Gd-EOB-DTPA-enhanced T1ρ imaging vs diffusion metrics for assessment liver inflammation and early stage fibrosis of nonalcoholic steatohepatitis in rabbits. Magn Reson Imaging, 2018, 48:34-41.
Figures