1750
New MRI Method for the Detection of Liver Fibrosis: Validation and Staging1Radiology, Washington University in St. Louis, Saint Louis, MO, United States, 2Kunming Biomed International, Kunming, China
Synopsis
The purpose of this study was to develop a MR imaging markers for quantitative assessment of liver fibrosis and validate the method. Both normal monkeys and monkeys with non-alcoholic steatohepatitis were used for the validation study compared to histopathology of liver biopsy specimens. Liver extracellular volume was quantified and correlated strongly with biopsy fibrosis scores.
Objective
Liver fibrosis is a hallmark of chronic liver disease, including non-alcoholic fatty liver disease (NAFLD), non-alcoholic steatohepatitis (NASH), and cirrhosis. It is characterized by an excessive accumulation of extracellular matrix (collagen, fibronectin, etc). Accurate diagnosis and staging are essential for proper medical treatments and interventions. Liver biopsy is the reference method for the detection of liver fibrosis, but it is invasive and subject to relatively high sampling errors. A non-invasive MRI quantification method for liver fibrosis was thus developed and validated in this study, using a monkey model of NASH.Methods
Seven (7) normal and eleven (11) monkeys with NASH were used in this validation study. The monkeys were scanned supine in a 1.5 T Siemens Aeria system (Siemens Medical Solutions, Malvern, PA), after anesthesia and intubation. The MRI protocol includes scout imaging and pre-contrast and post-contrast T1 mapping (10 min after the contrast injection) using the cardiac MR MOLLI T1 mapping sequences. The basic imaging parameters for T1 mapping were: TR/TE = 2.8/1.4 msec, field-of-view = 200 x 175 mm2, matrix = 176 x 154 (interpolated), slice thickness = 5 mm, acquisition time for each slice = 22 - 24 sec. Typically, 4-6 slices were obtained to cover the entire liver. A single dose of 0.1 mmol/kg Magnevist (Bayer HealthCare, Whippany, NJ) was injected for post-contrast imaging. The biopsies of both normal and NASH monkeys were performed within 8 weeks of the MRI scans. The histopathology (Sirius red stain) of the tissue was reviewed and scored for fibrosis (score from 1 to 4) independently by a pathologist, who was blind to MRI results. The MRI analysis was performed by another reviewer who was blind to biopsy results. Liver extracellular volume (LECV), as an imaging marker for fibrosis, was calculated by following equation, on a pixel-by-pixel basis:
$$LECV=(1-HCT)\frac{\frac{1}{T1_{post-liver}}-\frac{1}{T1_{pre-liver}}}{\frac{1}{T1_{post-blood}}-\frac{1}{T1_{pre-blood}}}$$
Where HCT is the hematocrit that was determined by blood sampling. The LECV measurements were performed by a region-of-interest on the LECV maps at the approximately same locations of biopsies.
Results
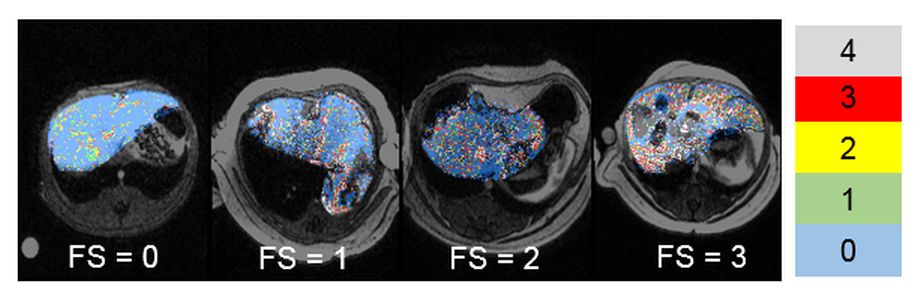
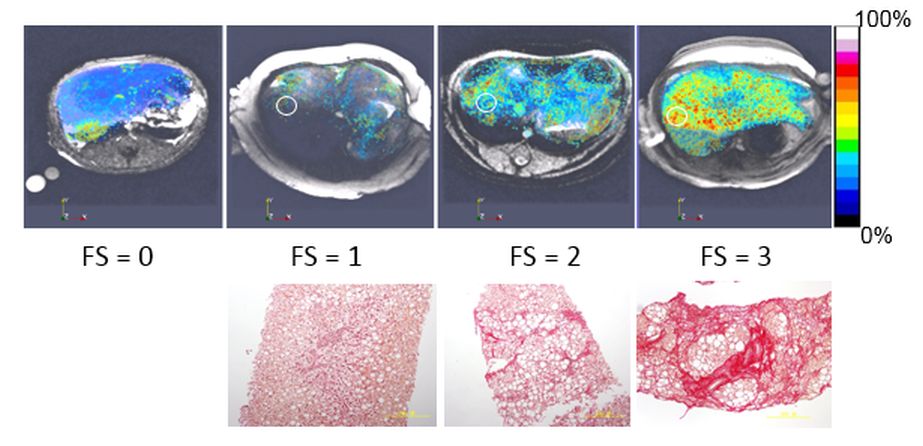
There was a strong correlation (R2 = 0.8) between histopathologic fibrosis scores and LECV (Figure 1). The difference in LECV between normal and HASH monkeys was highly significant (Figure 2). Figure 3 shows LECV maps overlaid on anatomical images for monkeys with different fibrosis scores and related histopathology. Based on the correlation in Figure 1, a virtual fibrosis score map can be developed to show the distribution of fibrosis in the liver (Figure 4).Conclusions
The new quantitative fibrosis imaging marker LECV was validated against reference biopsy fibrosis scores. Noninvasive imaging of liver fibrosis and staging will accelerate drug development in preclinical studies and facilitate diagnosis and treatment planning for patients with chronic liver diseases.Acknowledgements
No acknowledgement found.References
No reference found.Figures
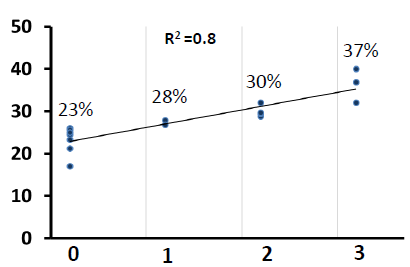
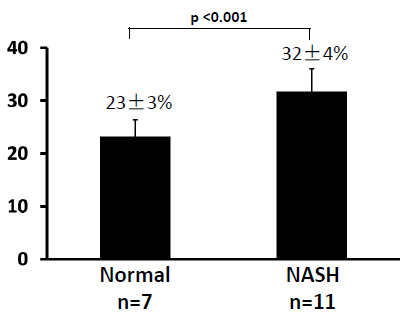
Figure 2 Significantly increased LECV in NASH monkeys