1748
Non-invasive assessment of portal hypertension using magnetic resonance elastography and ultrasound shear wave elastography of the liver and spleen.1Translational and Molecular Imaging Institute, Icahn School of Medicine at Mount Sinai, New York, NY, United States, 2Department of Radiology, Icahn School of Medicine at Mount Sinai, New York, NY, United States, 3Department of Medicine, Icahn School of Medicine at Mount Sinai, New York, NY, United States, 4Department of Pathology, Icahn School of Medicine at Mount Sinai, New York, NY, United States, 5Department of Interventional Radiology, Icahn School of Medicine at Mount Sinai, New York, NY, United States
Synopsis
The aim of this ongoing prospective study is to investigate the utility of both 2D and 3D MR elastography (MRE) and ultrasound shear wave elastography (SWE) for the assessment of portal hypertension in patients with chronic liver disease. Initial results indicate that 3D MRE measured spleen stiffness and the spleen to liver stiffness ratio measured with 3D MRE and SWE significantly correlate with hepatic venous pressure gradient measurement. This suggests that 3D MRE is sensitive to physiological changes associated with portal hypertension. Confirmation in a larger patient cohort may validate 3D MRE as a non-invasive surrogate for portal pressure measurement.
Purpose
Portal hypertension (PH) is a complication of liver cirrhosis which manifests as an abnormal increase in portal pressure. PH is associated with ascites and esophageal varices1,2. Invasive measurement of the hepatic venous pressure gradient (HVPG) stratifies patients into no PH (HVPG<5 mmHg), PH (HVPG≥5 mmHg) and clinically significant (CS)PH (HVPG≥10 mmHg). In this study we assess the association between liver and spleen stiffness measured with MRE and ultrasound shear wave elastography (SWE) methods and HVPG measurement.Methods
In this prospective IRB approved study, 13 initial patients (M/F: 8/5, mean age 56.7y) with chronic liver disease and suspicion of PH underwent MRI at 1.5T (Siemens Aera, n=13) and in 2 cases additional same-day 3.0T (GE Discovery 750w) MRI within 1 month of HVPG measurement and liver biopsy. SWE of the liver and spleen was performed on the same day as MRI (Siemens Acuson S3000). 2D MRE was performed at 1.5T in all cases using a SE-EPI sequence at 60 Hz with 10 axial slices, dual passive drivers enabling simultaneous liver and spleen acquisition and an inline reconstruction3. 3D MRE was performed in 8/12 patients at 60 Hz at 1.5T (n=6) or 3T (n=2). On both systems, 3D MRE liver and spleen data were acquired simultaneously using a SE-EPI sequence over 32 axial slices. 3D MRE data were reconstructed using a previously described 3D inversion4 (GE) or a 3D implementation of the current 2D MRE inversion algorithm3 (Siemens). For 2D and 3D MRE, liver and spleen ROIs were prescribed using ImageJ software in areas of sufficient wave propagation inside the confidence map, avoiding blood vessels and other structures and staying 1cm away from the organ boundaries. The ratio of spleen to liver stiffness was also determined5. For SWE, 5 valid measurements (indicated by an interquartile range≤ 30% of median value) were acquired in the liver and spleen with the median value recorded. Association between MRE, SWE and HVPG measurements were determined using Spearman correlations.Results
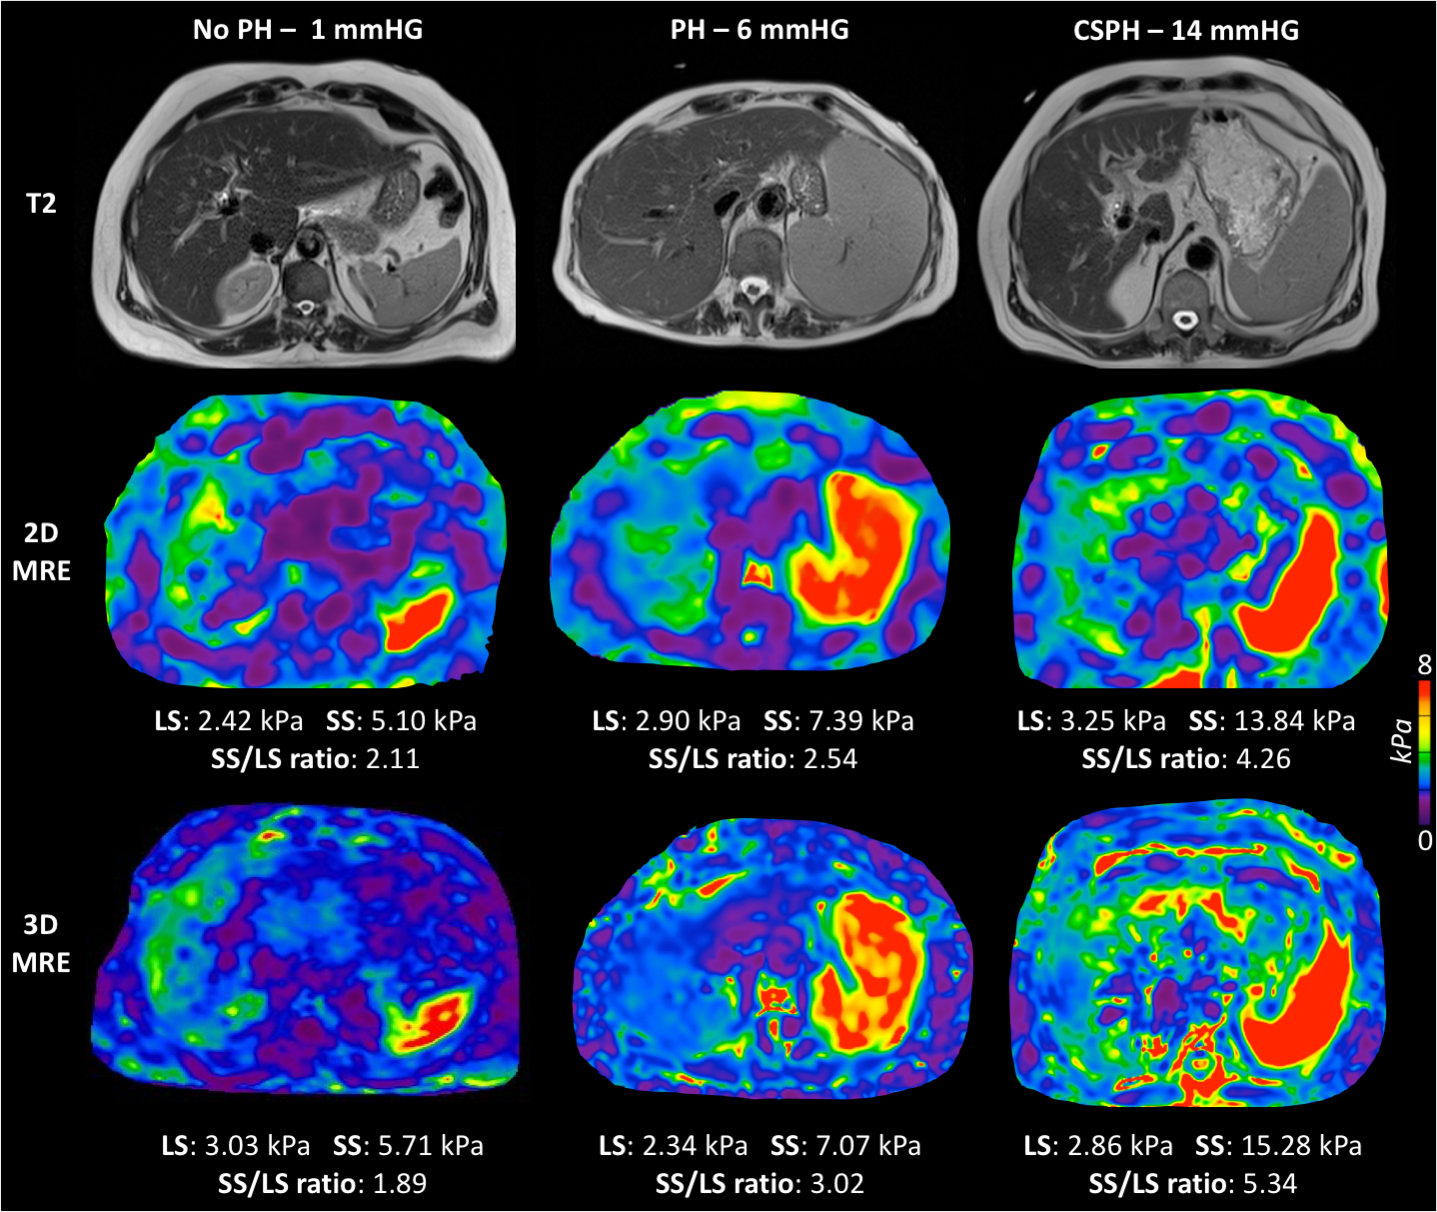
Biopsy revealed 10/13 patients were cirrhotic, with the remaining 3 patients classified as F0, F1 and F3. Mean HVPG was 7.5±5.4 mmHg (range 0-14 mmHg). 4 patients were classified as having no PH and 9 had HVPG≥5 mmHg, including 4 with CSPH. MRE elastograms from a normal, PH and CSPH patient are shown in Figure 1. 2D MRE failed in one patient and one patient declined to undergo SWE following MRI. 3D MRE was successful in all patients.
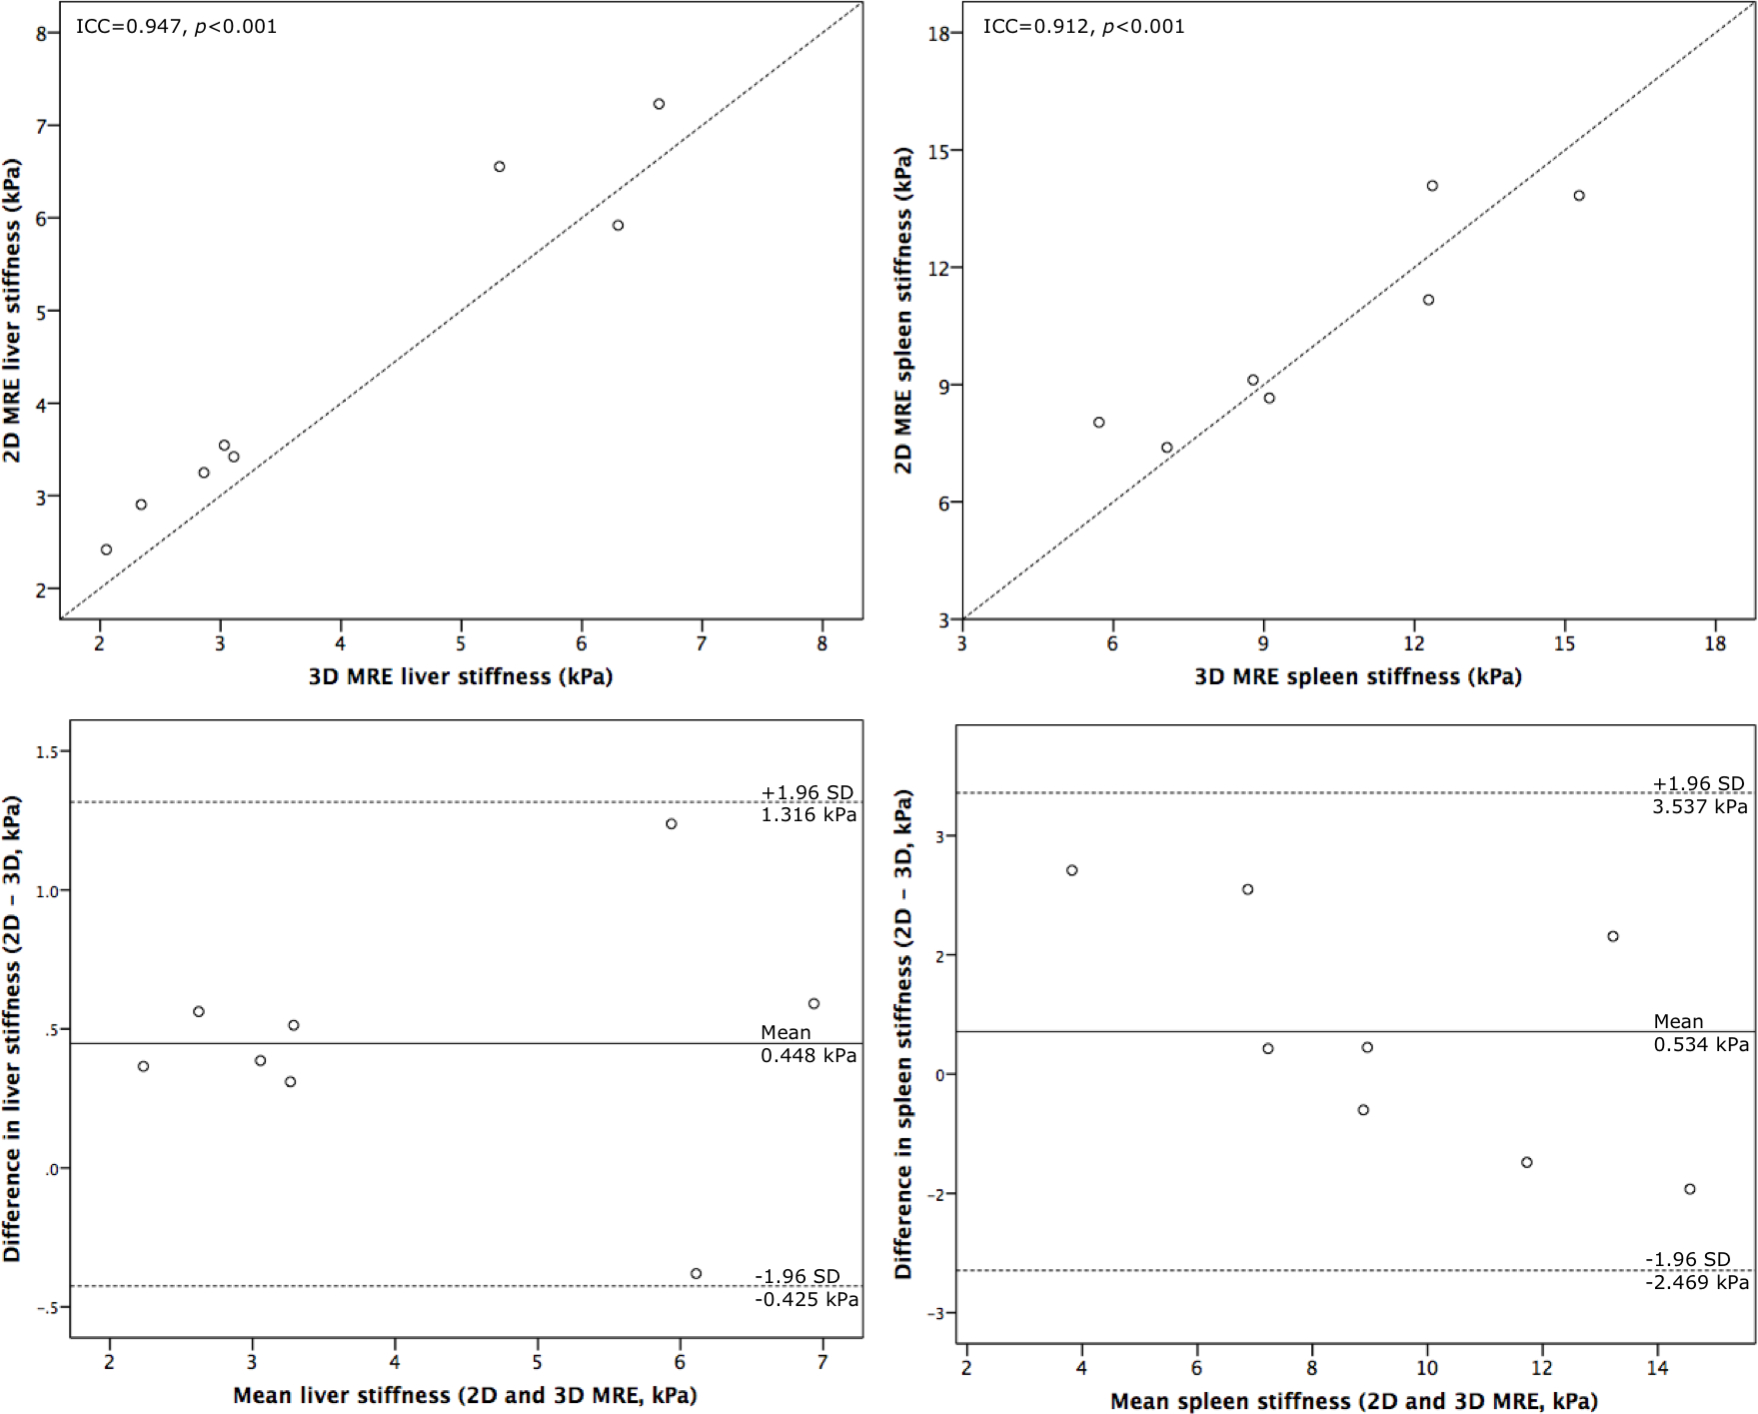
2D and 3D MRE liver and spleen stiffness were in good agreement (ICC=0.947, p<0.001 and ICC=0.912, p<0.001 respectively). Bland Altman analysis reveals that 2D MRE produced higher stiffness measures than 3D MRE in the liver but that spleen measurements were more variable (Figure 2). SWE measures did not correlate with 2D or 3D MRE.
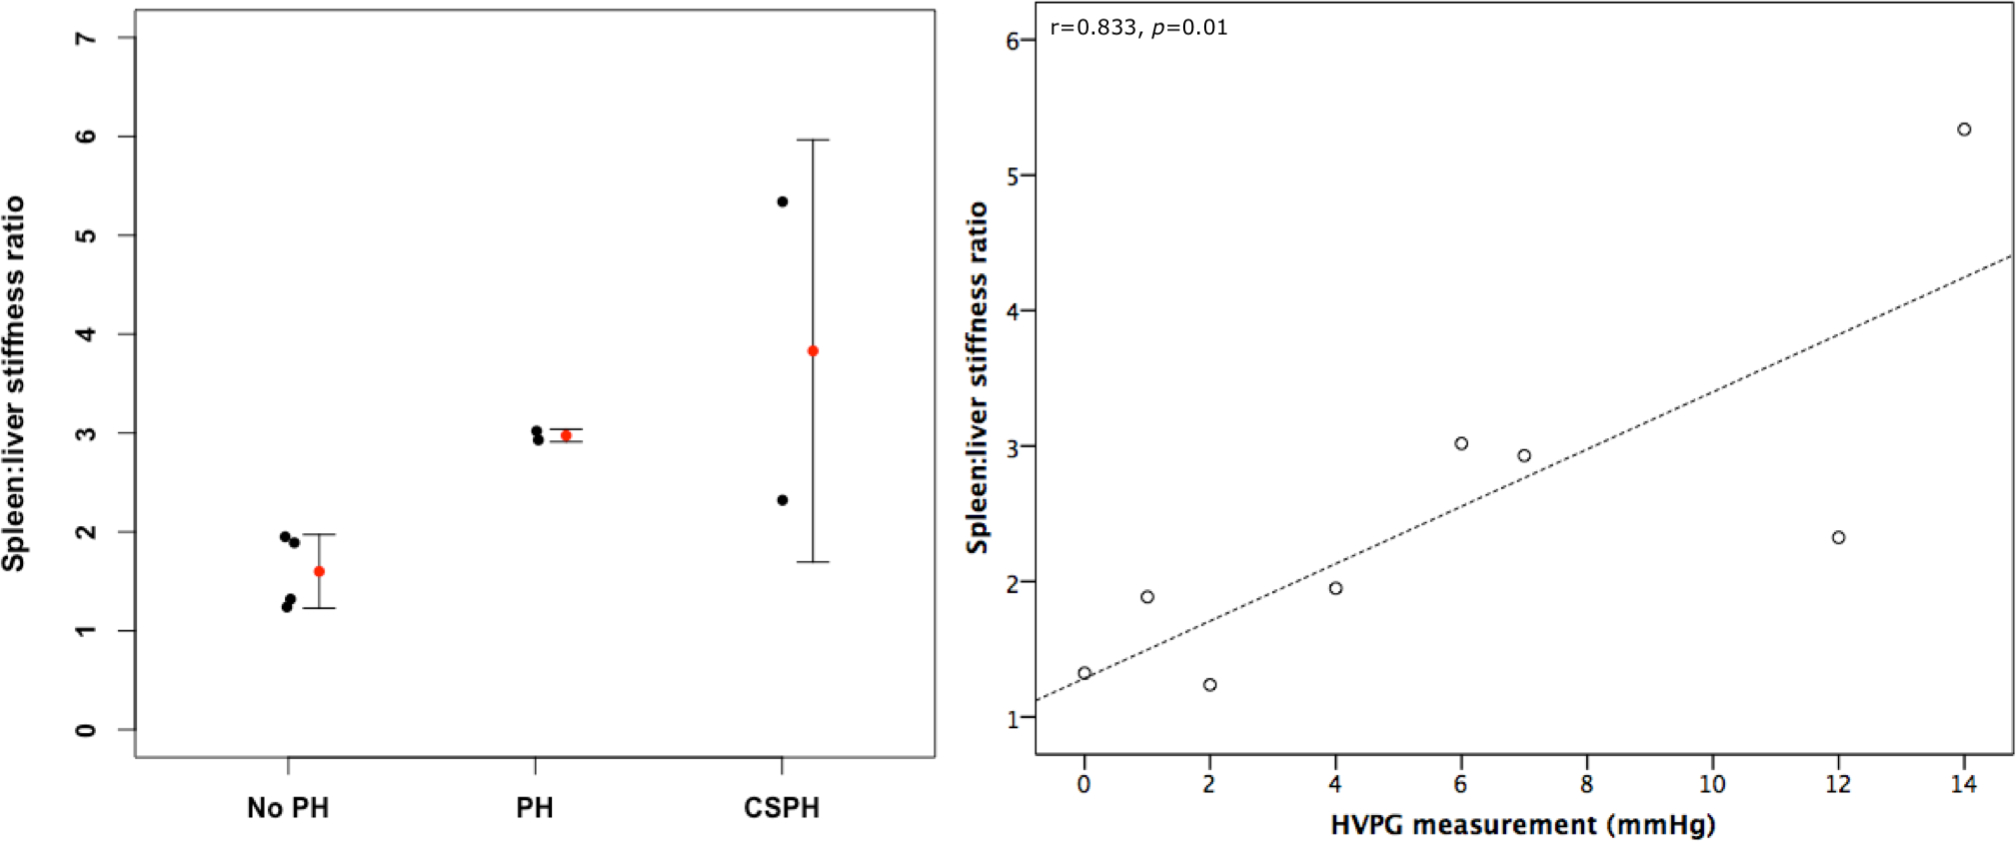
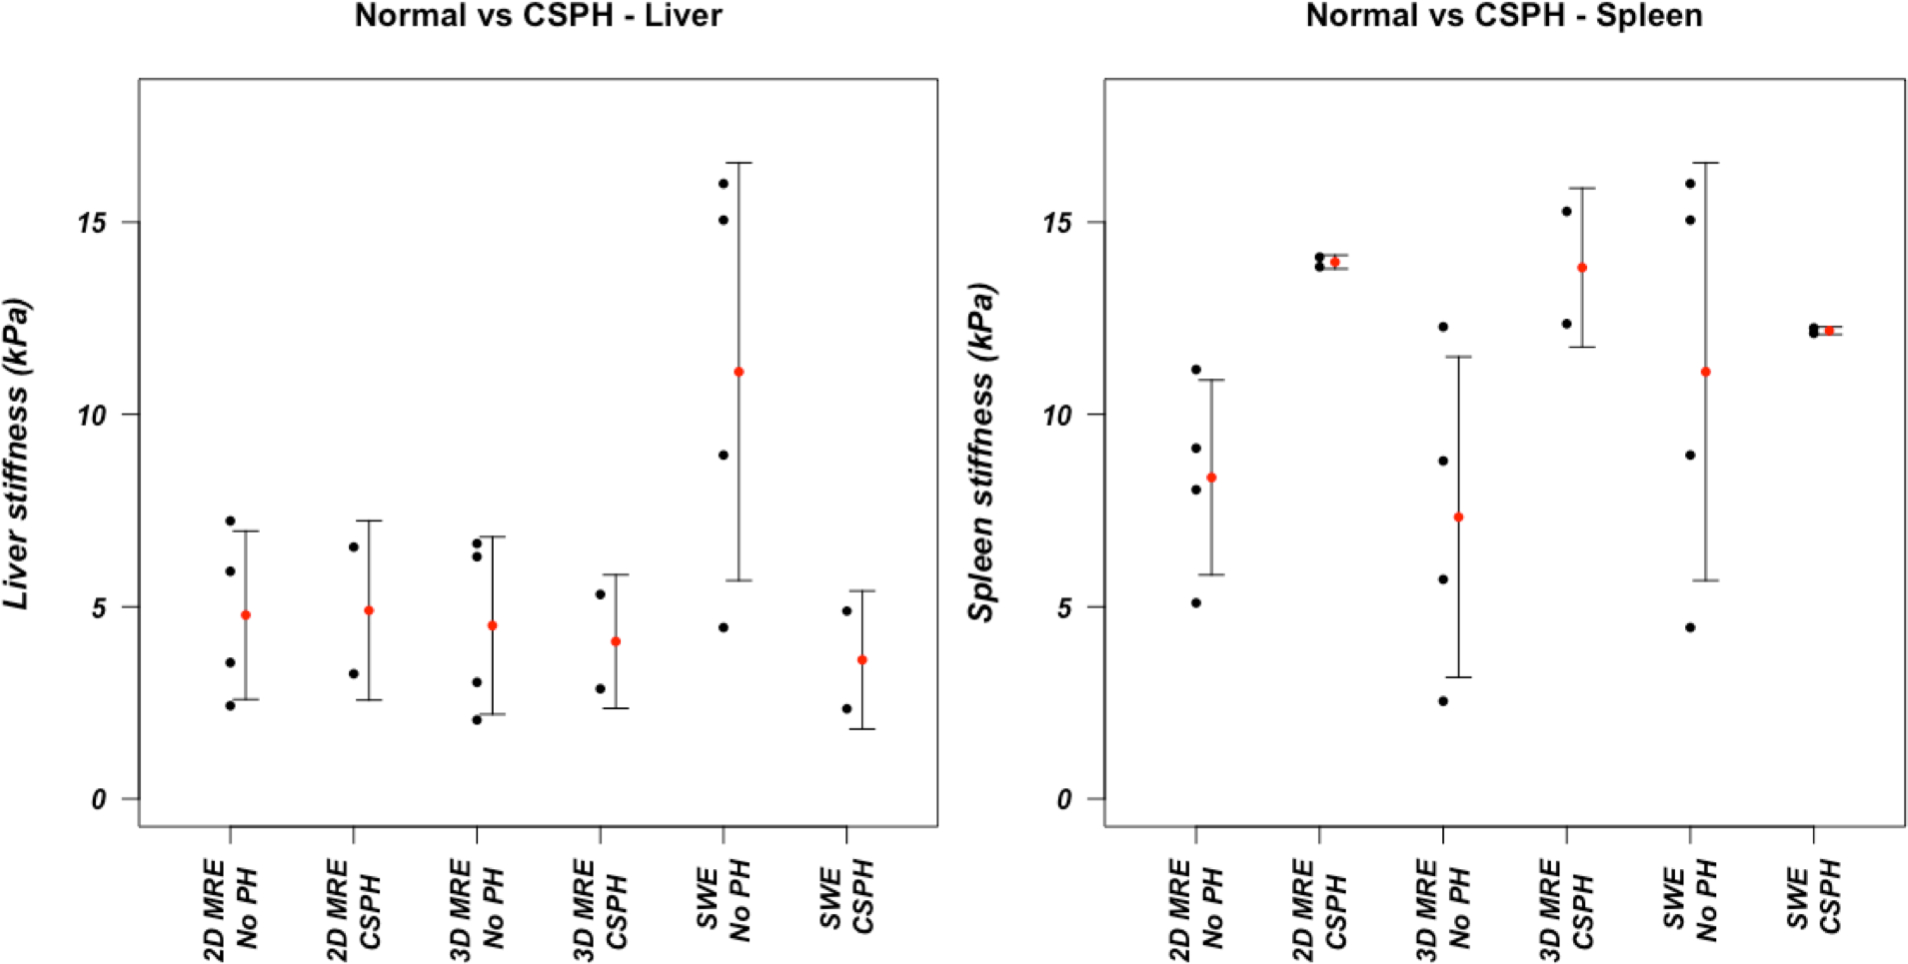
2D MRE, 3D MRE and SWE liver stiffness did not correlate with HVPG. 2D MRE and SWE spleen stiffness also did not correlate with HVPG however 3D MRE spleen stiffness was significantly correlated with HVPG (r=0.738, p=0.037). Spleen to liver stiffness ratio of 3D MRE and SWE were both significantly correlated with HVPG (r=0.833, p=0.010; Figure 3 and r=0.598, p=0.031 respectively). Mean 2D and 3D MRE spleen stiffness was greater in patients with CSPH than those with HVPG<5 mmHg, however the difference was not significant (Figure 4).
Discussion
Preliminary results from this ongoing study suggest that 3D MRE of the spleen is more sensitive to the hemodynamic changes associated with PH than 2D MRE. 3D MRE spleen to liver stiffness ratio was found to have the strongest correlation with HVPG measurement indicating that spleen stiffness is increased more than liver stiffness in PH. 3D MRE spleen stiffness was also found to significantly correlate with HVPG. Our results agree with a recently published paper6 where 2D MRE spleen stiffness did not correlate with HVPG. However, in that study liver stiffness was found to correlate with HVPG. We did not see this correlation in our preliminary results though the current small patient cohort may be a factor. A previous study utilizing 3D MRE found that spleen MRE parameters correlated with HVPG, agreeing with our current findings7.Conclusion
3D MRE is a promising method for non-invasive assessment of portal hypertension. Spleen to liver stiffness ratio appears to be a useful surrogate for invasive HVPG determination. Recruitment is still ongoing in this prospective study and the initial results presented here will be validated in a larger cohort.Acknowledgements
This study was supported by NIDDK grant 1R01DK113272.References
- de Franchis R. Expanding consensus in portal hypertension: Report of the Baveno VI Consensus Workshop: Stratifying risk and individualizing care for portal hypertension. J Hepatol. 2015;63(3):743-752.
- Morali GA, Sniderman KW, Deitel KI, et al. Is sinusoidal portal hypertension a necessary factor for the development of hepatic ascites? J Hepatol. 1992;16(1):249-250.
- Dzyubak B, Glaser K, Yin M, et al. Automated Liver Stiffness Measurements with Magnetic Resonance Elastography. J Magn Reson Imaging JMRI. 2013;38(2):371-379.
- Shi Y, Glaser KJ, Sudhakar VK, Ben-Abraham EI, Ehman RL. Feasibility of Using 3D MR Elastography to Determine Pancreatic Stiffness in Healthy Volunteers. J Magn Reson Imaging JMRI. 2015;41(2):369-375.
- Grgurevic I, Puljiz Z, Brnic D, et al. Liver and spleen stiffness and their ratio assessed by real-time two dimensional-shear wave elastography in patients with liver fibrosis and cirrhosis due to chronic viral hepatitis. Eur Radiol. 2015;25(11):3214-3221.
- Wagner M, Hectors S, Bane O, et al. Noninvasive prediction of portal pressure with MR elastography and DCE-MRI of the liver and spleen: Preliminary results. J Magn Reson Imaging. 2018;48(4):1091-1103.
- Ronot M, Lambert S, Elkrief L, et al. Assessment of portal hypertension and high-risk oesophageal varices with liver and spleen three-dimensional multifrequency MR elastography in liver cirrhosis. Eur Radiol. 2014;24(6):1394-1402.
Figures