1747
A Promising Procedure for the Staging of Liver Fibrosis Using Hepatocyte Fraction1Philips Healthcare, Shanghai, China, 2Shanghai Public Health Clinical Center Affiliated to Fudan University, Shanghai, China, 3Philips Healthcare, Seoul, Korea, Republic of
Synopsis
Liver biopsy is an invasive and painful procedure for staging liver fibrosis. This study aimed to evaluate a new procedure by injecting a hepatobiliary-specific contrast agent Gadolinium
INTRODUCTION
The hepatocyte fraction (HeF) approach can estimate the HeF and the uptake function based on a simple pharmacokinetic model and ΔR1 values using Gd-EOB-DTPA (1), which is a hepatobiliary-specific contrast agent and has been proposed to evaluate the fibrosis, and liver function and quantify differences in hepatic uptake (2). The present study aimed to evaluate a procedure for the staging of liver fibrosis noninvasively.METHODS
This prospective study was approved by the local ethics committee, and written informed consent was obtained from each participant. Patients According to the liver puncture pathological biopsy, 110 patients with chronic hepatitis B were categorized into the following 4 groups: S1 (N = 26), S2 (N = 24), S3 (N = 25), and S4 (N = 35). Data acquisition All examinations were acquired on a 3.0T magnetic resonance scanner (Ingenia, Philips Healthcare, Best,the Netherlands) with a built-in posterior coil and an anterior Torso coils. The study protocol of the fat-saturated T1-weighted gradient echo sequence had the following scan parameters: T1-TFE, TE/TR=1.7/7 ms, FA=7°, 1.37×1.37mm×8mm, single slices, shot interval=5 sec, SENSE factor=2 and 15-sec scan duration with breath holding. The sequence was performed twice before and 20 mins after the Gd-EOB-DTPA was injected into the patients. Image analysis The HeF was defined and calculated based on the two-compartment pharmacokinetic model (1),
HeF = ∆R1Hepatobiliary*100/ΔR1EES
Four regions of interest (ROIs) were carefully placed on the imaging section to eliminate unreliable and poorly fitted values from blood vessel contamination and respiration-related artifacts. The mean of the four ROIs represented the result. Statistics The group means of HeF values representing different fibrosis stages in the patients were compared using the one-way analysis of variance.
RESULTS
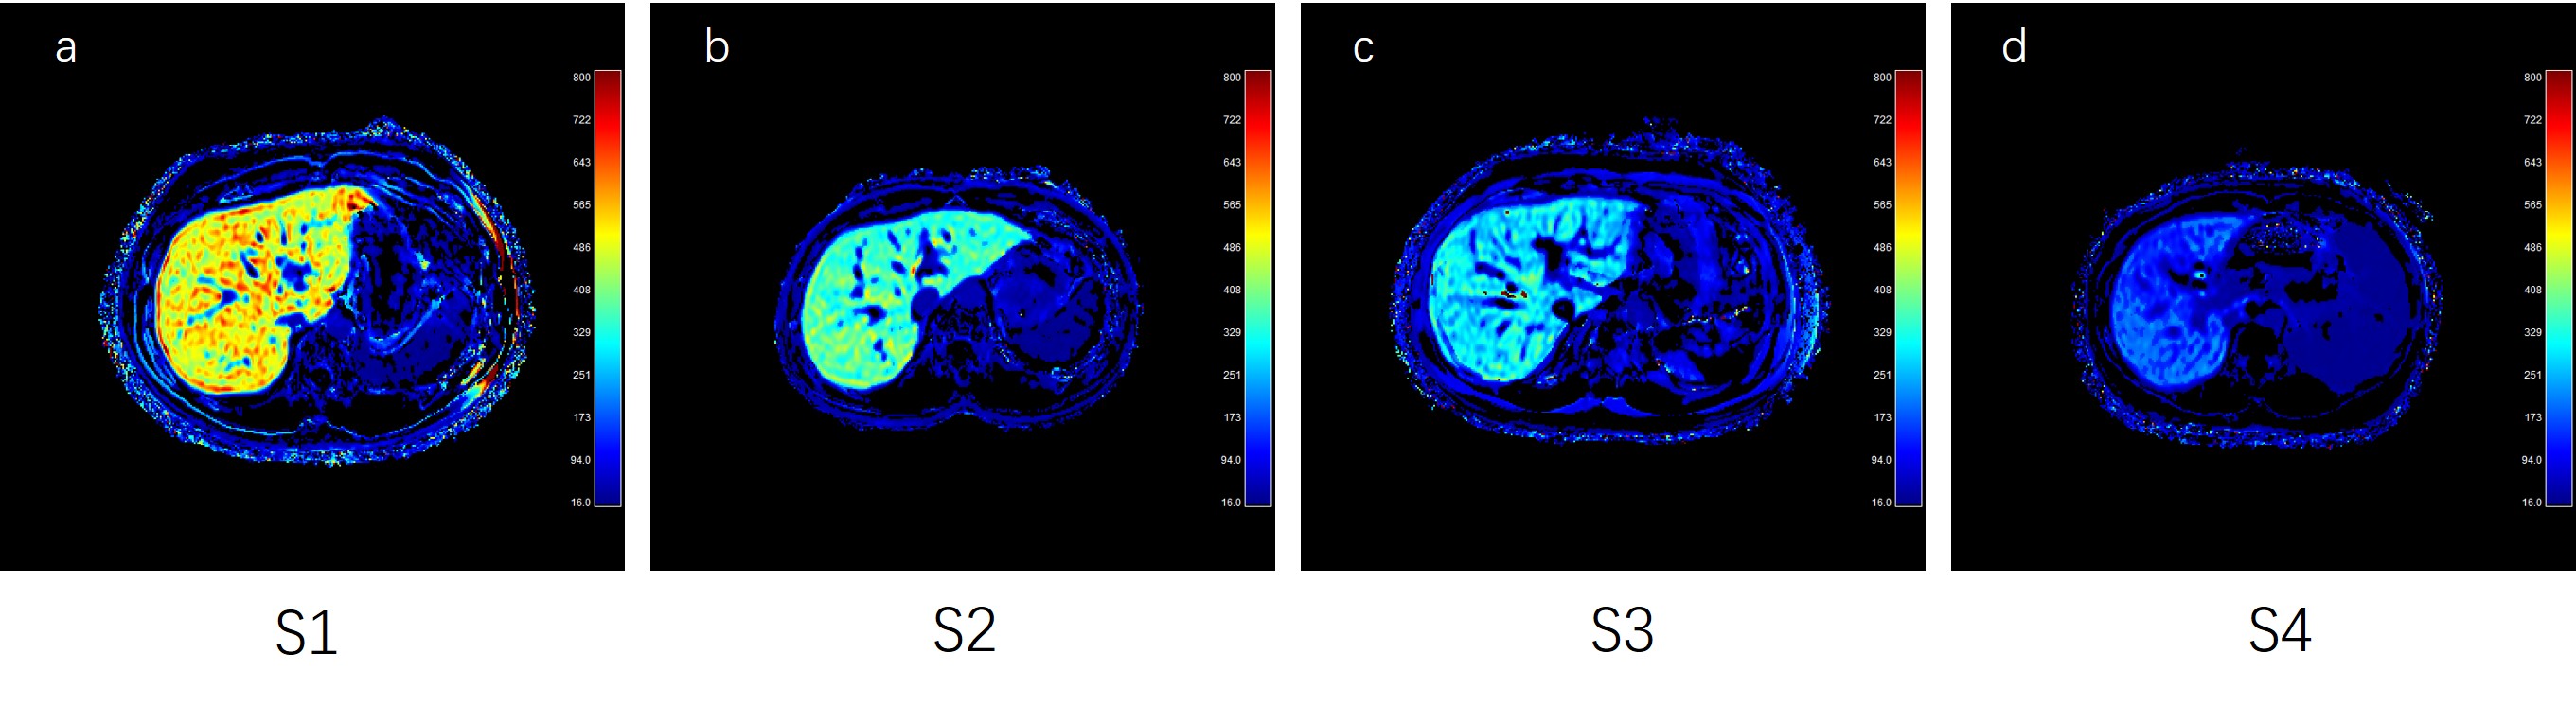
The mean HeF values of the four different stages was 435.5, 355.9, 250.1 and 160 respectively. The values decreased as the liver fibrosis stages increased, as shown in Figure 1. Significant differences were found between S1 and S3 (P<0.001), and S4 (P<0.001); between S2 and S3 (P=0.029), and S4 (P<0.001); and S3 and S4 patients (P=0.0366). No significant difference was found between S1 and S2 patients. The HeF mapping of four patients’ different at liver fibrosis stages is shown in Figure 2.DISCUSSION
This study evaluated the quantification of hepatocyte-specific contrast agent kinetics using a two-compartment pharmacokinetic model. The feasibility of HeF mapping to stage the fibrotic liver disease in human participants was evaluated using histopathological findings as a reference standard. The liver fibrosis stage strongly influenced the uptake of Gd-EOB-DTPA in this study. The HeF indicated the estimation of existing hepatocytes. Gd-EOB-DTPA diffused into the blood and extracellular space after injection. The decrease in HeF along with an increase in the liver fibrosis stage indicated the replacement of hepatocytes by fibrous tissue, yielding a concentration reduction in the contrast agent. However, the hepatocyte is relevant to the transporter (organic anion transport polypeptide or OATP1). Liver fibrosis led to a decrease in the expression of the OATP1 on the liver cell membrane, which in turn reduced the uptake. The more the deposition of fibrous tissue in the extracellular space, the less number of hepatocytes entering the unit cell. However, the present study had some limitations. A slice with limited imaging coverage was acquired only once for each participant. Hence, an overall distribution of the liver fibrosis can not be assessed.CONCLUSION
HeF may be as a promising procedure for the noninvasive staging of liver fibrosis.Acknowledgements
No acknowledgement found.References
1. Dahlqvist Leinhard O,Dahlström N,Kihlberg J et al. Quantifying differences in hepatic uptake of the liver specific contrast agents Gd-EOB-DTPA and Gd-BOPTA: a pilot study.[J] .Eur Radiol, 2012, 22: 642-53.
2. Ringe Kristina I., Husarik Daniela B., Sirlin Claude B., Merkle Elmar M., (2010). Gadoxetate disodium-enhanced MRI of the liver: part 1, protocol optimization and lesion appearance in the noncirrhotic liver., AJR Am J Roentgenol, 195, 13-28.
Figures