1745
Gadoxetic acid-enhanced perfusion quantification in the liver and spleen in portal hypertension1Translational and Molecular Imaging Institute, Icahn School of Medicine at Mount Sinai, New York, NY, United States, 2Department of Radiology, Icahn School of Medicine at Mount Sinai, New York, NY, United States, 3Department of Medicine, Icahn School of Medicine at Mount Sinai, New York, NY, United States, 4Department of Pathology, Icahn School of Medicine at Mount Sinai, New York, NY, United States, 5Department of Interventional Radiology, Icahn School of Medicine at Mount Sinai, New York, NY, United States
Synopsis
The goal of our study was to assess the potential value of perfusion quantification using DCE-MRI with gadoxetic acid in the liver and spleen for noninvasive assessment of portal hypertension (PH). We found that the liver uptake fraction was significantly negatively correlated with hepatic venous pressure gradient measurements. We conclude that liver perfusion quantification is promising for noninvasive assessment of PH. After validation of these findings in a larger cohort of patients, DCE-MRI may potentially decrease the need of invasive portal pressure measurements.
Introduction
Portal hypertension (PH) is a common complication of liver cirrhosis. PH is diagnosed based on hepatic venous pressure gradient (HVPG) measurement 1-3, which is invasive and not widely available. The goal of this study was to assess the potential value of perfusion quantification using DCE-MRI with gadoxetic acid in the liver and spleen for noninvasive prediction of PH.Methods
Twelve initial patients with liver disease (M/F 8/4, mean age 61y) were prospectively enrolled in this ongoing IRB-approved study. All patients underwent multiparametric MRI at 1.5T (Aera, Siemens). The DCE-MRI acquisition consisted of a fat-suppressed 3D VIBE dynamic acquisition with a temporal resolution of 4-5 s. Gadoxetic acid (Eovist, Bayer, 10 ml dose) and a 30 ml saline flush were intravenously injected at 2 ml/s at 15 s after the start of the DCE-MRI acquisition. Contrast uptake in the lesion was followed for 10 minutes with DCE-MRI. HVPG measurement and transjugular liver biopsies were performed within 1 month of the MRI. Liver DCE-MRI analysis was performed using a dual-input dual compartment model 4, while a single-input single compartment model was used for spleen DCE-MRI analysis. The following DCE-MRI parameters were quantified in the liver: arterial flow Fa, portal venous flow Fp, total flow Ft, arterial fraction ART, mean transit time MTT, interstitial volume fraction ve, intracellular uptake rate Ki, uptake fraction fi. In the spleen, parameters flow F, MTT and ve were quantified. Spearman analysis was performed to assess the correlation between DCE-MRI parameters and HVPG measurements. ROC analysis was employed to determine diagnostic performance of DCE-MRI parameters for prediction of PH.Results
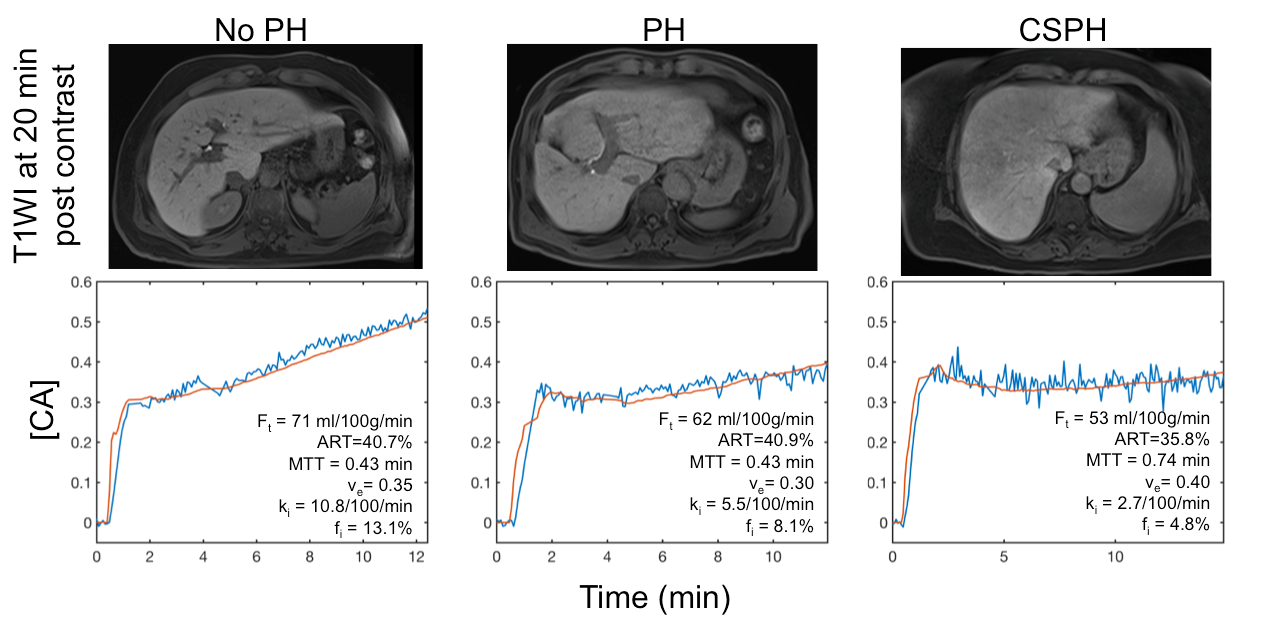
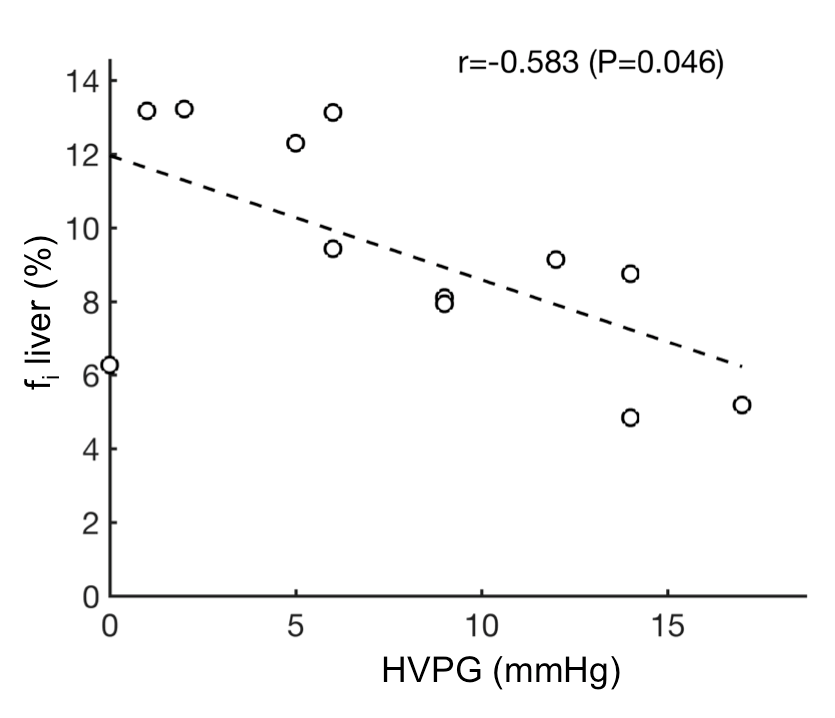
Mean HVPG was 7.9±5.5 (range 0–17) mmHg. 9 patients had PH (HVPG ≥ 5mmHg), of which 4 had clinically significant PH (CSPH, HVPG ≥ 10mmHg). Decreased hepatic uptake of contrast was observed on liver perfusion curves of patients with PH, while this was not apparent on T1-weighted VIBE images obtained at the delayed phase (20 min) post contrast (Fig. 1). While DCE-MRI flow parameters in liver and spleen did not show significant correlations with HVPG (P>0.132), the liver uptake fraction of gadoxetic acid fi in the liver was significantly negatively correlated with HVPG (r -0.583, P=0.046; Fig. 2). fi also showed the highest diagnostic performance for prediction of CSPH with an AUC of 0.813, although this AUC did not reach statistical significance (P=0.089), likely due to small sample size.Discussion
Our study follows up on a previous study, in which liver and spleen perfusion parameters using an extracellular agent did not exhibit significant association with HVPG, except for a moderate correlation with liver ve 5. In our current study we used a liver specific contrast agent gadoxetic acid to simultaneously measure liver perfusion and function 4. While we did not observe a correlation between flow parameters and HVPG in both organs, we found a significant correlation between liver uptake fraction and HVPG. Our results are in line with a previous study, in which a weak significant inverse correlation of HVPG with relative liver enhancement at the HBP post gadoxetic acid was observed 6. In our study, we observed a moderate negative correlation of HVPG with the liver uptake fraction, suggesting that quantitative DCE-MRI modeling may more accurately measure liver function than enhancement measurements from CE-MRI.Conclusion
Liver uptake fraction but not flow parameters extracted from DCE-MRI with gadoxetic acid is promising for noninvasive assessment of portal hypertension. These results need to be validated in a larger cohort of patients, which will be recruited in our ongoing study.Acknowledgements
This research was supported by NIDDK grant 1R01DK113272.References
1. Escorsell A, Garcia-Pagan JC, Bosch J. Assessment of portal hypertension in humans. Clinics in liver disease 2001;5(3):575-589.
2. Moitinho E, Escorsell A, Bandi JC, Salmeron JM, Garcia-Pagan JC, Rodes J, Bosch J. Prognostic value of early measurements of portal pressure in acute variceal bleeding. Gastroenterology 1999;117(3):626-631.
3. Ripoll C, Groszmann R, Garcia-Tsao G, Grace N, Burroughs A, Planas R, Escorsell A, Garcia-Pagan JC, Makuch R, Patch D, Matloff DS, Bosch J. Hepatic venous pressure gradient predicts clinical decompensation in patients with compensated cirrhosis. Gastroenterology 2007;133(2):481-488.
4. Sourbron S, Sommer WH, Reiser MF, Zech CJ. Combined quantification of liver perfusion and function with dynamic gadoxetic acid-enhanced MR imaging. Radiology 2012;263(3):874-883.
5. Wagner M, Hectors S, Bane O, Gordic S, Kennedy P, Besa C, Schiano TD, Thung S, Fischman A, Taouli B. Noninvasive prediction of portal pressure with MR elastography and DCE-MRI of the liver and spleen: Preliminary results. Journal of magnetic resonance imaging : JMRI 2018;48(4):1091-1103.
6. Asenbaum U, Ba-Ssalamah A, Mandorfer M, Nolz R, Furtner J, Reiberger T, Ferlitsch A, Kaczirek K, Trauner M, Peck-Radosavljevic M, Wibmer AG. Effects of Portal Hypertension on Gadoxetic Acid-Enhanced Liver Magnetic Resonance: Diagnostic and Prognostic Implications. Investigative radiology 2017;52(8):462-469.
Figures