1744
Assessment of Spin-Echo and Gradient-Echo Liver MRE in Healthy Children and Children with Suspected Fibrosis at 3 T1Radiological Sciences, University of California Los Angeles, Los Angeles, CA, United States, 2Pediatrics, University of California Los Angeles, Los Angeles, CA, United States, 3Physics and Biology in Medicine IDP, University of California Los Angeles, Los Angeles, CA, United States
Synopsis
Magnetic resonance elastography (MRE) accurately measures liver stiffness and correlates with liver histopathology. However, conventional gradient-echo (GRE) MRE sequences require multiple breath-holds. Spin-echo echo-planar-imaging (SE-EPI) MRE only requires a single breath-hold. In this study we compared 2D SE-EPI and 2D rapid-GRE MRE sequences at 3T in healthy children and children with suspected fibrosis. Both SE-EPI and rapid-GRE had good repeatability, reproducibility, inter-reader agreement, and quantitative agreement in liver stiffness. SE-EPI provided larger measurable liver ROI sizes than rapid-GRE. SE-EPI may be desirable for measuring fibrosis in children with limited or inconsistent breath-hold ability and reduce scan times.
Introduction
The gold standard for diagnosing and staging liver fibrosis is biopsy, which is invasive and limited by sampling bias1,2. Magnetic resonance elastography (MRE) non-invasively quantifies liver stiffness (in kPa), a biomarker for liver fibrosis3–5, and correlates with histopathology3–7. MRE acquisitions typically employ gradient-echo (GRE) or spin-echo echo-planar-imaging (SE-EPI) sequences7–10. Conventional GRE sequences used in clinical practice9 require multiple breath-hold acquisitions to cover multiple slices (15-22s per slice)11. On the other hand, SE-EPI sequences use a single breath-hold of approximately 10s for multiple slices7–10. Recently, a rapid-GRE sequence has been developed to reduce the breath-hold time to 10s per slice and is consistent with conventional GRE measurements in adults11. Children may have more difficulty performing multiple breath-holds and maintaining consistent breath-holds, which may hinder the image quality and limit the area in the liver with sufficient numerical confidence for measuring stiffness3. Therefore, SE-EPI MRE may be a desirable technique for evaluating liver stiffness in children. In this work, we compared 2D rapid-GRE and 2D SE-EPI MRE in healthy children and children with suspected fibrosis at 3T.Methods
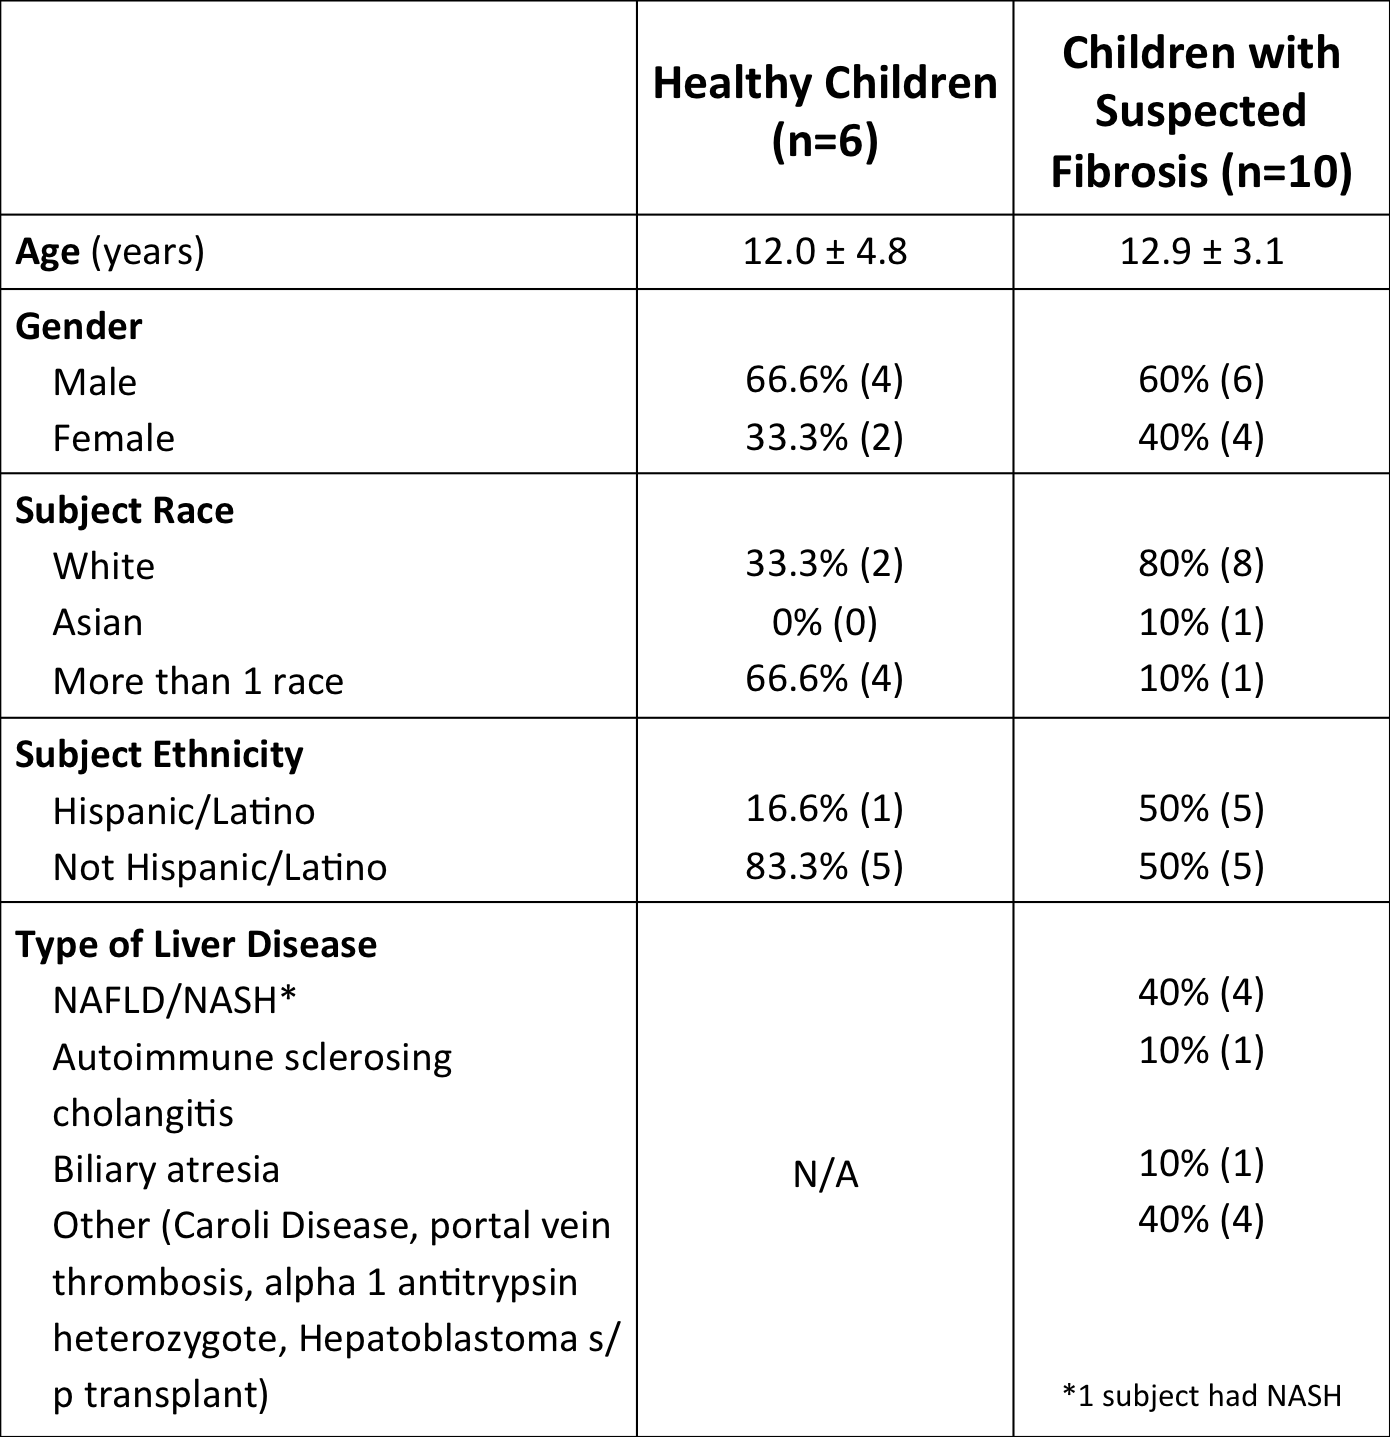
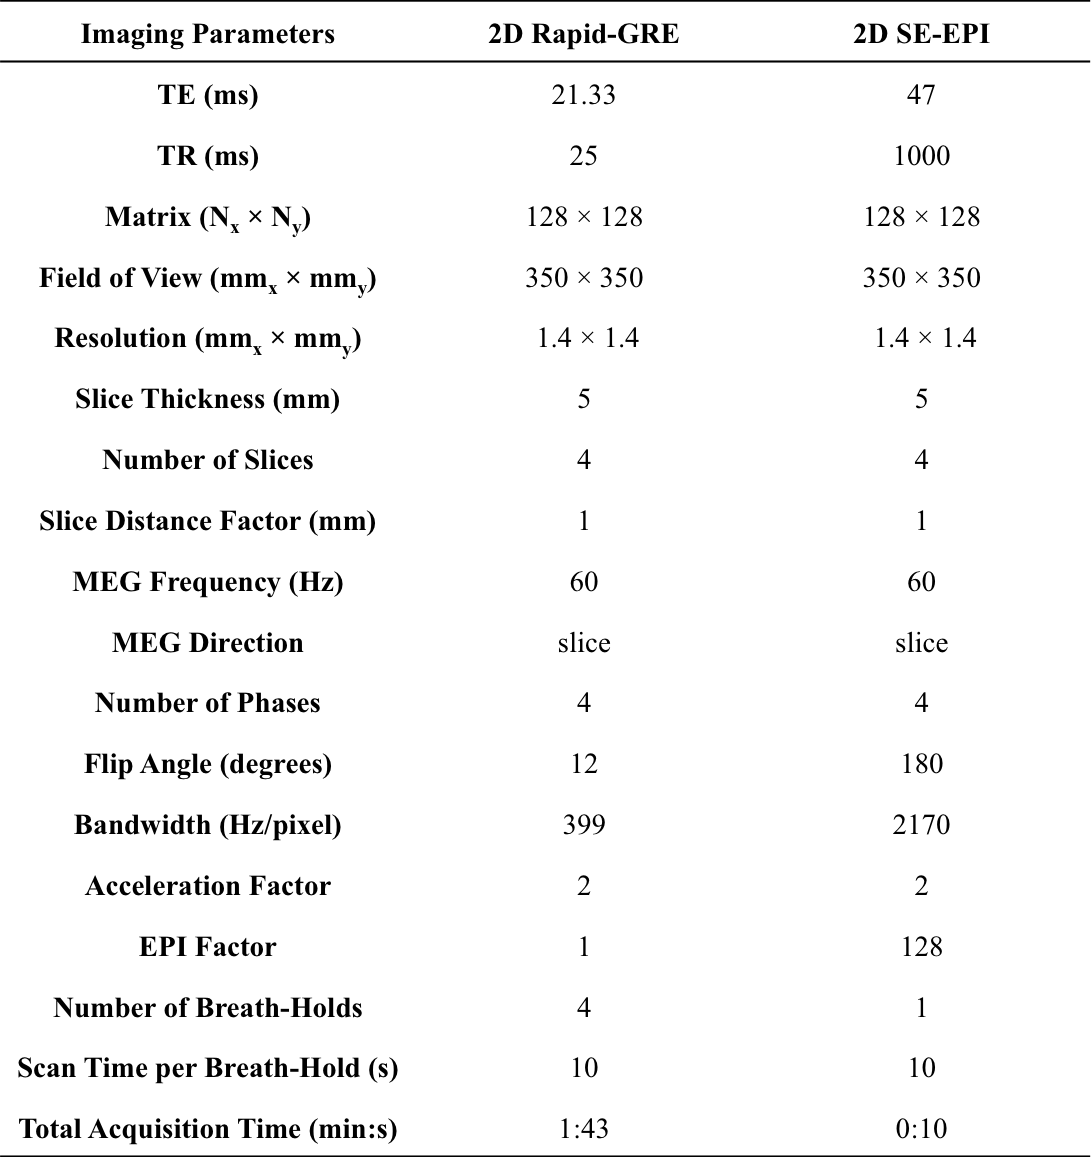
MRE Acquisition and Reconstruction: 6 healthy children and 10 children with suspected fibrosis (Table 1) were enrolled in this IRB-approved study. 2D rapid-GRE11 and 2D SE-EPI12 sequences were acquired at 3T (Prisma, Siemens) (Table 2). Each MRE sequence was scanned twice (back-to-back) in the same session to assess repeatability. Subjects were removed from the table, repositioned, and MRE was repeated during another scan session to assess reproducibility. Images and stiffness maps were calculated by scanner software.
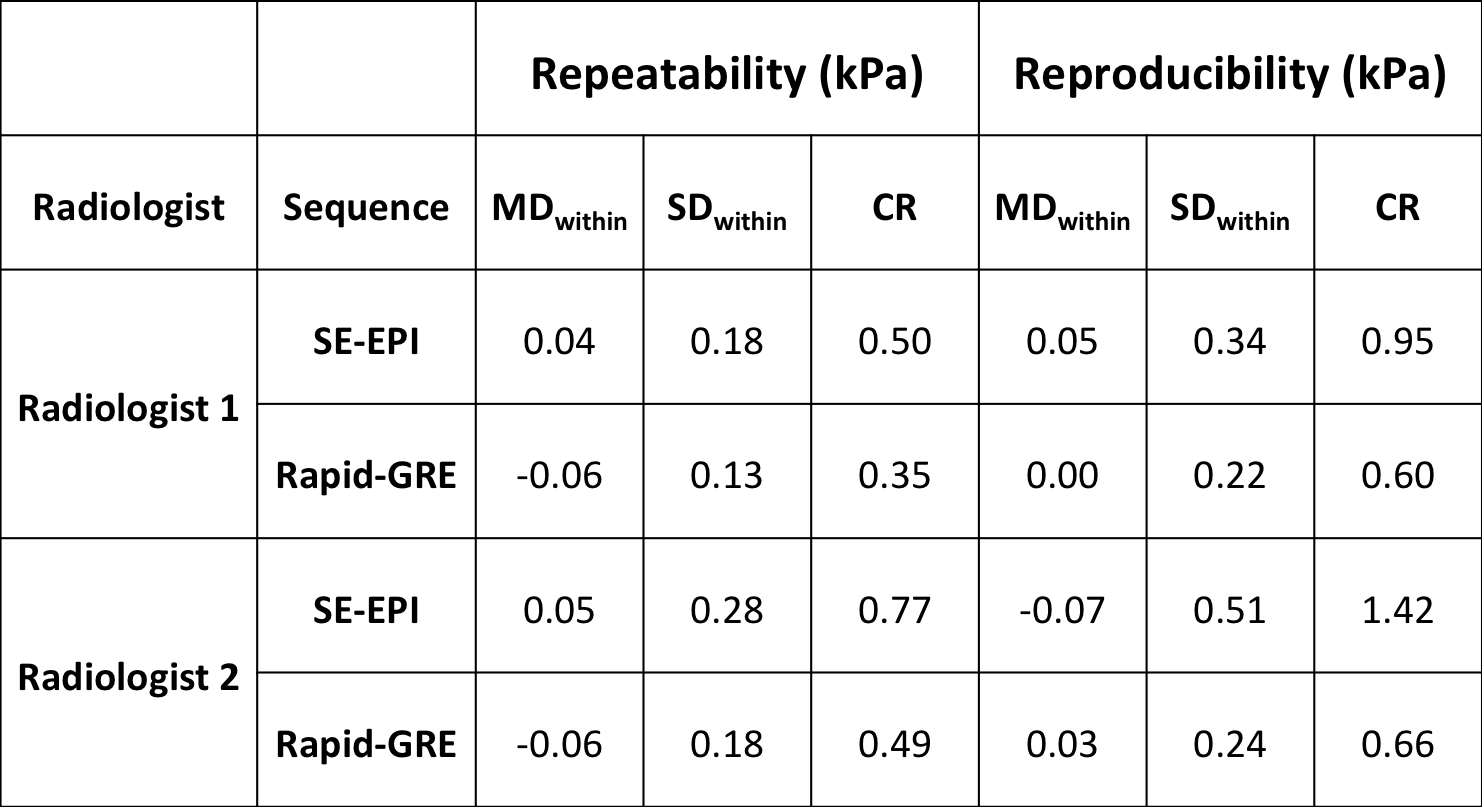
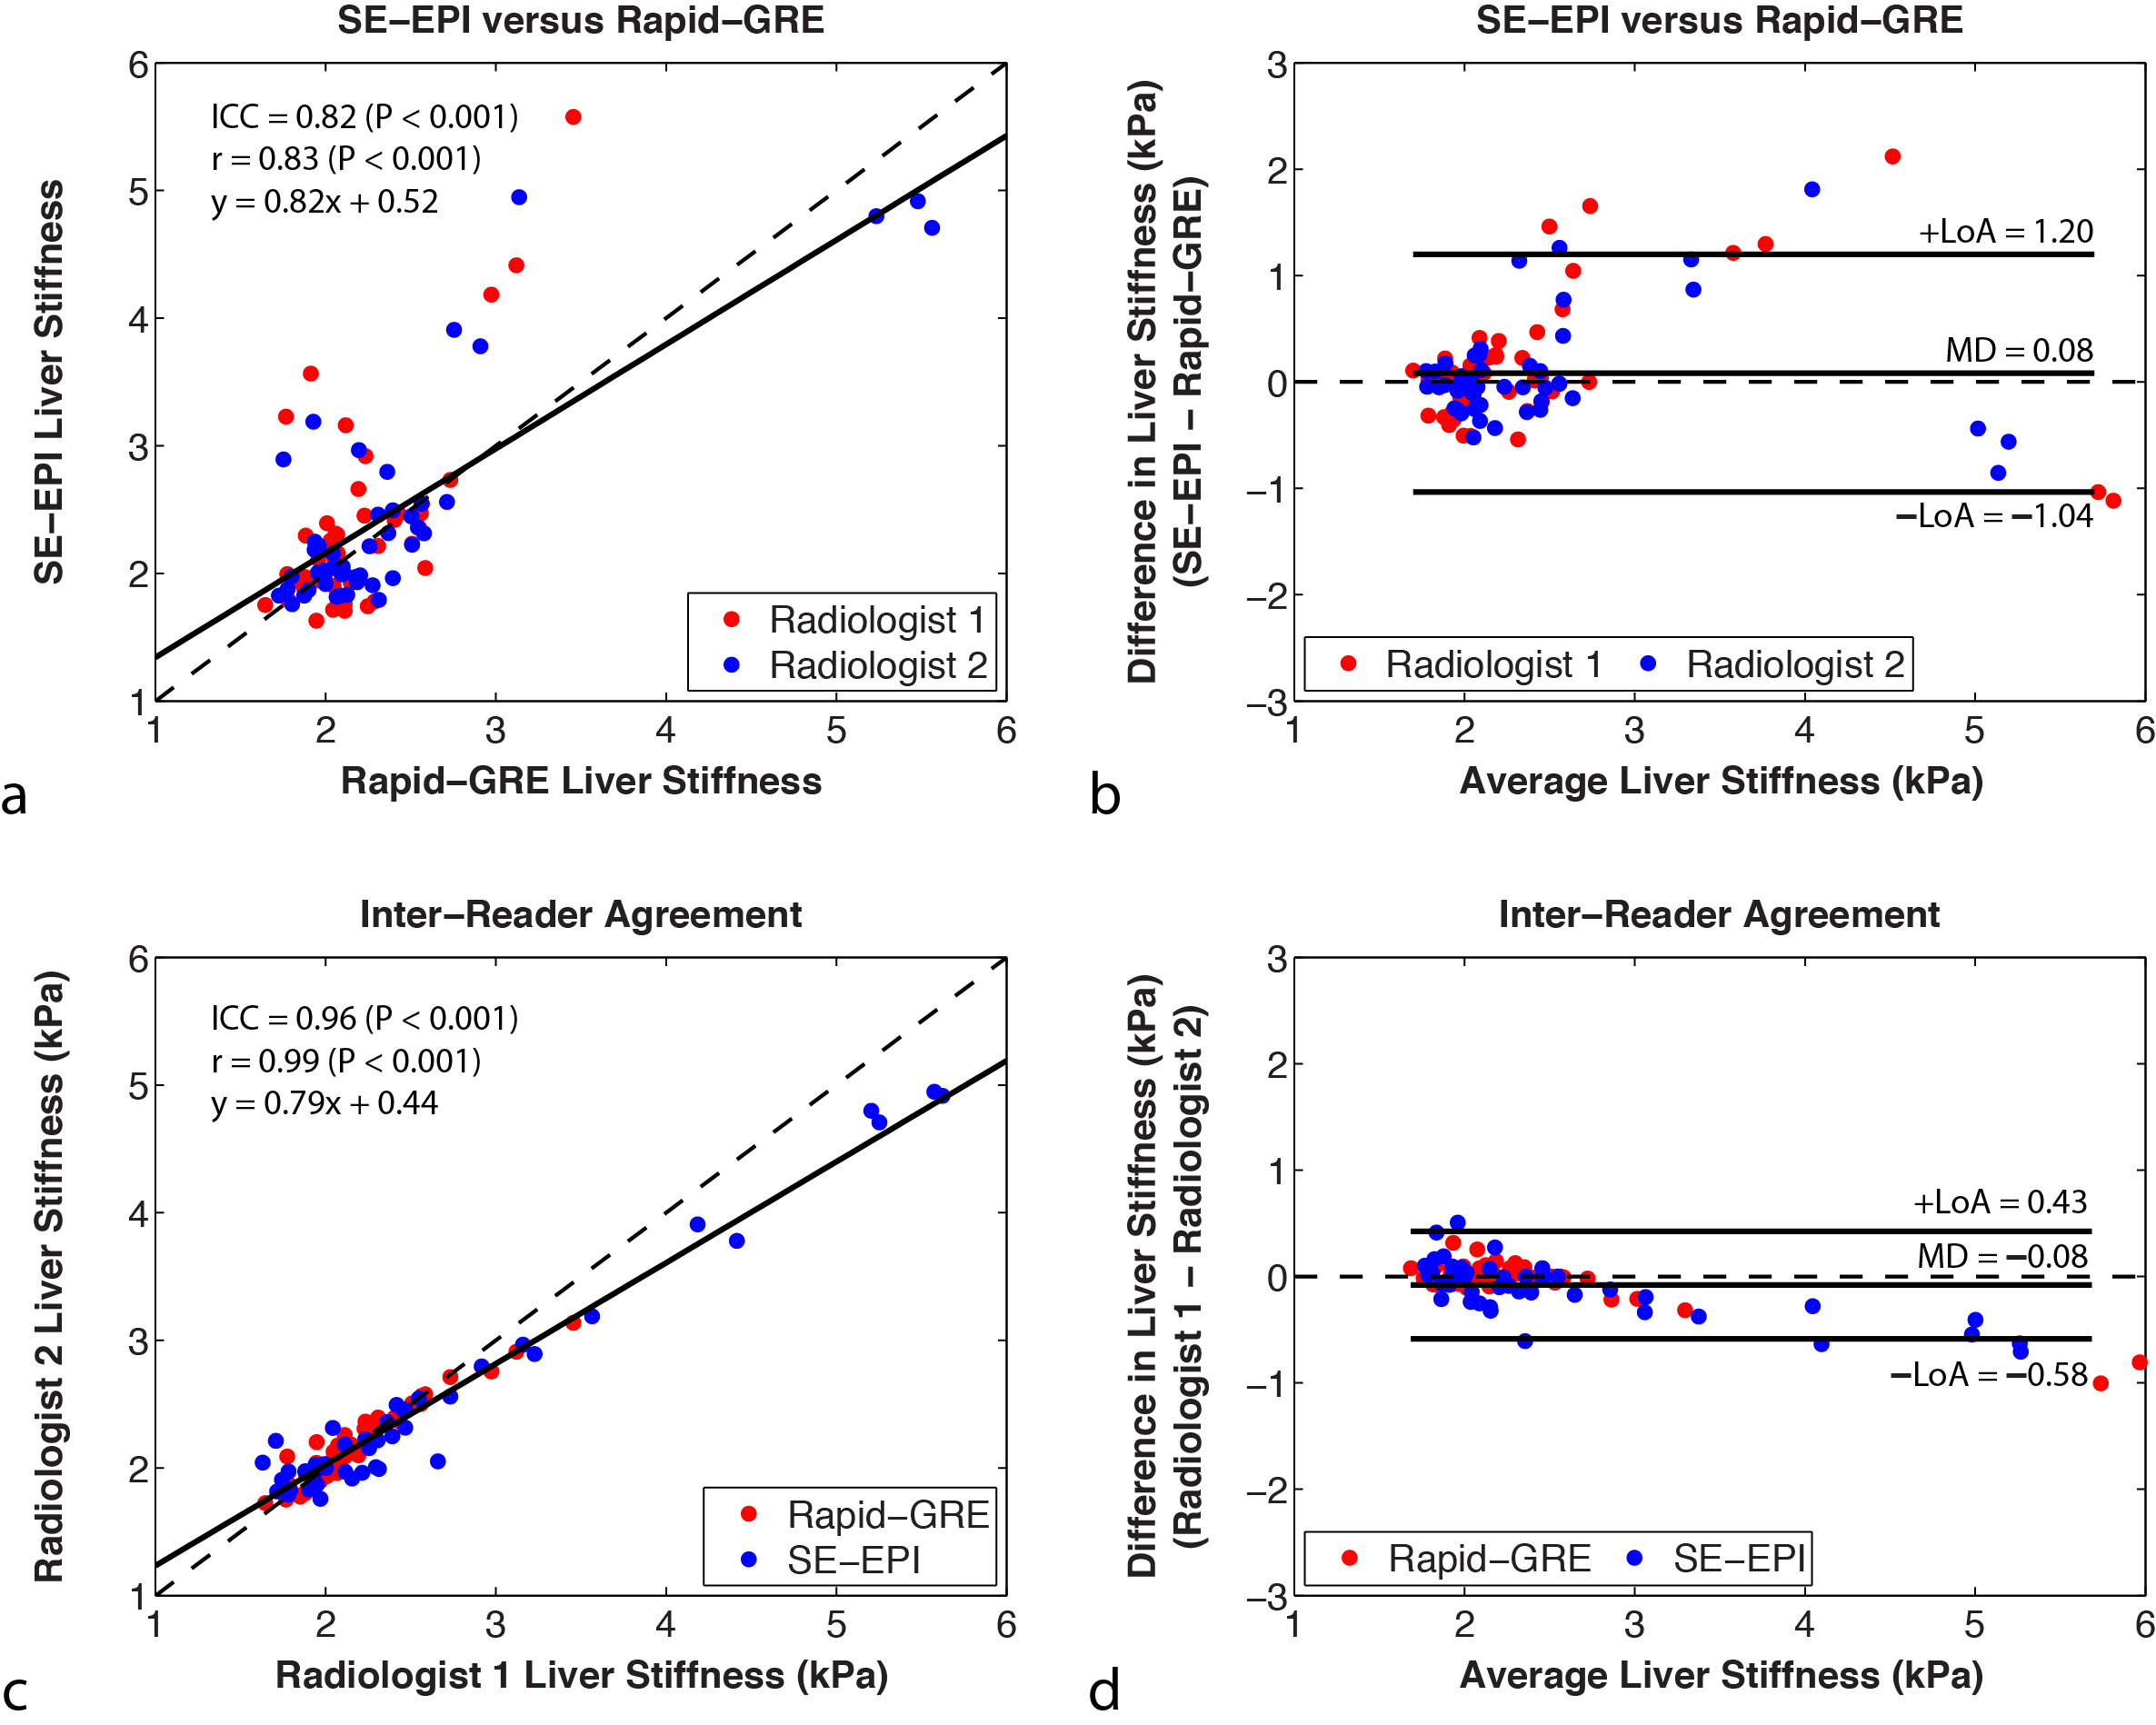
Analysis: Liver stiffness (kPa) was measured by two experienced radiologists independently. Differences in liver stiffness between radiologists and sequences were assessed using Pearson’s correlation coefficient (r) and intra-class correlation coefficient (ICC), and Bland-Altman analysis to determine the mean difference (MD) and limits of agreement (LoA). Repeatability and reproducibility were assessed by determining the within-technique mean difference (MDwithin), within-technique standard deviation (SDwithin), and coefficient of repeatability/reproducibility (CR)13. Significant differences between sequences, readers, and repeated/reproduced measurements were assessed using a three-way ANOVA. Liver ROI sizes with sufficient numerical confidence were calculated8 and differences were assessed using a paired t-test after normality testing. P<0.05 was considered significant.
Results
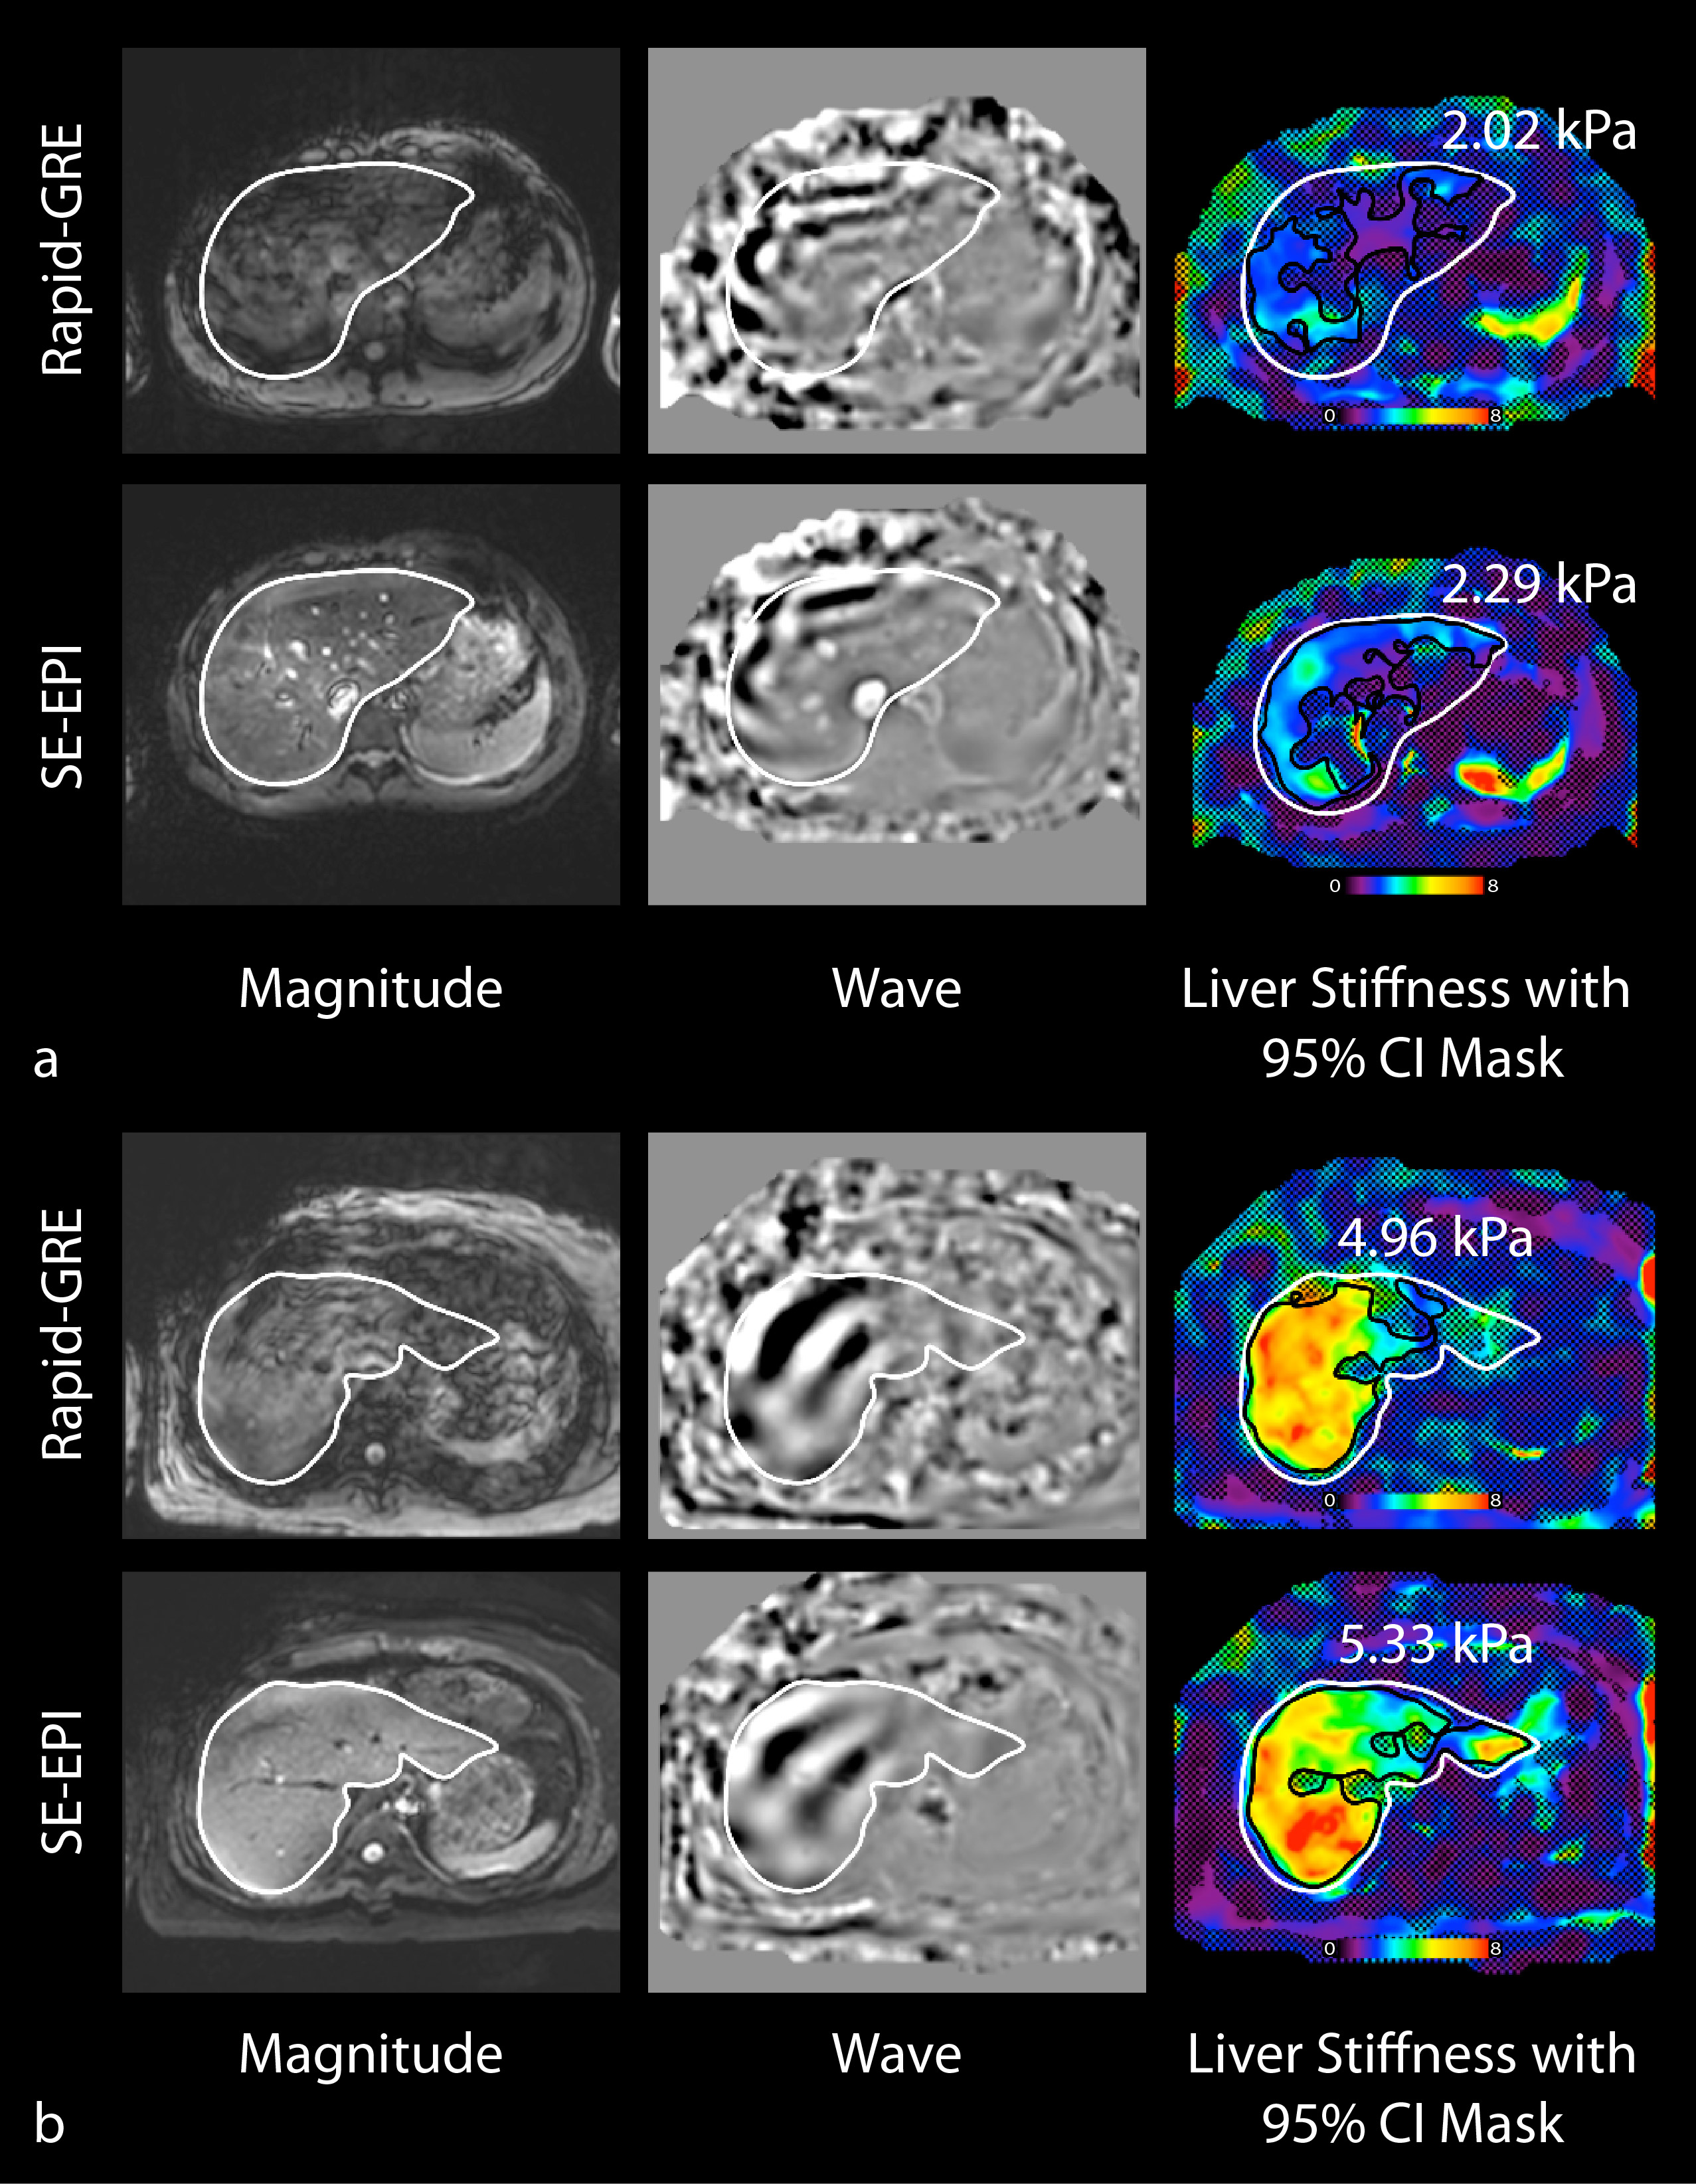
Median(±interquartile range, IQR) liver stiffness in healthy subjects was 2.02(±0.29) kPa and 2.30(±0.71) kPa in subjects with suspected fibrosis. The liver stiffness measurements in healthy subjects were consistent with stage 0 fibrosis. Of the subjects with suspected fibrosis, 1 subject had stage 2 fibrosis and 1 subject had stage 4 fibrosis according to published cutoffs14. Representative rapid-GRE and SE-EPI images from a healthy child and child with liver disease are shown in Figure 1. Linear correlation and Bland-Altman results comparing sequences (Fig. 2a-b) and radiologist measurements (Fig. 2c-d) showed r>0.82 (P<0.001) and ICC>0.82 (P<0.001) with MD<0.1kPa. Repeatability results are reported in Table 3. CRs were smaller for repeated than reproduced scans, rapid-GRE than SE-EPI, and for radiologist 1 compared to radiologist 2, but these differences were not significant. Median±IQR measureable liver ROI size was significantly greater for SE-EPI than rapid-GRE (17,824mm2±2,886mm2 versus 13,259mm2±7,159mm2, P=0.01).Discussion
Previous research compared conventional GRE or rapid-fractional-GRE to SE-EPI sequences and were performed at 1.5T in children or at 1.5T and 3T in adults8,9,15. We investigated rapid-GRE and SE-EPI sequences in children at 3T, which bolsters current knowledge. The MD between sequences reported in our study were consistent with previous findings8,9,15. Additionally, inter-reader agreement in children at 1.5T9 and differences between sequences in adults at 3T15 were consistent with our results. Both SE-EPI and rapid-GRE demonstrated good repeatability, reproducibility, inter-reader agreement, and quantitative agreement in liver stiffness measurements. However, the entire acquisition time for rapid-GRE was approximately 2 minutes due to multiple breath-holds and instructions, while SE-EPI was 10s for a single breath-hold. Therefore, SE-EPI may be desirable in patients when the scan time is limited or who may have difficulty performing consistent breath-holds. Another advantage for SE-EPI is the larger measurable liver ROI size, which may be due to improved image quality8. Previous work in children at 1.5T also demonstrated larger ROI size for SE-EPI9. Iron overload can reduce measurable liver ROI size using GRE sequences8. In this study, no children had elevated liver iron (normal range: R2*=69.1s-1±21.9s-1 at 3T16). Further work includes studying additional subjects with biopsy findings to compare MRE liver stiffness to histopathology.Conclusion
SE-EPI and rapid-GRE provided repeatable, reproducible, inter-reader agreement, and agreement in liver stiffness measurements in healthy children and children with suspected liver fibrosis at 3T. Since SE-EPI has a shorter acquisition time and provides a larger measurable liver ROI size compared to rapid-GRE, it may be a desirable technique to measure liver stiffness for the diagnosis and staging of fibrosis in children.Acknowledgements
The authors thank the Departments of Pediatrics and Radiological Sciences at UCLA for funding support. The authors thank Dr. Le Zhang, Xinzhou Li, Tammy Floore, Sparsha Govardhan, Glen Nyborg, and Sergio Godinez at UCLA for their help with recruitment and scanning.References
1. Ratziu V, Charlotte F, Heurtier A, et al. Sampling variability of liver biopsy in nonalcoholic fatty liver disease. Gastroenterology. 2005;128(7):1898-1906. doi:10.1053/j.gastro.2005.03.084.
2. Friedman SL. Evolving challenges in hepatic fibrosis. Nat Rev Gastroenterol &Amp; Hepatol. 2010;7:425. https://doi.org/10.1038/nrgastro.2010.97.
3. Xanthakos SA, Podberesky DJ, Serai S, et al. Use of magnetic resonance elastography to assess hepatic fibrosis in children with chronic liver disease. J Pediatr. 2014;164(1):10.1016/j.jpeds.2013.07.050. doi:10.1016/j.jpeds.2013.07.050.
4. Batheja M, Vargas H, Silva AM, et al. Magnetic resonance elastography (MRE) in assessing hepatic fibrosis: performance in a cohort of patients with histological data. Abdom Radiol. 2015;40(4):760-765. doi:10.1007/s00261-014-0321-8.
5. Singh S, Venkatesh SK, Wang Z, et al. Diagnostic Performance of Magnetic Resonance Elastography in Staging Liver Fibrosis: A Systematic Review and Meta-analysis of Individual Participant Data. Clin Gastroenterol Hepatol. 2015;13(3):440-451.e6. doi:10.1016/j.cgh.2014.09.046.
6. Yin M, Glaser KJ, Talwalkar JA, Chen J, Manduca A, Ehman RL. Hepatic MR Elastography: Clinical Performance in a Series of 1377 Consecutive Examinations. Radiology. 2016;278(1):114-124. doi:10.1148/radiol.2015142141.
7. Kim YS, Jang YN, Song JS. Comparison of gradient-recalled echo and spin-echo echo-planar imaging MR elastography in staging liver fibrosis: a meta-analysis. Eur Radiol. 2018;28(4):1709–1718. doi:10.1007/s00330-017-5149-5.
8. Felker ER, Choi K-S, Sung K, et al. Liver MR Elastography at 3 T: Agreement Across Pulse Sequences and Effect of Liver R2* on Image Quality. Am J Roentgenol. 2018;211(3):588-594. doi:10.2214/AJR.17.19288.
9. Serai SD, Dillman JR, Trout AT. Spin-echo Echo-planar Imaging MR Elastography versus Gradient-echo MR Elastography for Assessment of Liver Stiffness in Children and Young Adults Suspected of Having Liver Disease. Radiology. 2016;282(3):761-770. doi:10.1148/radiol.2016160589.
10. Wagner M, Besa C, Ayache JB, et al. MR Elastography of the liver: qualitative and quantitative comparison of gradient echo and spin echo echoplanar imaging sequences. Invest Radiol. 2016;51(9):575-581. doi:10.1097/RLI.0000000000000269.
11. Chamarthi S, Raterman B, Mazumder R, et al. Rapid Acquisition Technique for MR Elastography of the Liver. Magn Reson Imaging. 2014;32(6):679-683. doi:10.1016/j.mri.2014.02.013.
12. Mariappan YK, Dzyubak B, Glaser KJ, et al. Application of Modified Spin-Echo–based Sequences for Hepatic MR Elastography: Evaluation, Comparison with the Conventional Gradient-Echo Sequence, and Preliminary Clinical Experience. Radiology. 2016;282(2):390-398. doi:10.1148/radiol.2016160153.
13. Obuchowski NA, Reeves AP, Huang EP, et al. Quantitative imaging biomarkers: A review of statistical methods for computer algorithm comparisons. Stat Methods Med Res. 2015;24(1):68-106. doi:10.1177/0962280214537390.
14. Singh S, Venkatesh SK, Loomba R, et al. Magnetic resonance elastography for staging liver fibrosis in non-alcoholic fatty liver disease: a diagnostic accuracy systematic review and individual participant data pooled analysis. Eur Radiol. 2016;26(5):1431-1440. doi:10.1007/s00330-015-3949-z.
15. Trout AT, Serai S, Mahley AD, et al. Liver Stiffness Measurements with MR Elastography: Agreement and Repeatability across Imaging Systems, Field Strengths, and Pulse Sequences. Radiology. 2016;281(3):793-804. doi:10.1148/radiol.2016160209.
16. Storey P, Thompson AA, Carqueville CL, Wood JC, de Freitas RA, Rigsby CK. R2* imaging of transfusional iron burden at 3T and comparison with 1.5T. J Magn Reson Imaging. 2007;25(3):540-547. doi:10.1002/jmri.20816.
Figures