1741
A Rapid MR Elastography Sequence with Spatial Saturation Pulses to Suppress Vascular Flow1Philips, Cincinnati, OH, United States, 2Department of Radiology, Cincinnati Children’s Hospital Medical Center, Cincinnati, OH, United States, 3Philips, Cleveland, OH, United States
Synopsis
We describe a rapid fast field echo (FFE) Magnetic Resonance Elastography (MRE) pulse sequence for measurement of liver stiffness in reduced breath hold times (from 13.3s to 9.2s/slice). The key features of the sequence include: 1) modified motion encoding gradients to allow a shorter TR while maintaining appropriate synchronization with the period of the applied mechanical motion; 2) flow saturation pre-pulses to suppress ascending and descending vascular flow; and 3) SENSE reconstruction. Through validation in a gel phantom and subsequent measurement of liver stiffness in vivo, we demonstrate the effectiveness of the new pulse sequence.
Introduction
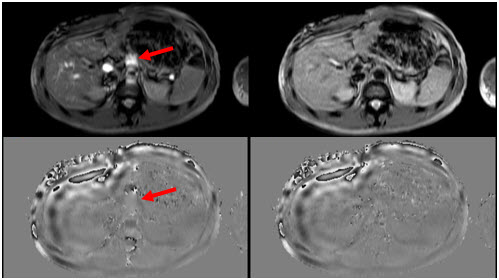
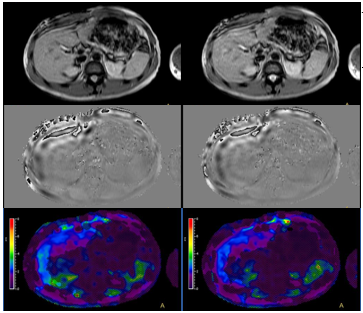
MR Elastography (MRE) allows the noninvasive measurement of liver stiffness which correlates with histopathologic grading of fibrosis (1-3). Two-dimensional (2D) fast field echo (FFE) MRE with breath holding (BH) is the most common approach. BH times of 13-16 s/slice (≈ x4 slices) are common which can be challenging for children as well as adults with chronic liver disease. A rapid MRE sequence has been proposed to accelerate acquisition by halving TR. Proper synchronization of the motion encoding gradients (MEGs) with the mechanical wave is accomplished by maintaining the polarity of the MEGs across consecutive TRs (4). However, the shorter TR does not accommodate the application of spatial saturation pulses to suppress ascending and descending vascular flow. Both the magnitude and phase MRE images can potentially suffer from pulsation artifacts (Fig. 1, left column). We propose a new rapid MRE pulse sequence that uses modified MEGs to allow a shorter TR while maintaining appropriate synchronization with the mechanical wave in combination with spatial pre-saturation pulses and SENSE reconstruction. We validate this sequence through comparison to a conventional 2D FFE MRE technique in a gel phantom and in vivo.Methods
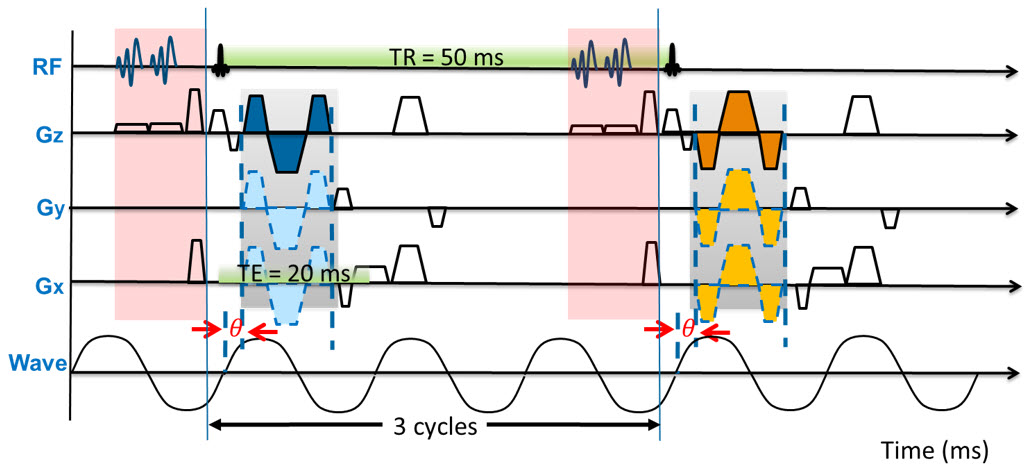
The conventional 2D FFE MRE sequence was implemented through the modification of a standard phase contrast sequence to include a MEG (16.7 ms and 18mT/m) along the slice-select direction. Scan parameters were TR=50 ms; TE=20 ms; flip angle=20°; acquisition matrix=256x64; motion frequency=60 Hz; 3 motion cycles per TR; 4 axial slices, slice thickness=10 mm, slice gap=1 mm; and SENSE factor=2. The pulse sequence delivered trigger pulses to synchronize the active driver with the imaging sequence. Regional saturation technique (REST) (5) slabs were placed above and below the imaging slices within each TR to suppress unwanted flow artifacts from vessels. The pulse sequence diagram is shown in Fig. 2. Between two consecutive TRs, the polarity of the MEGs is reversed. Each TR contains 3 cycles of external motion for a mechanical motion frequency of 60Hz. The BH time with this technique is 13.3 s/slice.
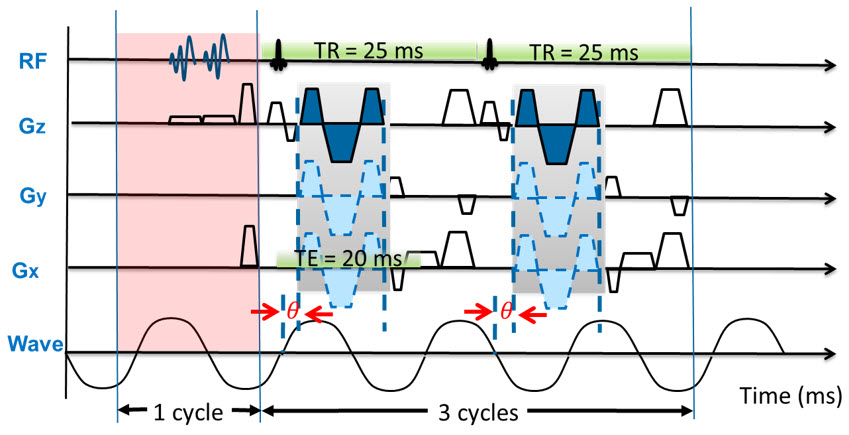
For rapid MRE, the TR is halved to 25ms to shorten the BH time; corresponding to the duration of 1.5 motion cycles of the 60Hz mechanical wave. Consequently, unlike in the conventional approach, the polarity of the MEGs remains the same across consecutive TRs, since the mechanical wave reverses the phase (Fig. 3). However, TR=25ms is not sufficiently long to include the REST pre-pulse within each TR. Therefore, the REST pre-pulses are applied independently, immediately prior to every other TR. To appropriately synchronize the MEGs with the mechanical motion wave, each trigger of the mechanical driver occurs every other TR and sends 4 cycles of external motion. 3 cycles are for the image acquisition period of two TRs and 1 cycle is for the application of two REST slabs (Fig. 2). The BH time of the proposed sequence is 9.2 s/slice.
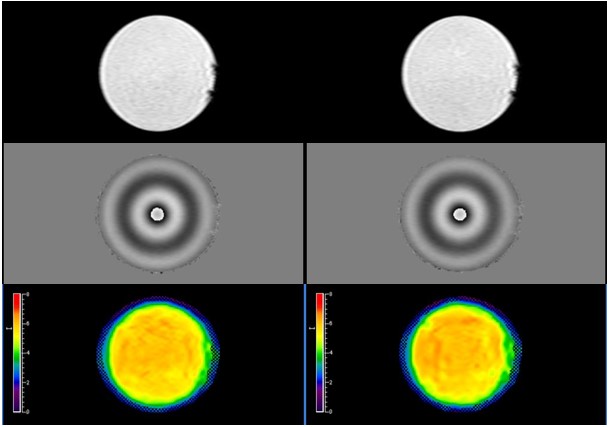
Gel phantom (Resoundant, Inc., MN, USA) studies and in vivo human imaging were performed on a Philips Ingenia 1.5T scanner (Best, The Netherlands). MRE was performed with the conventional 2D FFE MRE sequence (Fig. 4, left column) and the rapid MRE technique (Fig. 4, right column). For proof of concept, one volunteer subject was recruited under an institutional review board approved sequence testing protocol. Liver MRE was performed using 28-channel anterior and posterior coil arrays (Fig. 5). Four axial slices through the mid liver were obtained in four BHs for each sequence. MR elastograms were generated using a multimodal direct inversion (MMDI) algorithm (Mayo Clinic, Rochester, MN) from which stiffness measurements were made on all 4 slices, and the weighted average of the mean stiffness value (kPa) measured for each slice was recorded.
Results
Measured mean stiffness for the phantom was 5.87 ± 0.32 kPa with the conventional sequence and 5.85 ± 0.39 kPa with the proposed sequence. For the human subject, mean liver stiffness was 2.13 ± 0.36 kPa with conventional sequence and 2.09 ± 0.27 kPa with the proposed sequence. Flow pulsation artifacts were effectively suppressed on the rapid MRE (Fig. 1).Conclusion
We demonstrate successful use of a rapid 2D FFE MRE technique with spatial saturation pulses to suppress vascular flow artifacts and to reduce BH time through the combine use of appropriate MEG design to allow shorter TRs and SENSE reconstruction. Preliminary data on a phantom and a human volunteer show similar stiffness values to the conventional sequence. Rapid 2D FFE MRE with flow suppression may be clinically useful in children and adults with limited BH ability.Acknowledgements
No acknowledgement found.References
[1] Yin et.al, Radiology 2016, 278(1):114-24. [2] Xanthakos et. al, J Pediatr 2014, 164(1):186-8. [3] Serai et. al, Abdom Imaging 2015, 40(4): 789-94. [4] Chamarthi et. al. MRI 2014, 32(6), 679-683. [5] Felmlee et.al, Radiology 1987, 164:559-564.Figures