1740
Texture analysis Using Hepatobiliary Phase Gadoxetic-acid MRI for the Detection of Liver Allograft FibrosisMiriam Hulkower1,2, Sara Lewis1,2, Nicholas Vountsinas1, Xing Chin1, Priyanka Kadaba1, Andrew Lee1, Ayushi Singh1, Joseph Song1, Stefanie Hectors1,2, Octavia Bane1,2, Paul Kennedy1,2, Juan Putra3, Swan Thung3, Thomas Schiano4, Maria Isabel Fiel3, and Bachir Taouli1,2
1Department of Radiology, Icahn School of Medicine at Mount Sinai, New York, NY, United States, 2Translational and Molecular Imaging Institute, Icahn School of Medicine at Mount Sinai, New York, NY, United States, 3Department of Pathology, Icahn School of Medicine at Mount Sinai, New York, NY, United States, 4Department of Medicine, Icahn School of Medicine at Mount Sinai, New York, NY, United States
Synopsis
The goal of our study was to assess the value of qualitative and quantitative texture features on gadoxetic-acid enhanced MRI compared to blood tests for the detection of liver allograft fibrosis. We found that quantitative texture analysis and laboratory FIB-4 score exhibited complementary information for prediction of fibrosis stage, while qualitative MRI features were only valuable for identifying advanced fibrosis/cirrhosis.
Purpose
Approximately 6000 liver transplants (LT) are performed annually in the United States.1 While vascular and biliary complications are easily detected using cross sectional imaging methods including MRI, these techniques are not effective in discriminating among the various causes of parenchymal dysfunction,2 which include acute/chronic rejection, infection, recurrence of primary liver disease and development of de novo liver disease, many of which culminate in the development of liver fibrosis.1 Up to 53% of liver transplant patients demonstrate some degree of liver fibrosis and accurate estimation of the degree of liver fibrosis is crucial for prognostication and clinical decision-making.2,3 Percutaneous biopsy is the reference standard for the definitive staging of liver allograft fibrosis, however is invasive, challenging to repeat, prone to sampling error and potential complications.2 Image texture analysis (radiomics) has shown correlations between quantitative texture features and histopathologic features in native liver.4 The goal of our study is to assess the value of qualitative and quantitative texture features on gadoxetic-acid enhanced MRI compared to blood tests for the detection of liver allograft fibrosis.Methods
This IRB-approved retrospective study identified 32 patients (M/F 20/12, mean age 60.9y) who had clinical evidence of liver dysfunction, gadoxetic-acid enhanced MRI exam and liver biopsy within 3 months of MRI. Patients with liver dysfunction secondary to vascular and/or biliary complications were excluded. Qualitative MRI analysis was performed by two radiologists in consensus to evaluate for morphologic changes including liver surface nodularity, enlargement of the hilar periportal space/gallbladder fossa, left lobe/caudate hypertrophy, right lobe atrophy, ascites and/or presence of hepatobiliary phase excretion. Texture analysis was performed using LIFEx software5 by placing a 3 cm2 ROI in the posterior right hepatic lobe on hepatobiliary phase imaging by a single observer. 37 texture features were then computed. Aspartate aminotransferase platelet ratio index (APRI score) and Fibrosis 4 (Fib-4) Index were also obtained. Liver fibrosis on biopsy specimens was retrospectively restaged using the Ishak fibrosis score (0-6). Qualitative findings were compared between fibrotic and non-fibrotic livers using Fisher’s exact test. Texture features were compared between fibrosis stage using Spearman correlation and Mann-Whitney test. ROC analysis was performed to test the diagnostic performance of texture features for discrimination of histopathologic fibrosis.Results
The fibrosis distribution was as follows: F0 (n=5, 15.6%), F1 (n=6, 18.8%), F2 (n=10, 31.3%), F3 (n=4, 12.5%), F4 (n=2, 6.3%), F5 (n=3, 9.4%) and F6 (n=2, 6.3%). Mean Fib-4 and APRI scores were 1.11 ± 1.09 and 3.61 ± 2.61, respectively. Fib-4 demonstrated a moderate significant correlation with histopathologic fibrosis stage (r=0.3768, p=0.0335), while APRI did not (p> 0.2392). Qualitative MRI findings were only able to identify the presence of severe fibrosis/cirrhosis, except for the lack of excretion on HBP (Figure 1). One texture feature demonstrated significant correlation with stage of fibrosis, when grouped into categories of fibrosis (absent=F0, mild-moderate fibrosis=F1-4 and severe fibrosis/cirrhosis=F5-6); GLRLM_RP (r=0.3604, p=0.0427), although there was no significant correlation between texture features and individual stages of fibrosis (all p-values > 0.1301). Several texture features were able to distinguish between F0 vs. fibrosis of any degree of severity (F1-6) (Figure 2). ROC analysis demonstrated AUC up to 0.911 for GLCM Energy (p=0.0040, threshold <0.0075, 85% sensitivity and 80% specificity) (Figures 3 and 4). Two texture features were also able to identify the presence of severe fibrosis (F0-4 vs. F5-6); GLRLM_SRE (p=0.0457) and GLZLM_SZE (0.0379), with an AUC of 0.7852 and 0.7963 respectively (Figure 5).Discussion and Conclusions
Our results indicate promising value of radiomics analysis of EOB-MRI data in liver allografts for detection and staging of fibrosis. Texture analysis is complementary along with qualitative imaging and clinical values to help stage fibrosis in liver transplant patients noninvasively. The findings need to be tested in a larger cohort of patients to validate texture analysis for characterization of liver fibrosis and parenchymal allograft dysfunction.Acknowledgements
None.References
- Fenkel JM and Halegoua-Demarzio D. Management of the Liver Transplant Recipient. Med Clin North Am. 2016;100 (3) 477-486
- Schuppan D and Afdhal NH. Liver Cirrhosis. Lancet 2008: 371 (9615) 838-851
- Karam V, Sebagh M et al Quality of life 10 years after liver transplantation: The impact of graft histology. World J Transplant 2016: 6(4) 703-711
- Bahl G, Cruite I et al. Noninvasive classification of hepatic fibrosis based on texture parameters from double contrast-enhanced magnetic resonance images. J Magn Reson Imaging 2012:36, 1154-1162
- LIFEx software - Nioche C, Orlhac et al. LIFEx: a freeware for radiomic feature calculation in multimodality imaging to accelerate advances in the characterization of tumor heterogeneity. Cancer Research 2018: 78 (16) 4786-4789
Figures
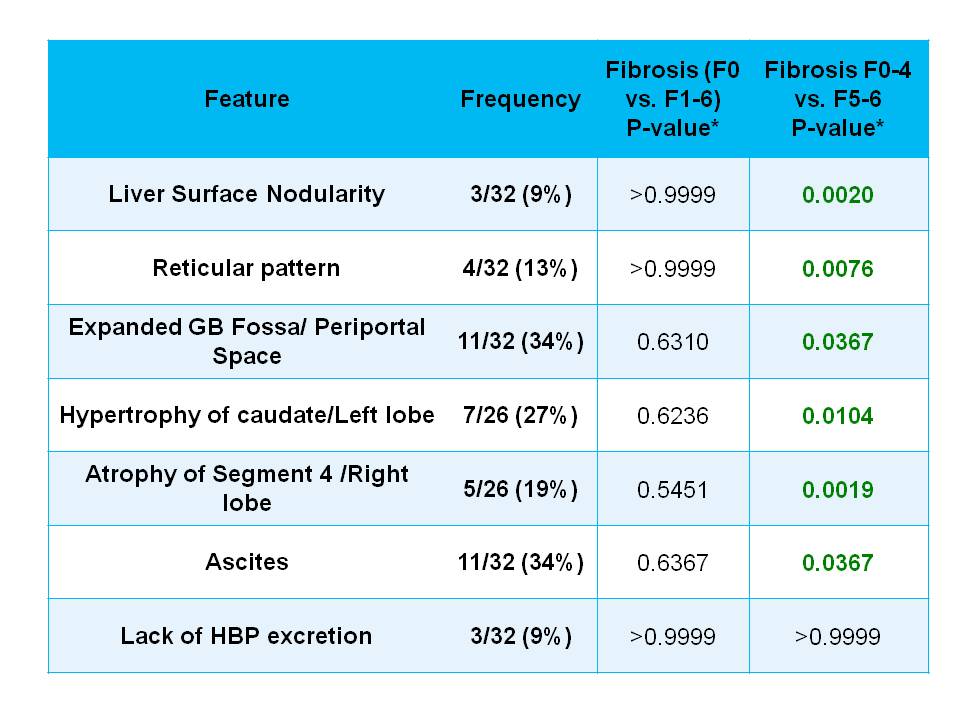
Frequency
of qualitative MRI features in 32 liver transplant patients. Fisher’s exact
test shows that qualitative imaging findings of cirrhosis were present more
frequently in patients with advanced fibrosis and cirrhosis at pathology.
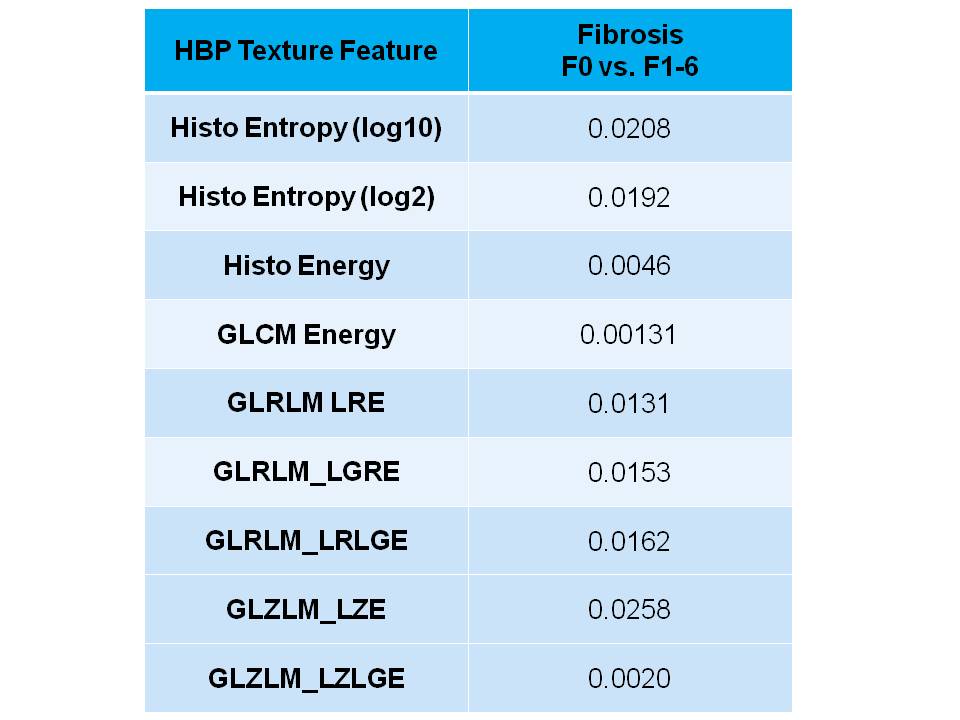
Significant
associations with texture features and absence or presence of fibrosis.
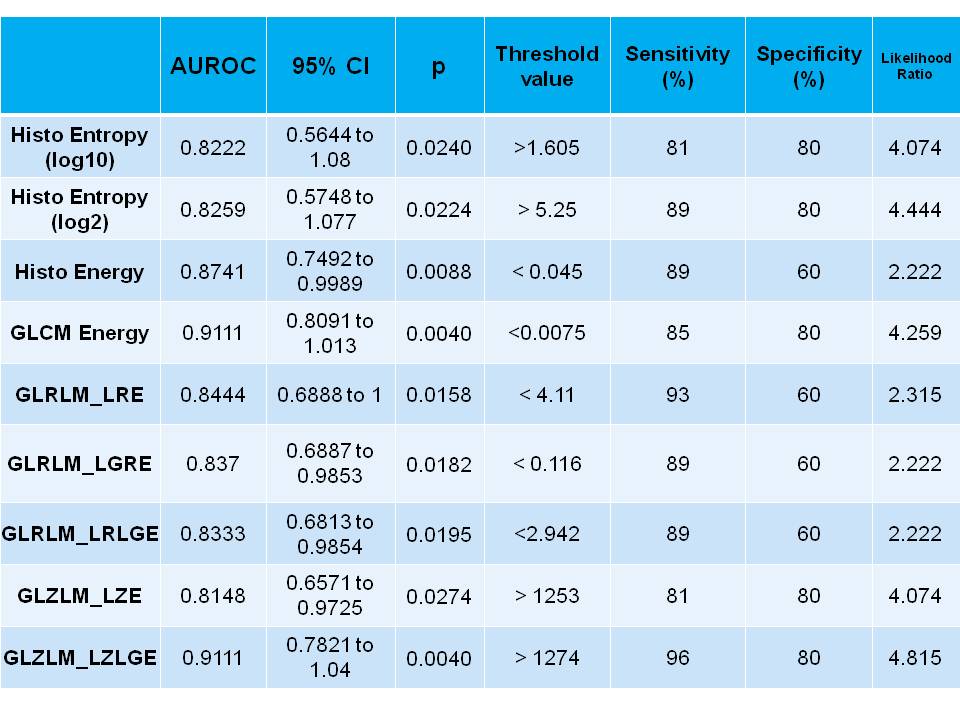
Overview
of features that showed significant diagnostic performance for prediction of absence
or presence of any fibrosis (F1-F6).
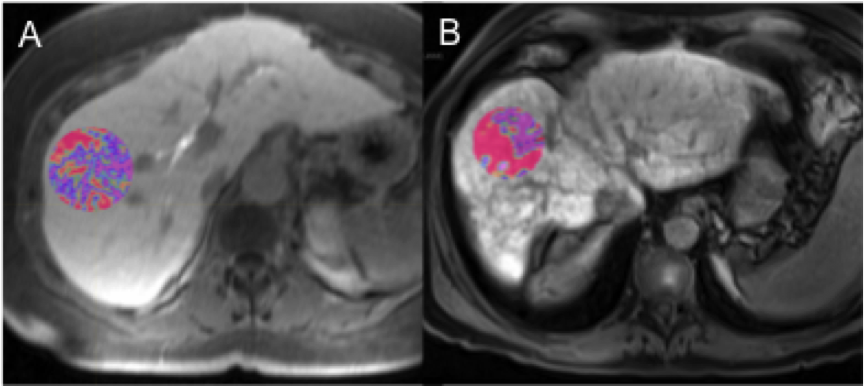
Examples
of texture results for GLCM Energy in a 62 year old female non-cirrhotic = 0.03
(A) and a 63 year old male cirrhotic post-transplant patient = 0.06 (B). *Values are
displayed at scale 0-1,000 in (A) and 0-10,000 in (B).
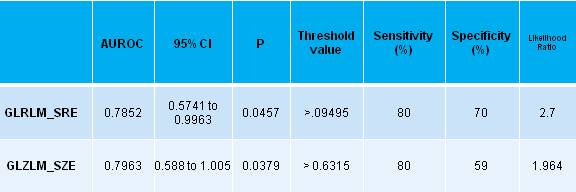
Overview
of features that showed significant diagnostic performance for prediction of severe
fibrosis (F0-4 vs. F5-6).