1739
The value of hepatocyte fraction based on pharmacokinetic model using gadoxetate disodium in assessment of liver fibrosis stage1Radiology, Jiangmen Central Hospital, Affiliated Jiangmen Hospital of Sun YAT-SEN University, Jiangmen, China, 2Radioogy, The First Affiliated Hospital of Shenzhen University, Health Science Center, Shenzhen Second People's Hospital, Shenzhen, China, 3Pathology, Jiangmen Central Hospital, Affiliated Jiangmen Hospital of Sun YAT-SEN University, Jiangmen, China, 4Hepatobiliary Surgery, Jiangmen Central Hospital, Affiliated Jiangmen Hospital of Sun YAT-SEN University, Jiangmen, China, 5Healthcare, Philips, Guangzhou, China
Synopsis
Liver fibrosis is prevalent in patients with chronic liver disease, and the early diagnosis of liver fibrosis is still challenging in clinical practice. In this study, the hepatocyte fraction (HepF) was calculated using the T1 value before and 20min after Gd-EOB-DTPA injection (hepatobiliary phase). Patients with severe liver fibrosis showed significantly higher T1 value and lower HepF value. In addition, HepF achieved the best performance in differentiation of liver fibrosis from non-fibrosis (AUC = 0.74), and mild liver fibrosis from severe liver fibrosis (AUC = 0.95), proving HepF can be a better noninvasive quantitative method for liver fibrosis evaluation.
Introduction
The diagnosis of mild liver fibrosis (S1 or S2) is very important for patients with chronic liver disease to avoid progression of cirrhosis or even hepatocellular carcinoma. Unfortunately, the noninvasive accurate diagnosis of early stage liver fibrosis is still challenging in clinical practice. Gd-EOB-DTPA is hepatocyte-specific contrast agent that can provide a new method to assess the quantification of the hepatocyte fraction (HepF) base on simple pharmacokinetics 1-3. Therefore, the purpose of this study was to evaluate the value of HepF in assessment of liver fibrosis stage.Materials and Methods
Eighteen patients who underwent Gd-EOB-DTPA-enhanced MR scanning from September 2018 to October 2018 were included. Among these patients, 28 samples derived from 7 patients were pathologically staged in liver fibrosis, and 11 patients without liver fibrosis were included as control group. Images of different inversion recovery (IR) time for T1 mapping were acquired before and 20min after injection (hepatobiliary phase) on clinical 3T scanner (Philips Ingenia) using 32-channel body coil, and the planes before and after injection were placed at the same anatomical position. The scanning parameter were as follow: 2D Look-Locker sequence, breath holding, T1-TFE, Matrix = 1.37×1.37, slices thickness = 3 mm, TR/TE = 2.2 / 1.0 ms, FA = 7, single-slice, SENSE factor=2, scan time = 13sec. A pharmacokinetic model based on the changes of T1 values between pre- and post-contrast of liver and spleen were used to calculate HepF. In addition, the T1 value of liver parenchyma before injection and the corresponding changes (ΔT1 value) between pre- and post-contrast were measured. Two radiologists, with 6 and 10 years abdominal imaging experience respectively, independently placed ROI on liver parenchyma. All ROIs matched with the position where the samples were used for pathological liver fibrosis stage. Liver fibrosis degree were assessed according to Scheuer scoring system, and all samples were divided in non-fibrosis, mild liver fibrosis (S1-2), and severe liver fibrosis (S3-4).Results
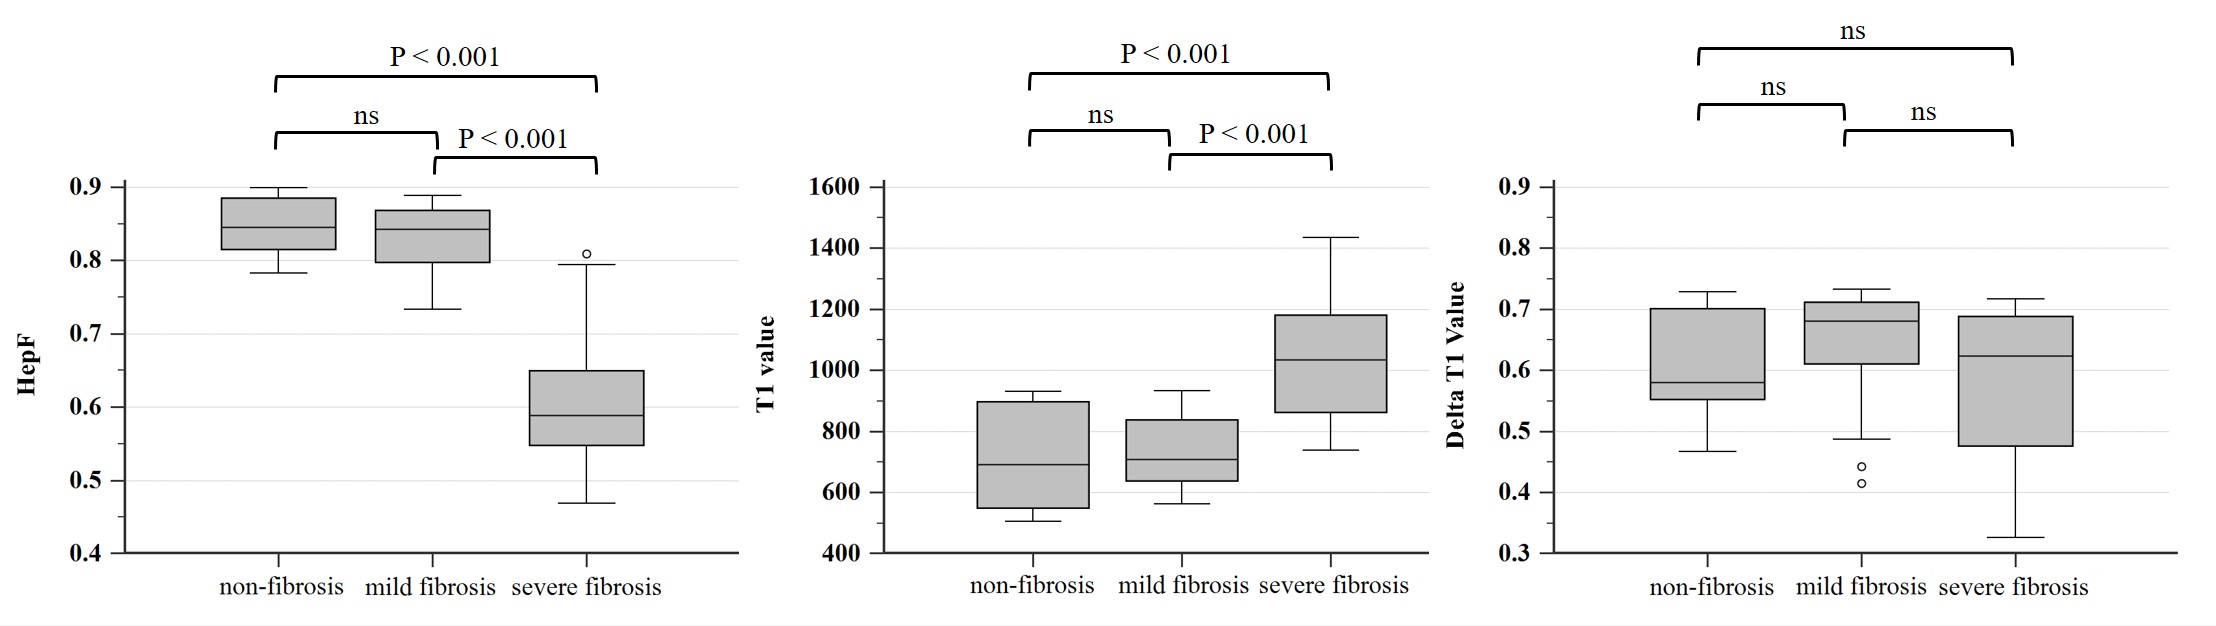
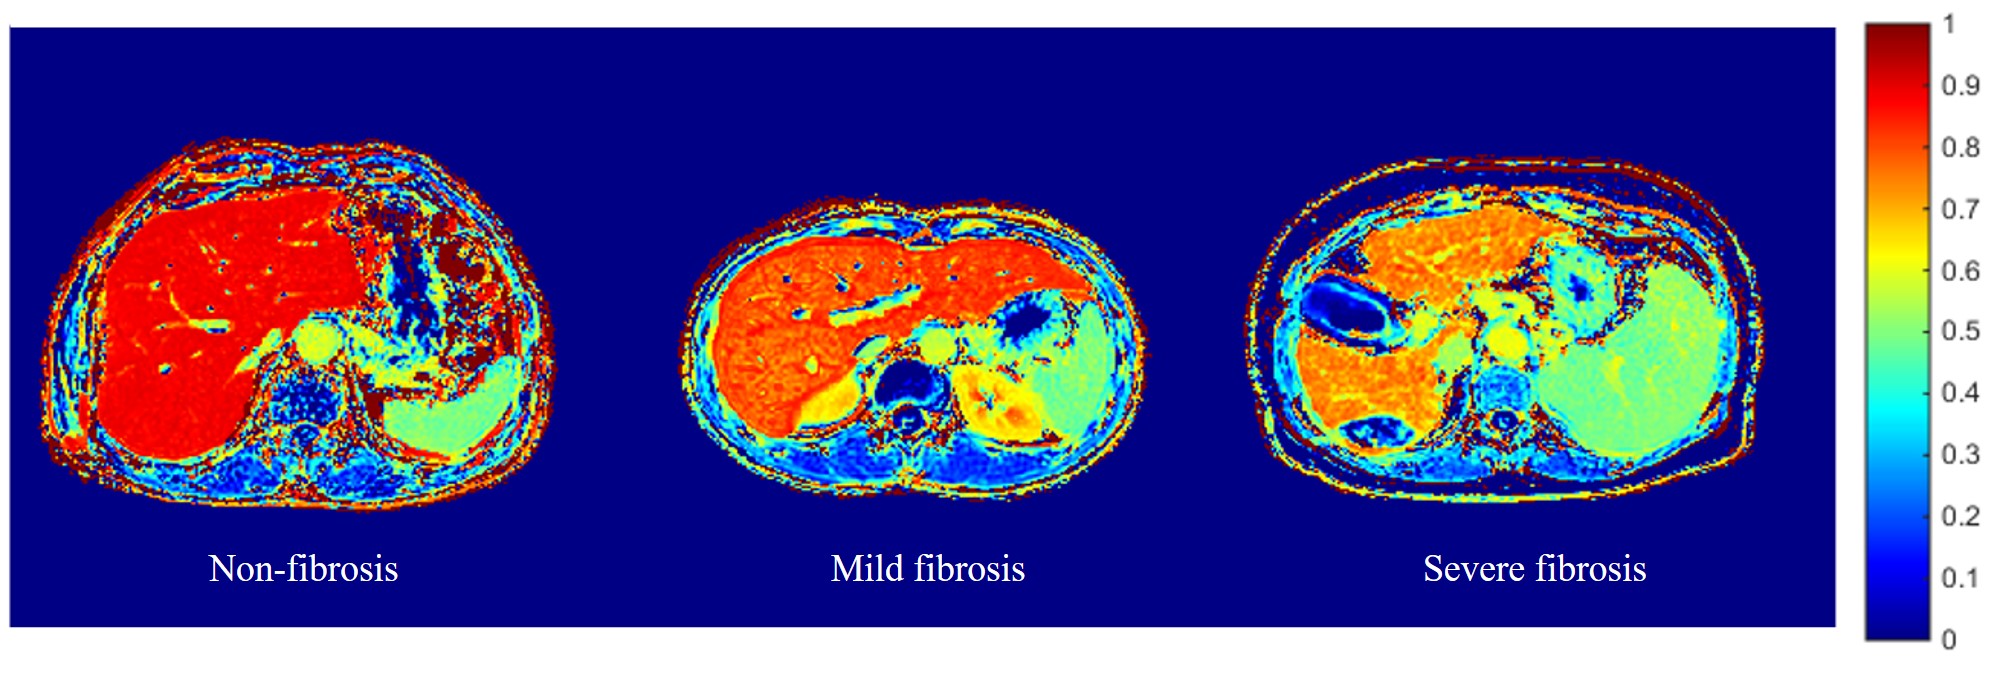
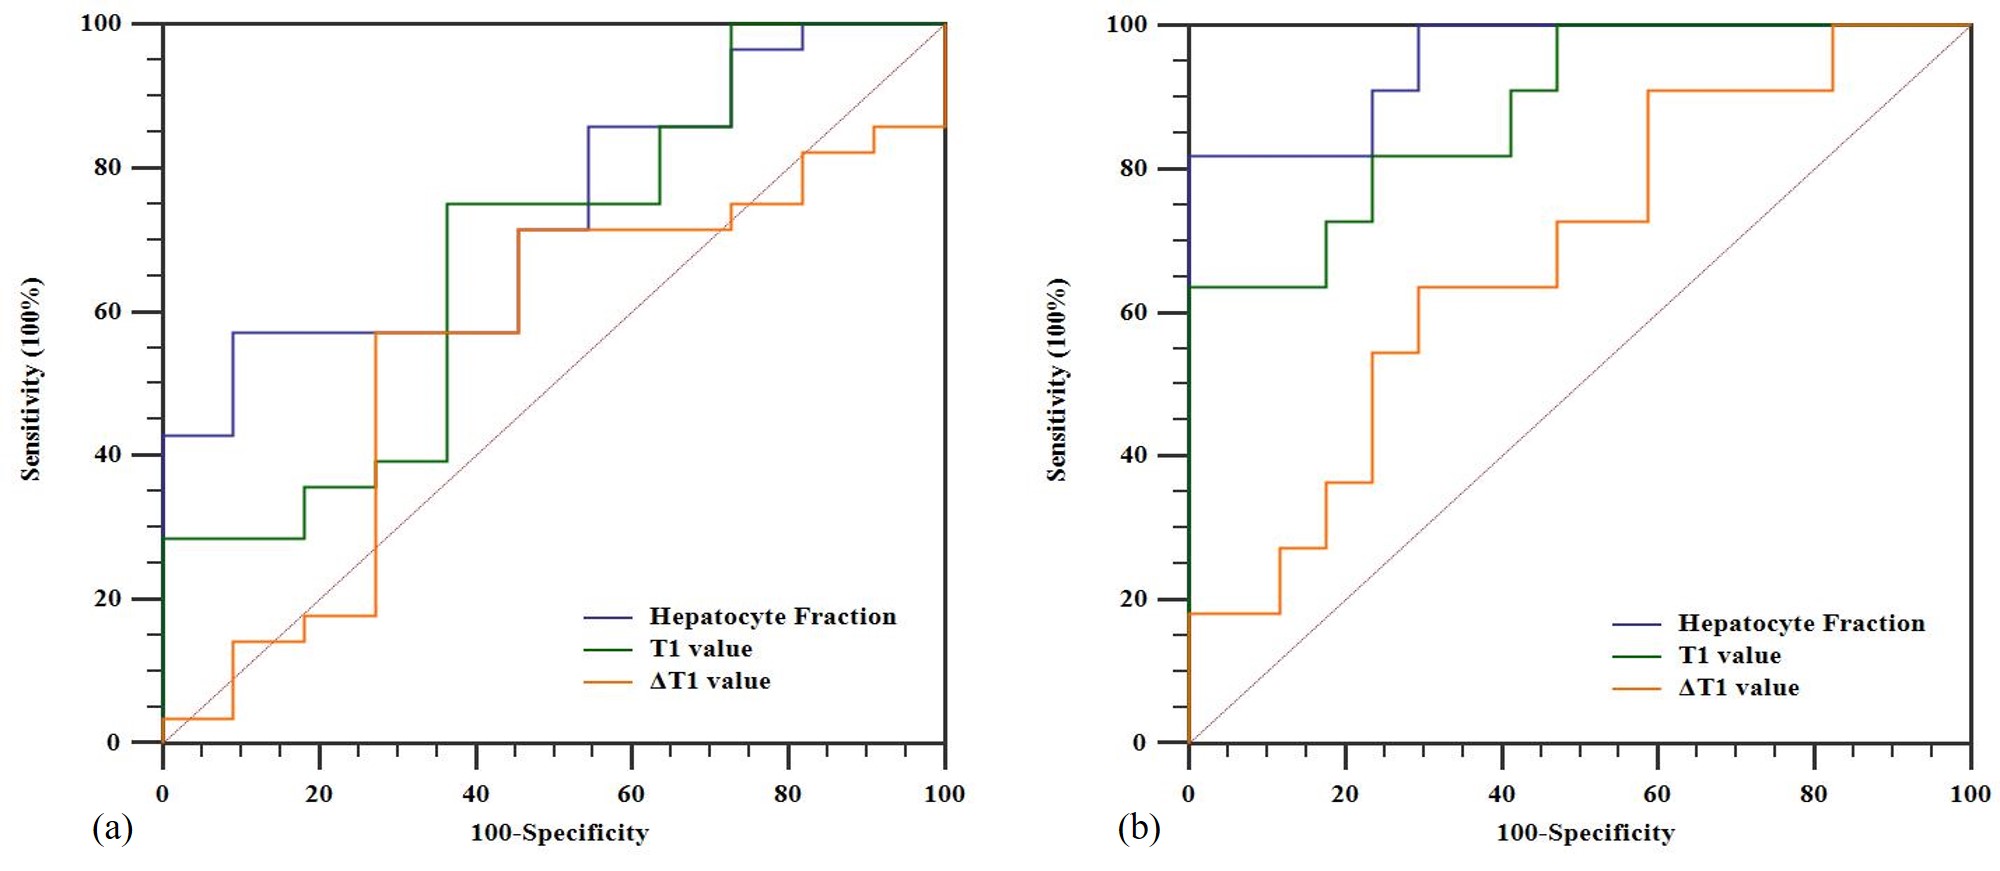
Patients with severe liver fibrosis showed higher T1 value and lower HepF. Among the groups of non-fibrosis, mild fibrosis and severe fibrosis, there were statistically significant difference in T1 value (P < 0.001) and HepF (P < 0.001), but no statistical different in ΔT1 value (P = 0.28). In intergroup pairwise comparisons, there were significant difference between non-fibrosis and severe fibrosis, mild fibrosis and severe fibrosis in HepF and T1 value. Graphs were designed to show the comparison of HepF, T1 value and ΔT1 value among the groups (Figure 1). Figure 2 showed the HepF mapping for different stage of liver fibrosis. HepF achieved the best performance in differentiation of liver fibrosis from non-fibrosis (AUC = 0.74), and mild liver fibrosis from severe liver fibrosis (AUC = 0.95). The ROC curves were shown in Figure 3.Discussion
Over the progress of liver fibrosis, the volume of hepatocyte would shrink, and accompanied with increase of extracellular collagenous matrix. In HepF pharmacokinetic model, the signal changes of blood and extracellular extravascular space between pre and post contrast images were normalized by the measurement of the ΔR1 in the spleen. Therefore, HepF can reflect the change of hepatocyte volume. As we expect, HepF can be used to assess the degree of liver fibrosis accurately, with higher performance compared to quantitative T1 method.Conclusion
The HepF based on a pharmacokinetic model using the T1 values pre and post-Gd-EOB-DTPA administration can potentially be used for quantitative assessment of liver fibrosis.Acknowledgements
No acknowledgement found.References
1. Dahlqvist Leinhard, O., Dahlstrom, N., Kihlberg, J., et al. Quantifying differences in hepatic uptake of the liver specific contrast agents Gd-EOB-DTPA and Gd-BOPTA: a pilot study. Eur Radiol 22(3): 642-653.
2. Okuaki T., Morita K., Namimoto T. et al. Comparison of the Hepatocyte Fraction and Conventional Image Based Methods for the Estimation of Liver Function. ISMRM, 2016 proc.
3. Okuaki T., Morita K., Namimoto T. et al. Assessment of the Hepatocyte Fraction for estimation of liver function. ISMRM, 2017 proc.
Figures