1738
Quantitative MRI to assess portal hypertension in cirrhosis patients at 3T1Sir Peter Mansfield Imaging Centre, University of Nottingham, Nottingham, United Kingdom, 2NIHR Nottingham Biomedical Research Centre, University of Nottingham, Nottingham, United Kingdom
Synopsis
We have previously validated MRI as a surrogate measure of Hepatic Venous Pressure Gradient (HVPG) at 1.5T using T1 relaxation time and splanchnic haemodynamics. Here, we explore the use of quantitative 3T MRI to assess portal hypertension. A strong correlation between HVPG and fat suppressed IR SE-EPI T1 (p<0.0001) and a correlation with superior mesenteric artery (SMA) velocity (p=0.02) was observed. MOLLI T1 showed a weak correlation with HVPG (p=0.11) compared with SE-EPI (p<0.001) in a matched patient subset. A fat suppressed IR SE-EPI T1 scheme and SMA velocity can be used as a surrogate for HVPG at 3T.
Purpose
The majority of complications in liver cirrhosis arise from portal hypertension. Hepatic Venous Pressure Gradient (HVPG) [1] is the gold standard method for the assessment of portal hypertension, but is highly invasive and performed only in a restricted number of centres. We have previously validated MRI as a surrogate measure of HVPG at 1.5T using T1 relaxation time and haemodynamics [2]. Here, in a new cohort, we aim to assess quantitative MRI at 3T to assess portal hypertension.Methods
43 patients were prospectively recruited (22 NAFLD/12 ALD/9 other. 59yrs (range 27-83). 27 male) after undergoing a HVPG measurement for clinical indications, MRI was performed within 12 days of a HVPG measurement on a 3T Philips Ingenia DDAS scanner.
MR Protocol:
Balanced Turbo Field Echo (bTFE) localisers were acquired in 3 orthogonal planes to quantify liver and spleen volume and identify vessels of interest. Longitudinal relaxation time (T1) of the liver and spleen was measured using two methods (i) a respiratory triggered inversion recovery fat-suppressed spin-echo EPI scheme (9 axial slices, 10 inversion times (TI) 100 - 1500ms, 58ms temporal slice spacing, acquired in ascending/descending slice order to increase the TI dynamic range [2]) (ii) a 5-3-3 (Philips Cardiac Native) heart-rate triggered modified Look-Locker inversion recovery (MOLLI) scheme [3] (1 slice per breath hold for 4 slices), the acquisition time of each scheme was ~3 minutes. Transverse relaxation time (T2*) of the liver was measured using a multishot-fast field echo (mFFE) sequence (12 echoes, TE1 2.5ms, ΔTE 2.5ms) to assess liver iron content. Liver and spleen fat fractions were measured using mDIXON QUANT (Philips Medical Systems). Phase-contrast (PC)-MRI was used to assess velocity, area and bulk flow in the splanchnic circulation (splenic artery [SPA] and superior mesenteric artery [SMA]) [2].
Data Analysis:
SE-EPI T1 data at each inversion time was motion corrected using a non-rigid body model, and then fit on a voxel-by-voxel basis to generate M0 and T1 maps (MATLAB, Mathworks). MOLLI T1 maps were produced online (Philips Medical Systems, Best NL). mFFE data were fit on a voxel-by-voxel basis to generate T2* maps. Fat fraction maps were created using mDIXON QUANT software (Philips Medical systems, Best NL). Histogram analysis was performed to assess the distribution of T1, T2* and fat within the liver, with the mode of the distribution used to represent tissue T1/T2*/Fat % and FWHM to assess heterogeneity. Q-flow software (Philips Medical Systems) was used to analyse the PC-MRI data to compute mean vessel cross sectional area, velocity, and flux over the cardiac cycle.
Statistical Analysis:
All data was Shapiro-Wilk normality tested, a Pearson correlation test was used for normally distributed data and a Spearman correlation test used for non-parametric data. Coefficients of variance have been assessed previously [4, 5].
Results
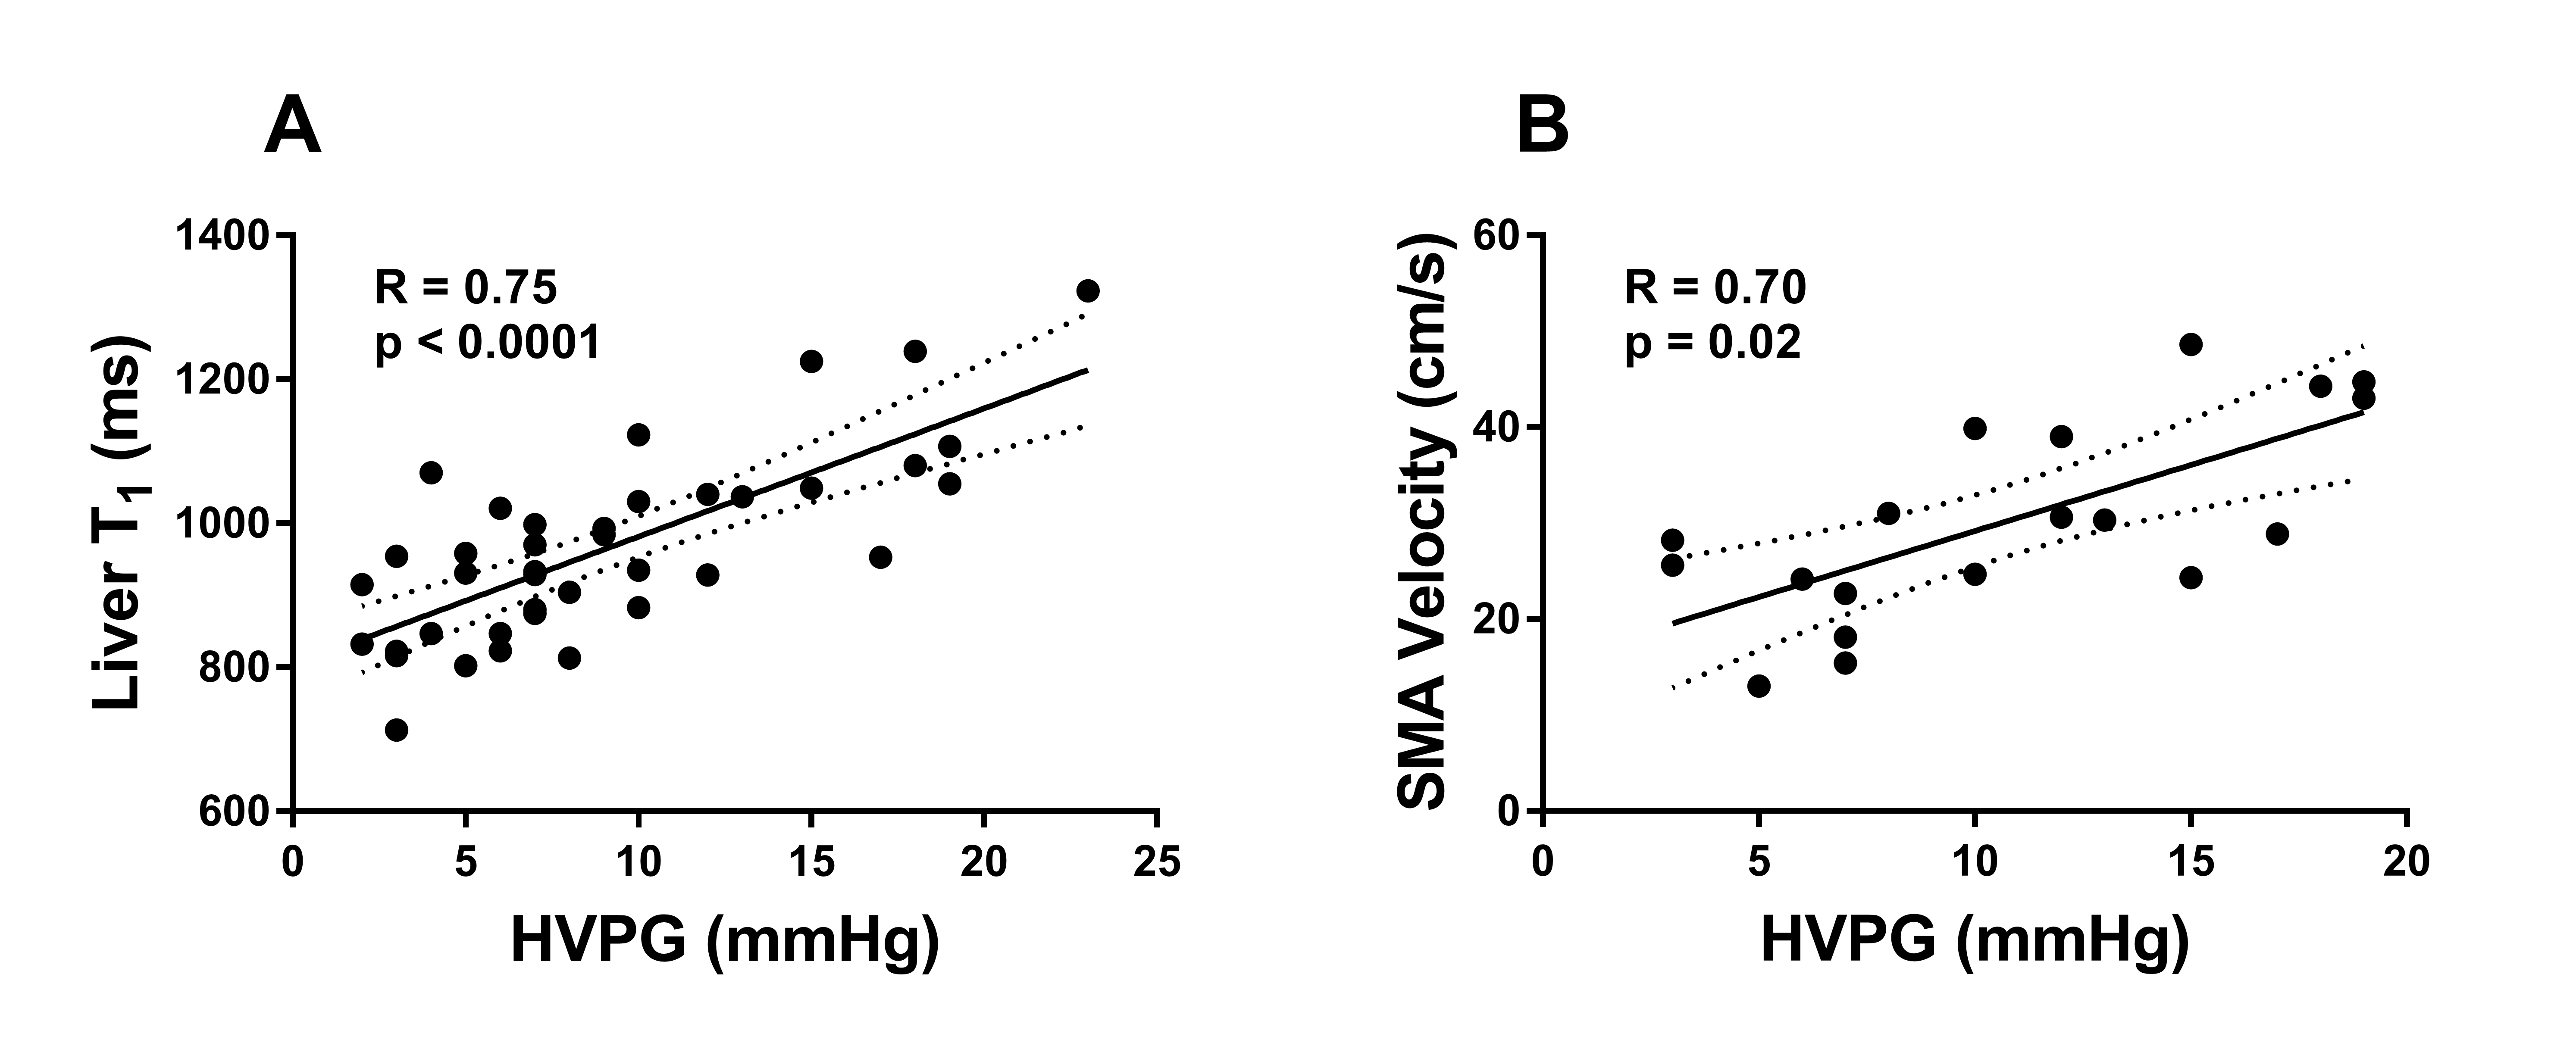
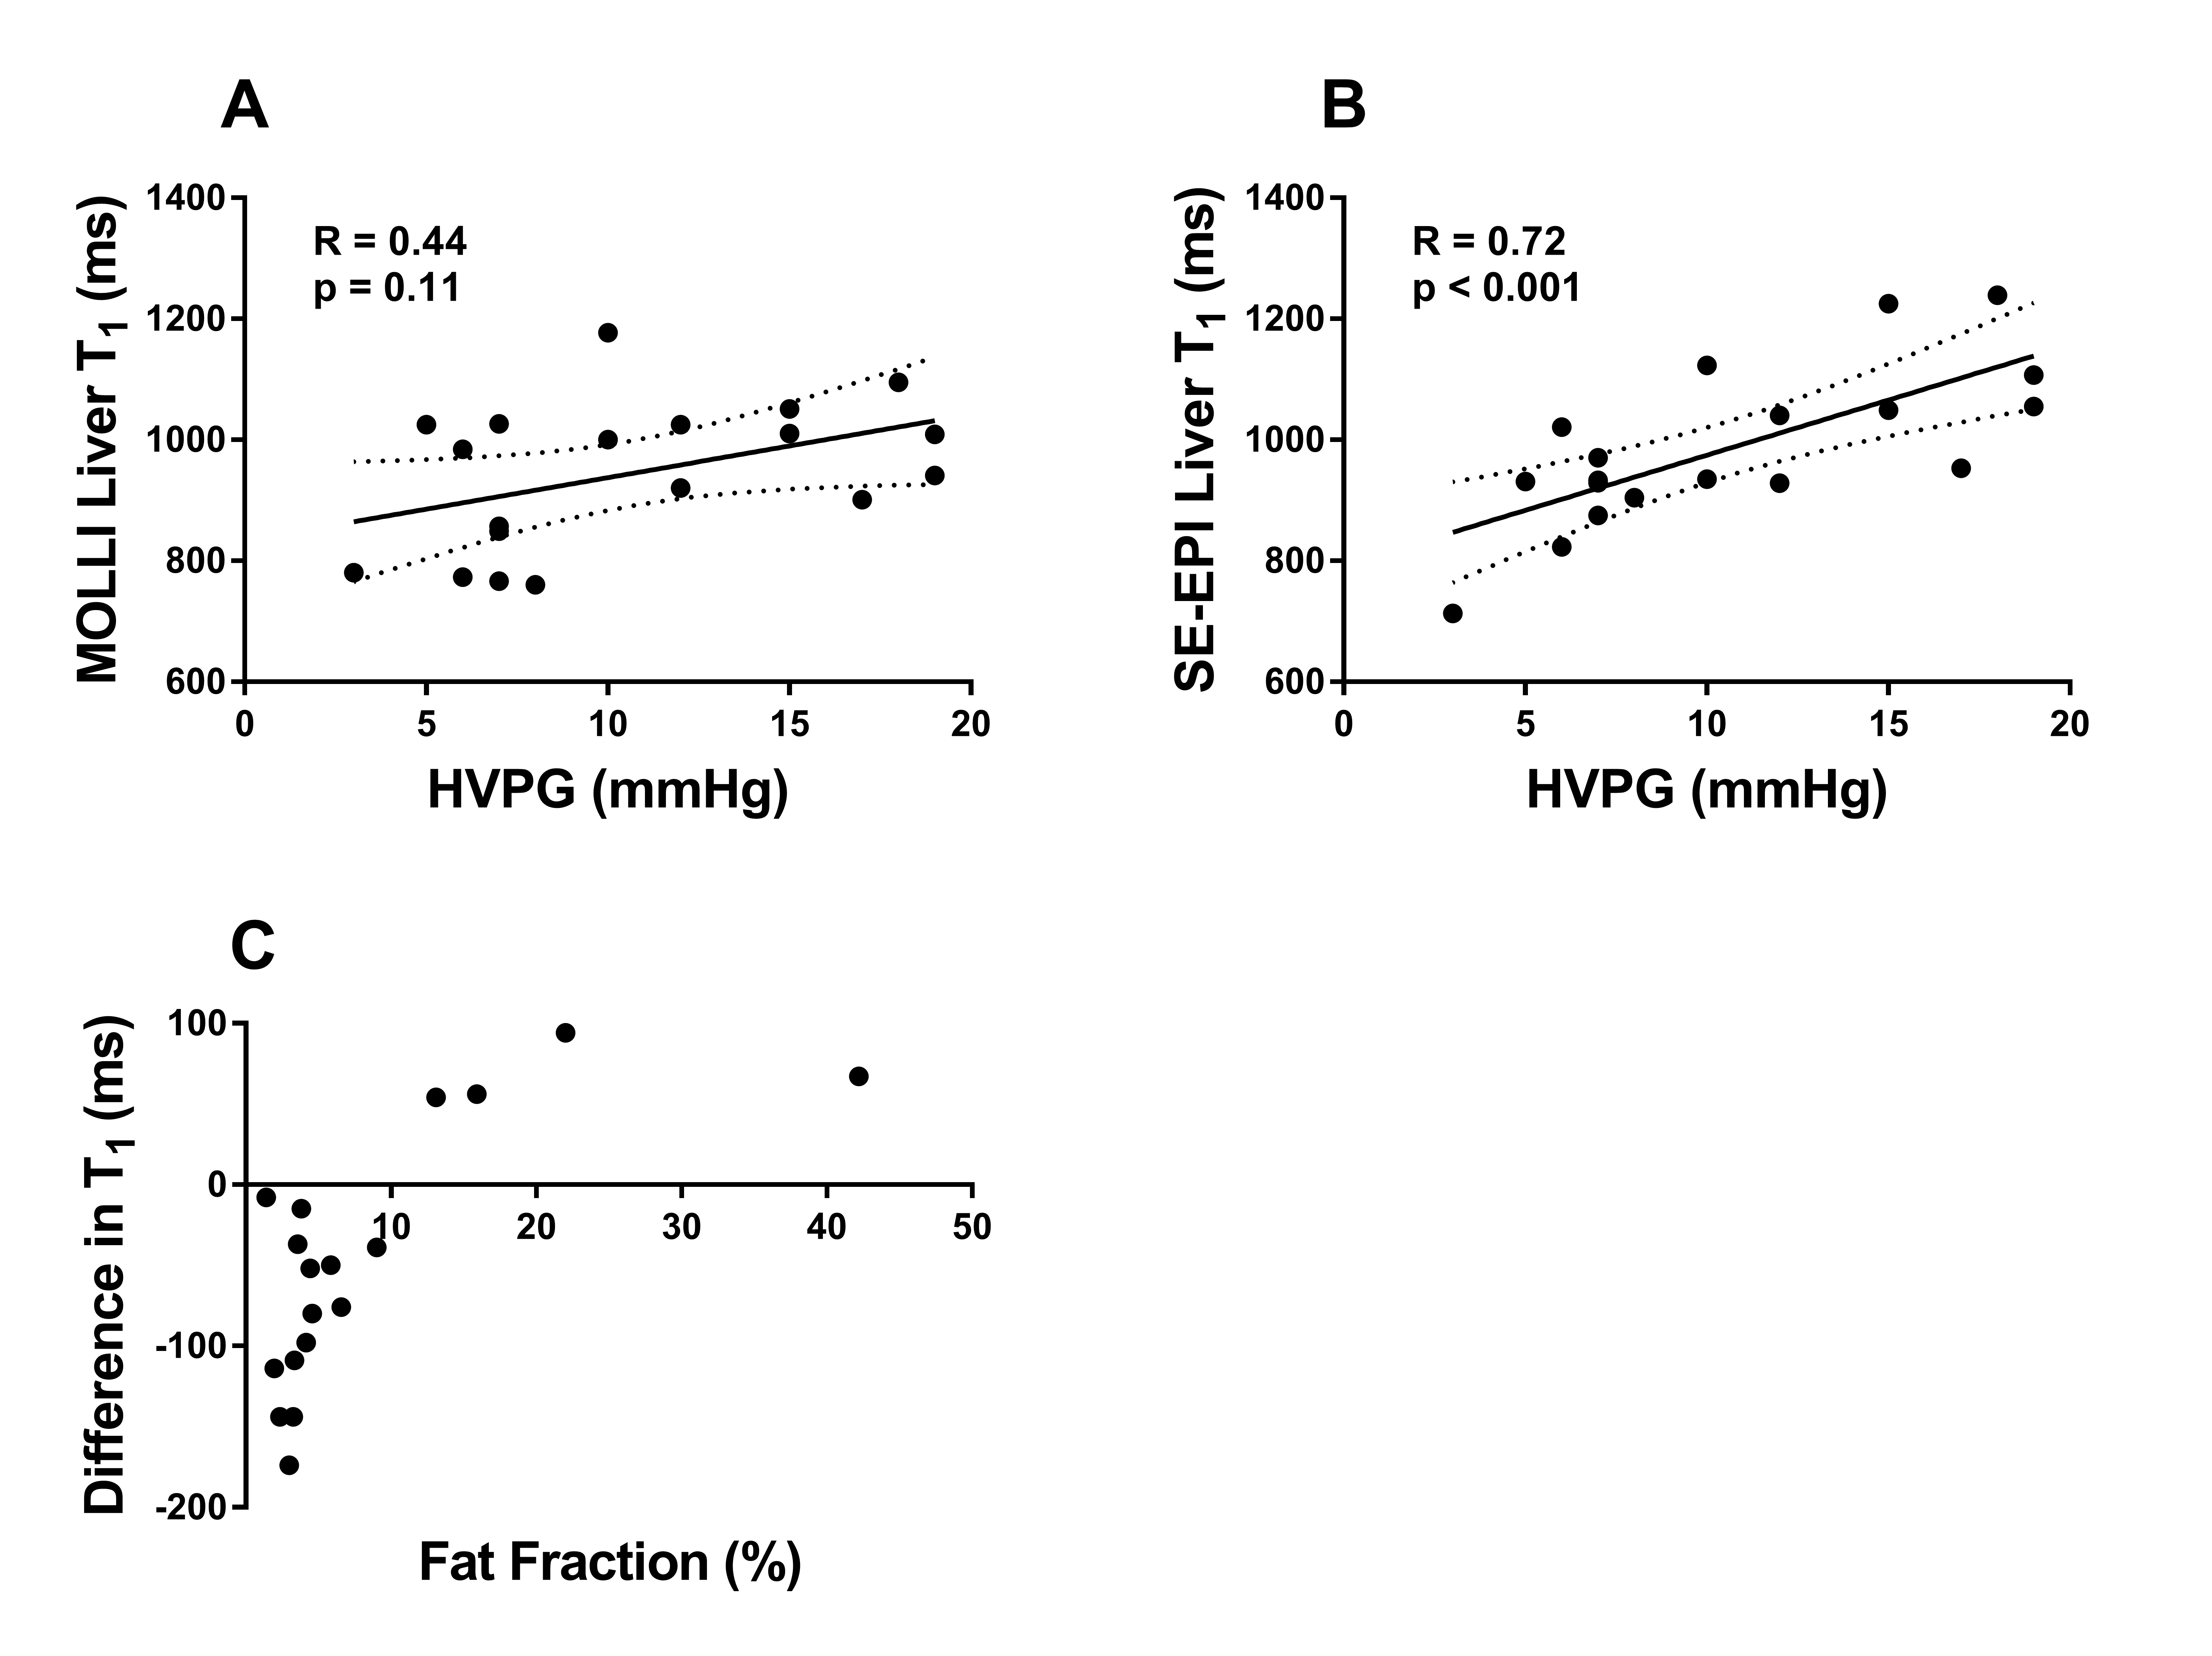
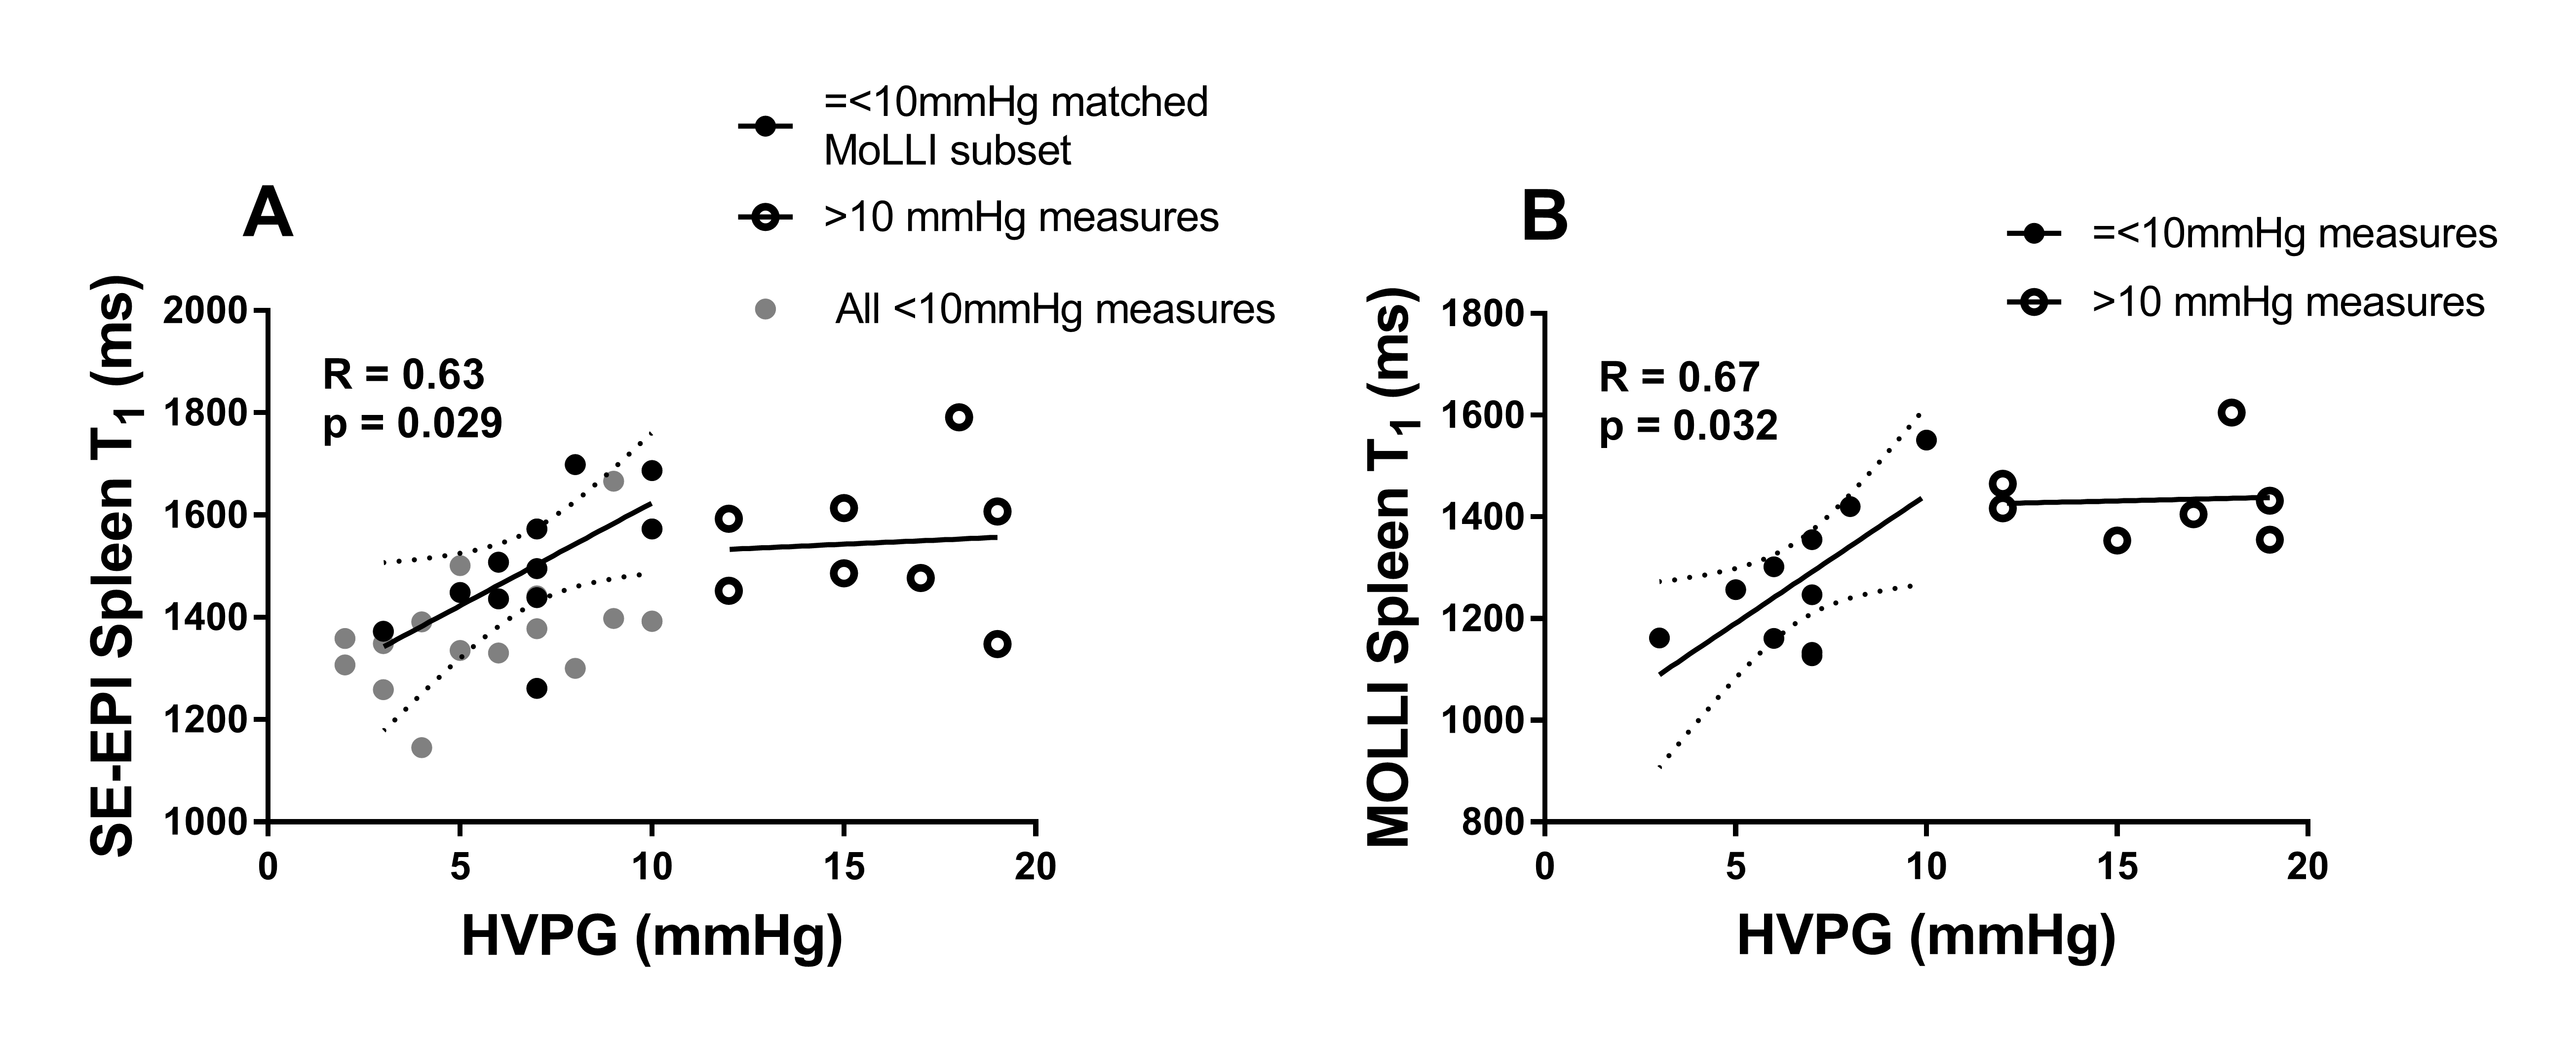
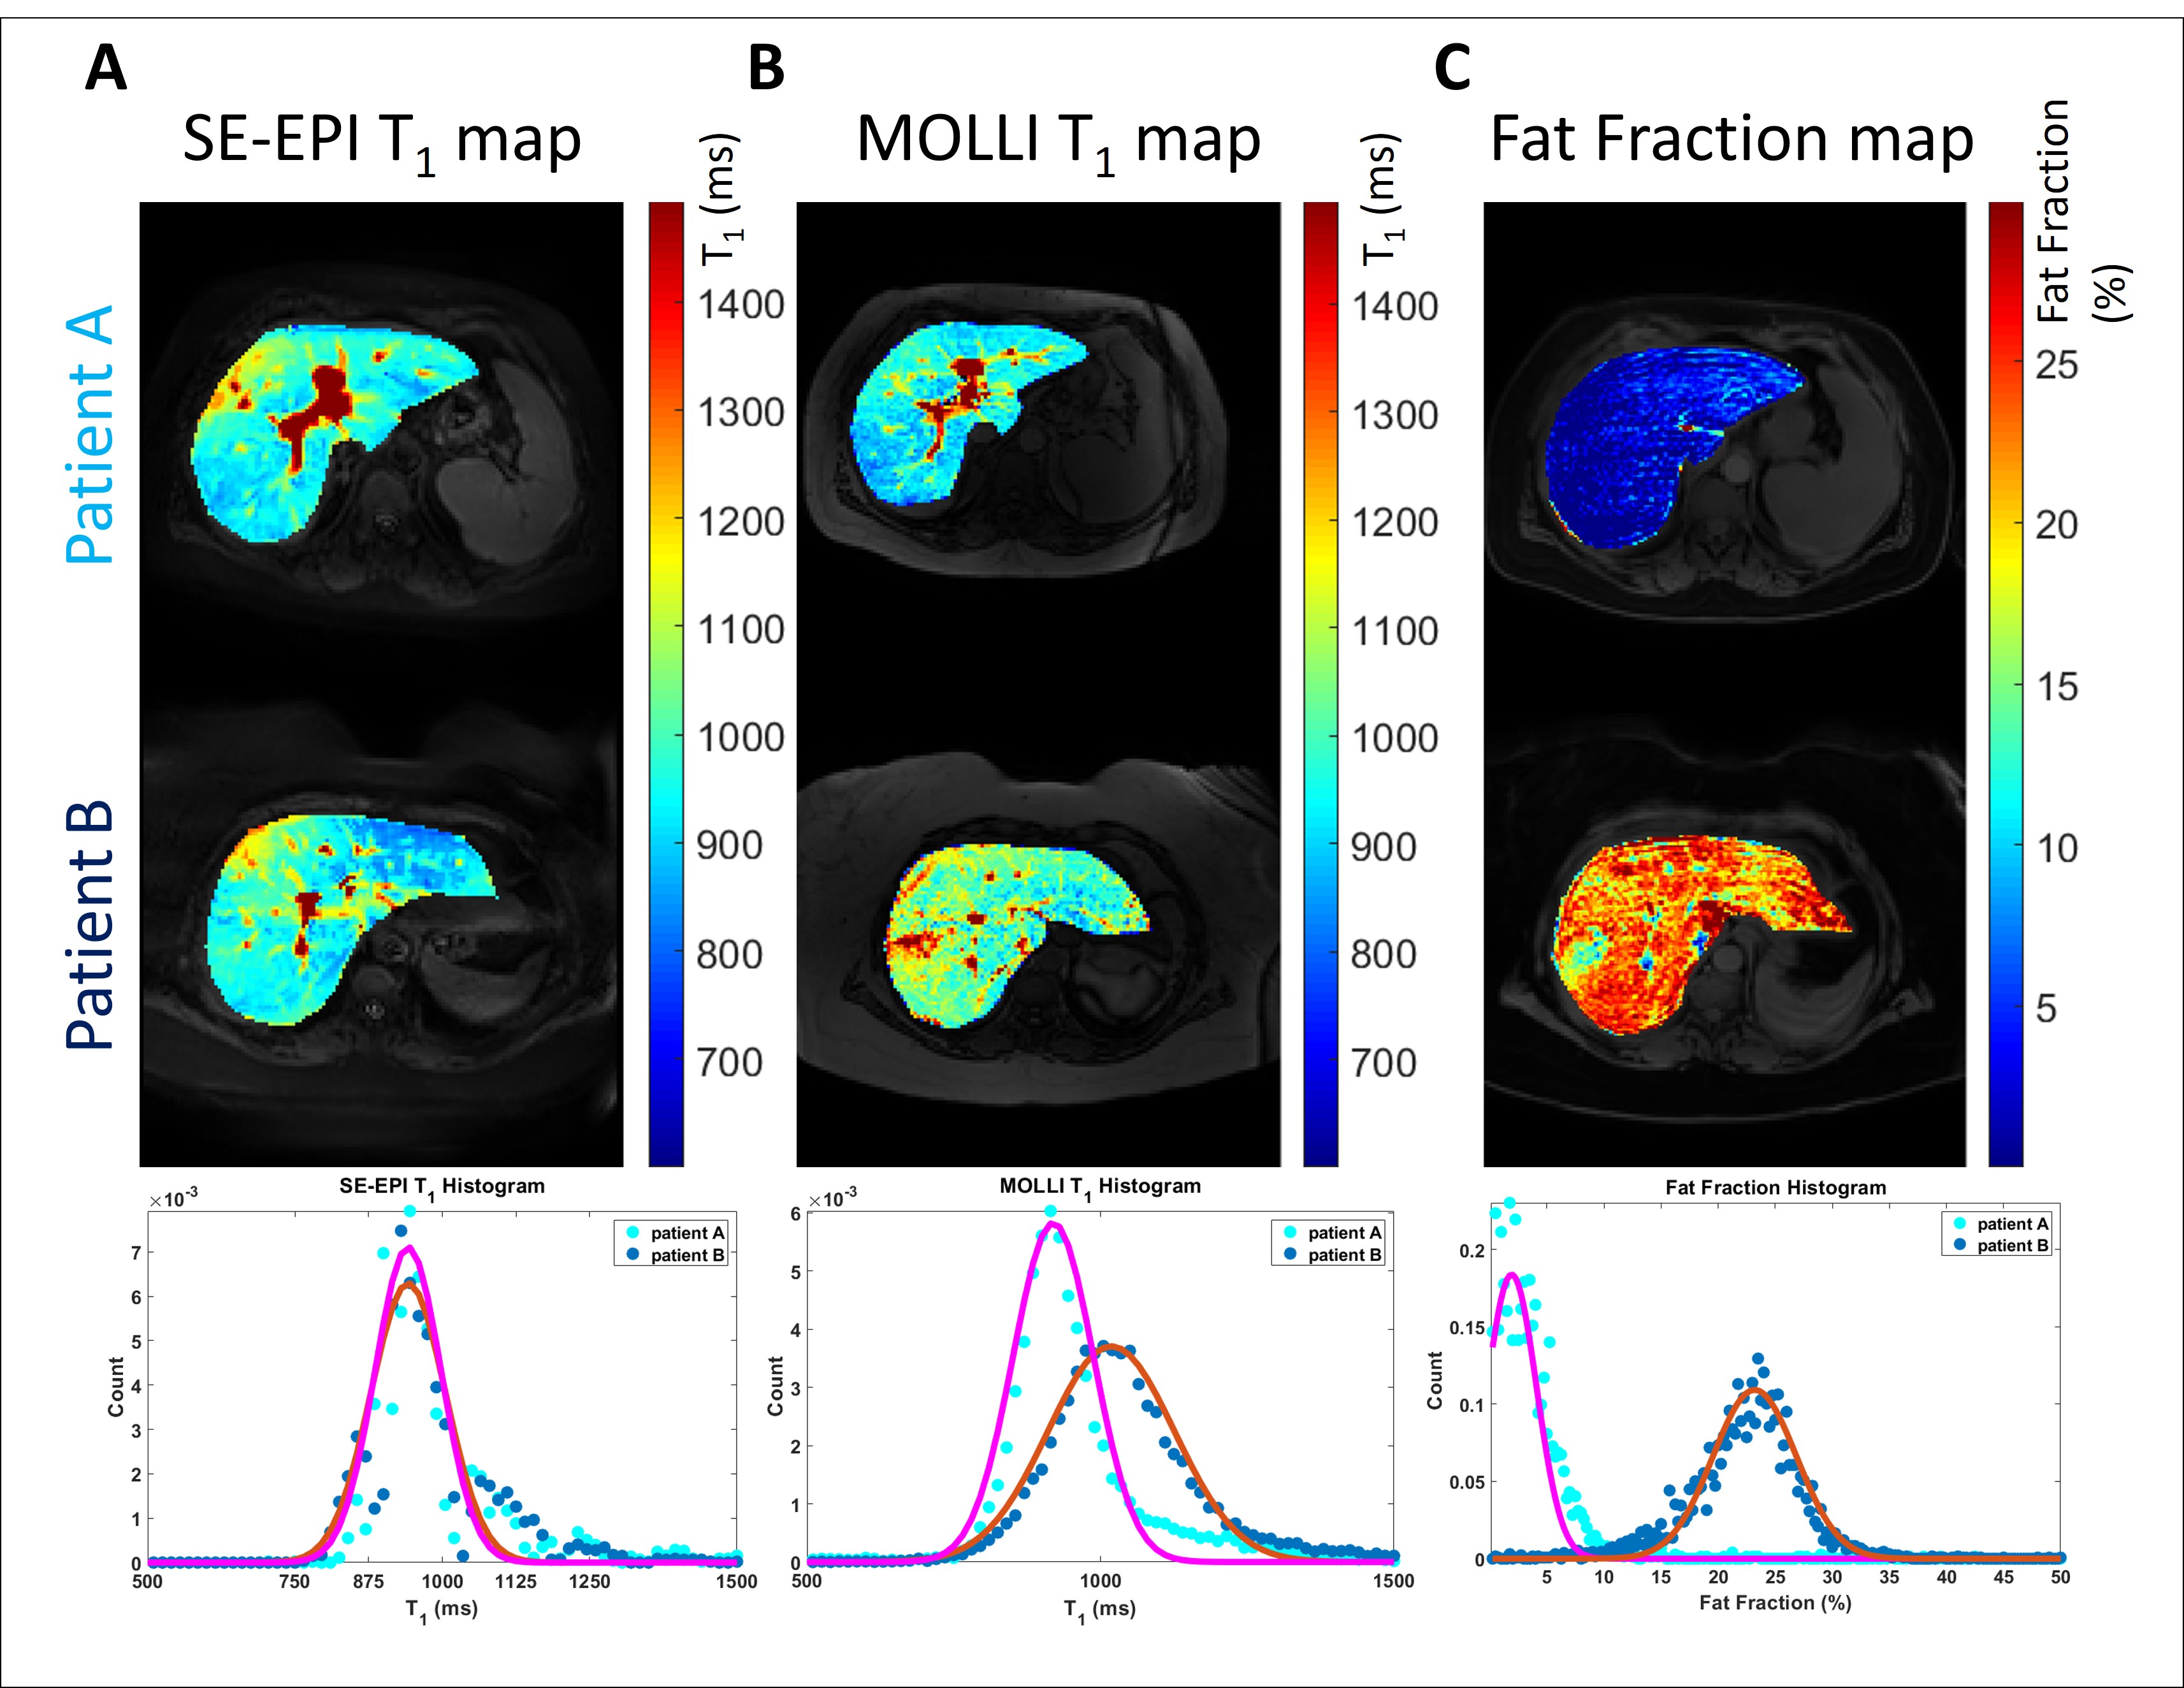
The HVPG measures ranged from 2-23 mmHg, with a strong correlation between HVPG and SE-EPI T1 (p<0.0001) and a correlation with SMA velocity (p=0.02), Figure 1. Figure 2 shows a subset of patients for whom both SE-EPI and MOLLI T1 measurements were collected, MOLLI T1 shows a weak correlation with HVPG (p=0.11) compared with SE-EPI (p<0.001). Further, the difference in measured T1 between the two schemes was associated with fat fraction, a higher fat fraction leading to longer MOLLI T1 (Fig.2C). Splenic T1 as measured by both SE-EPI and MOLLI correlated equally well with HVPG up to a portal pressure of 10mmHg (p=0.029, p=0.032 respectively), >10mmHg no significance was observed (Figure 3). Figure 4 compares two patients with similar liver tissue T1 measured by SE-EPI, but with differing levels of liver tissue fat, illustrating the differing measured MOLLI T1 values.Discussion
In agreement with our work at 1.5T, we have shown that 3T liver tissue T1 as measured with SE-EPI and SMA mean velocity show a good correlation with degree of portal hypertension and so can be used as a surrogate measure to the HVPG test. We show that an IR fat suppressed SE-EPI sequence provides the optimal scheme for evaluating liver tissue T1 when compared to MOLLI, as this method is independent of liver tissue fat (which has previously been shown to limit MOLLI T1 values) [3]. The IR SE-EPI scheme is also free breathing and so is less demanding on the patient. Splenic Tissue T1 has strong correlation for clinically insignificant HVPG measures but cannot be used to predict portal pressure above 10mmHg.Conclusion
As shown at 1.5T, T1 measured using a fat suppressed SE-EPI inversion recovery scheme and SMA mean velocity over the cardiac cycle can be used as a surrogate for the HVPG test at 3T.Acknowledgements
Financial support from NIHR Nottingham Digestive Diseases Biomedical Research Centre, Nottingham University Hospitals NHS Trust and University of Nottingham.References
- Groszmann RJ, Wongcharatrawee S (2004) The hepatic venous pressure gradient: Anything worth doing should be done right. Hepatology 39:280–283 . doi: 10.1002/hep.20062
- Palaniyappan N, Cox E, Bradley C, et al (2016) Non-invasive assessment of portal hypertension using quantitative magnetic resonance imaging. J Hepatol 65:1131–1139 . doi: 10.1016/j.jhep.2016.07.021
- Mozes FE, Tunnicliffe EM, Pavlides M, Robson MD (2016) Influence of fat on liver T 1 measurements using modified Look-Locker inversion recovery (MOLLI) methods at 3T. J Magn Reson Imaging 44:105–111 . doi: 10.1002/jmri.25146
- Cox EF, Palaniyappan N, Aithal GP, et al (2018) Using MRI to study the alterations in liver blood flow, perfusion, and oxygenation in response to physiological stress challenges: Meal, hyperoxia, and hypercapnia. J Magn Reson Imaging. doi: 10.1002/jmri.26341
- Cox EF, Palaniyappan N, Aithal GP, et al (2018) MRI assessment of altered dynamic changes in liver haemodynamics following a meal challenge in compensated cirrhosis. Eur Radiol Exp 2:26 . doi: 10.1186/s41747-018-0056-3
Figures