1736
The quantitative evaluation of Gd-EOB-DTPA enhanced magnetic resonance imaging T1mapping imaging on liver fibrosis1Shanghai Public Health Clinical Center Affiliated to Fudan University, Shanghai, China, 2Philips Healthcare,Shanghai,China, Shanghai, China
Synopsis
Liver biopsy is an invasive inspection method of staging liver fibrosis,but we study was to evaluate a new procedure by injecting a Gd-EOB-DTPA that hepatobiliary specific contrast to stage the liver fibrosis non-invasively.
Objective
To explore and discuss the quantitative evaluation of T1 mapping imaging Gd-EOB-DTPA enhanced magnetic resonance imaging on liver fibrosis induced by hepatitis B virus infection.Methods
A total of 150 patients with chronic hepatitis B were prospectively collected from August 2016 to August 2018. According to liver biopsy, these patients were divided into S1 (N=38), S2 (N=30), S3 (N=33), and S4 (N=49) groups. All the patients were examined with enhanced magnetic resonance imaging of Gd-EOB-DTPA.The T1 mapping images at 5, 10, 15 and 20 minutes after enhancement were obtained by Look-Locker method. The T1 relaxation time (T1), the decreased rate of T1 relaxation time (ΔT1%) and ΔR1% were measured. Univariate analysis of variance (ANOVA) was used to compare between the groups. ROC was used to evaluate the efficacy of T1、ΔT1% and ΔR1% in differentiating S1 and S2+S3+S4, S1+S2 and S3+S4,S1+S2+S3 and S4.Results
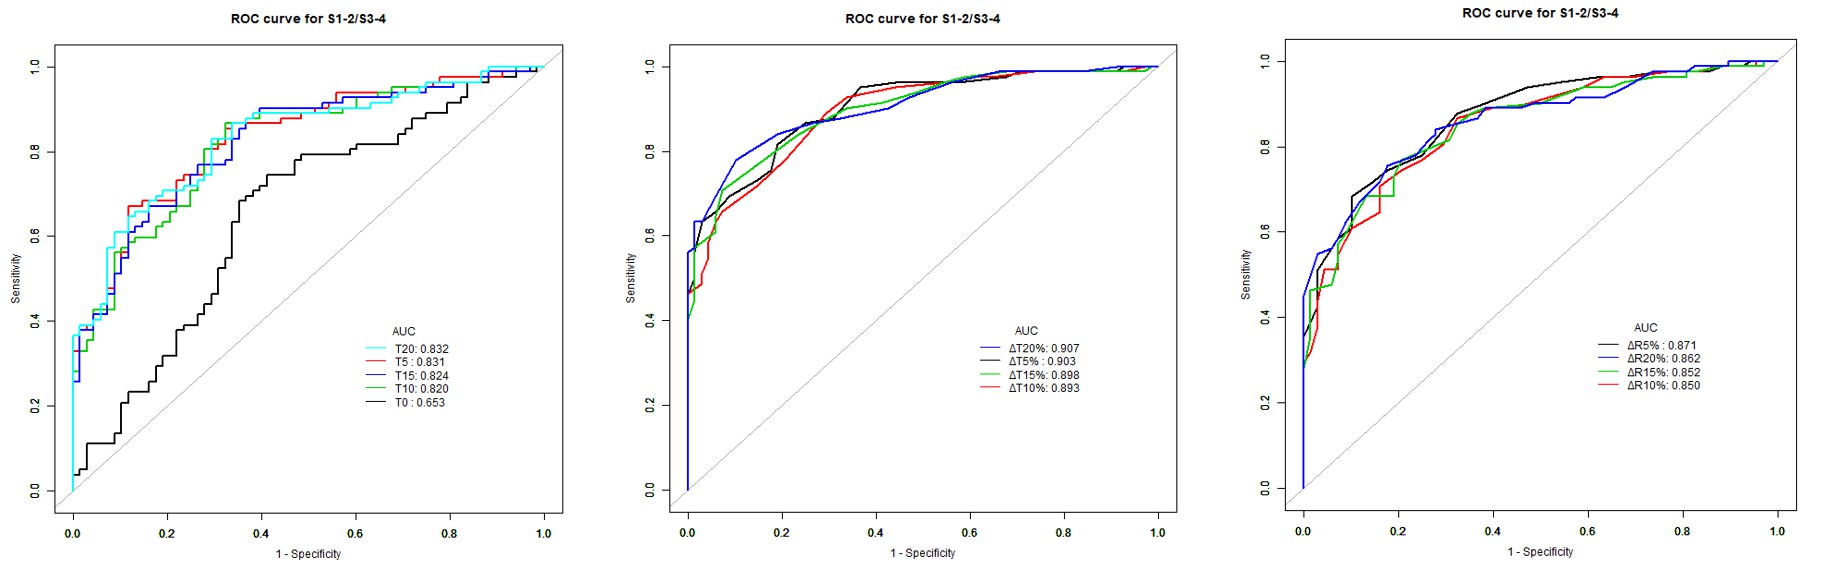
T1, ΔT1% and ΔR1% of each group showed statistical significance in the same degree of fibrosis group, where T1 was decreased gradually, ΔT1% and ΔR1% were increased gradually with the extension of scanning time, and at different scanning time points. Except for T1 relaxation time of plain scan, there was no significant difference between T1, ΔT1% and ΔR1% in the same degree of fibrosis group, while in the same degree of fibrosis group,ΔT1% and ΔR1% were increased gradually. The T1 relaxation time was increased with increase in fibrosis stage, and ΔT1% and ΔR1% were decreased with increased fibrosis stage. There was statistical difference between S4 and other groups in T1, ΔR1%, S3 and other groups at each scanning time of ΔT1%, S1 and other groups of ΔR1%, S1 and S2 were only enhanced at each scan time. There was statistical difference in ΔT1% after 20 minutes. Identification of S1 and S2+S3+S4, the scanning time T1 evaluation area under the ROC of liver fibrosis were 0.646, 0.830, 0.827, 0.831, 0.844, ΔT1% area under ROC were 0.888, 0.889, 0.893, 0.905, ΔR1% area under ROC were 0.866, 0.854, 0.856, 0.869, and the three indexes in the enhanced scanning time evaluation of liver fibrosis, S1 and S2+S3+S4 area under the ROC showed no statistical difference. Identification of S1+S2 and S3+S4, the scanning time T1 evaluation area under the ROC of liver fibrosis were 0.653,0.831,0.821,0.824,0.832,ΔT1% area under ROC were 0.903,0.893,0.898,0.907,ΔR1% area under ROC were 0.871,0.850,0.852,0.862,and the three indexes in the enhanced scanning time evaluation of liver fibrosis, S1+S2 and S3+S4 area under ROC showed no statistical difference.Identification of S1+S2+S3 and S4, the scanning time T1 evaluation area under the ROC of liver fibrosis were 0.581, 0.849, 0.837, 0.842, 0.853, ΔT1% area under ROC were 0.888, 0.878, 0.884, 0.897, ΔR1% area under ROC were 0.873, 0.856, 0.861, 0.873, and the three indexes in the enhanced scanning time evaluation of liver fibrosis, S1+S2+S3 and S4 area under ROC showed no statistical difference.Discussion
Gd-EOB-DTPA is a hepatocyte specific contrast agent that shortens the T1 relaxation time. About 50% of Gd-EOB-DTPA can transport organic anion transport polypeptides OATP1B1 and OATP1B3 into normal hepatocytes through organic anion transport peptides on the liver cell membrane(1), but the extracellular space is still accumulated a part(2). The T1 relaxation time and its related parameters before and after enhancement not only reflected the uptake of contrast agent by hepatocytes, but also reflected the volume of extracellular space. Hepatic fibrosis resulted in decreased expression of OATP1B1 on the liver cell membrane, thereby reducing the uptake(3). The more fibrous tissue is deposited in the extracellular space, the more it enters the liver in a unit time. The smaller the cell mass is, the smaller is the T1 effect, showing gradually increased T1 with increased stage. In identifying fibrosis in each group, the area under the ROC with ΔT1% scan time was nearly 90%, sensitivity, specificity and accuracy were more than 80%, showing good evaluation value. There was no significant difference in the evaluation of hepatic fibrosis between different scanning time points after enhancement. It may be due to that the liver function of the patients with hepatic fibrosis is light, the deposition of fibrosis is not significant, and the liver cells have strong compensatory function.Conclusion
T1 mapping with Gd-EOB-DTPA enhanced magnetic resonance imaging demonstrated good evaluation effect on liver fibrosis caused by HBV infection and is expected to shorten the scanning time of liver fibrosis patients.Acknowledgements
No acknowledgement found.References
[1] Van Beers BE, Pastor CM, Hussain HK. Primovist, Eovist: what to expect. J Hepatol. 2012. 57(2): 421-9.
[2] Goodwin MD, Dobson JE, Sirlin CB, Lim BG, Stella DL. Diagnostic challenges and pitfalls in MR imaging with hepatocyte-specific contrast agents. Radiographics. 2011. 31(6): 1547-1568.
[3] Tsuda N, Harada K, Matsui O. Effect of change in transporter expression on gadolinium-ethoxybenzyl-diethylenetriamine pentaacetic acid-enhanced magnetic resonance imaging during hepatocarcinogenesis in rats[J]. J Gastroenterol Hepatol, 2011, 26(3): 568-576. DOI:10.1111/j.1440-1746.2010.06494.x.
Figures