1733
Comparison of Spin-echo Echo-planar imaging (SE-EPI) MR elastography (MRE) and Gradient-recalled echo (GRE) MRE at 3.0T in pediatric nonalcoholic fatty liver disease (NAFLD)1Radiology, Children's Hospital Los Angeles, Los Angeles, CA, United States, 2Philips Healthcare North America, Gainesville, FL, United States, 3Pediatrics, Children's Hospital Los Angeles, Los Angeles, CA, United States
Synopsis
Currently, most MRE performed clinically at 3.0T uses a GRE sequence. However, recent literature describes susceptibility effects from fat that may confound MRE performance, especially at 3.0T. SE-EPI is a faster technique that is less sensitive to susceptibility artifacts and signal loss and has recently been developed at 3.0T. In this work, we compare measures of liver stiffness between SE-EPI and GRE MRE techniques in pediatric patients with NAFLD at 3.0T.
Introduction
MRE is a noninvasive measurement of hepatic stiffness that has been shown to correlate with histopathologic grading of fibrosis 1. Currently, GRE based MRI is the standard pulse sequence for 3.0T MRI. However, GRE MRE is limited at 3.0T by susceptibility effects (T2*), which result in signal loss 2. This is particularly problematic in the setting of elevated liver fat, such as NAFLD, a population at risk for developing hepatic fibrosis. SE-EPI has been developed as an alternative method of performing MRE that is faster and less susceptible to susceptibility effects and signal loss.Materials and Methods
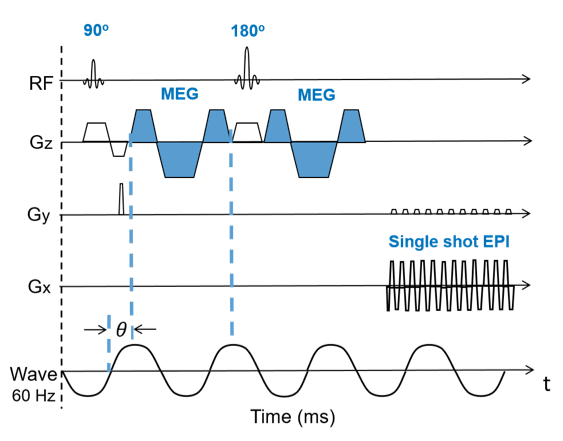
The SE-EPI MRE sequence was provided by Philips (Best, Netherlands) as shown in Fig 1. To impart motion sensitivity to the measured MR signal, a single shot spin-echo EPI sequence was modified to add motion encoding gradients (MEG, 16.7ms and 18mT/m) on both sides of the refocusing pulse in the slice direction. Similar to phase contrast MRI, the polarity of the MEGs alternates every TR to encode tissue motion in the measured signal phase. Phase synchronization between the MEGs and the applied external mechanical waves was achieved by means of TTL trigger pulse generated in the pulse sequence. A total of four phase offsets were acquired for each slice.
We retrospectively reviewed all cases of NAFLD who had MRE at our institution over a 4-month period in accordance with the local institutional review board protocol. Ten NAFLD pediatric patients (ages 10-19; 7 male and 3 female) were scanned using both GRE and SE-EPI MRE. All MREs were performed on a Philips Ingenia 3.0T scanner (Best, Netherlands). Both anterior and posterior coil arrays were used. The GRE MRE scan parameters were: TR=50ms; TE=22ms; FA =30°; acquisition matrix=256 x 64; and the SE-EPI MRI scan parameters were: TR=1000ms; TE=58ms; FA=90°; acquisition matrix =64x64. Four axial slices through the liver were acquired for each sequence with 8mm slice thickness and 2.5 mm gap; SENSE=2; Driver frequency = 60Hz. The scan time was 60s for GRE MRE (4 breath holds) and 19s for SE-EPI MRI (a single breath hold).
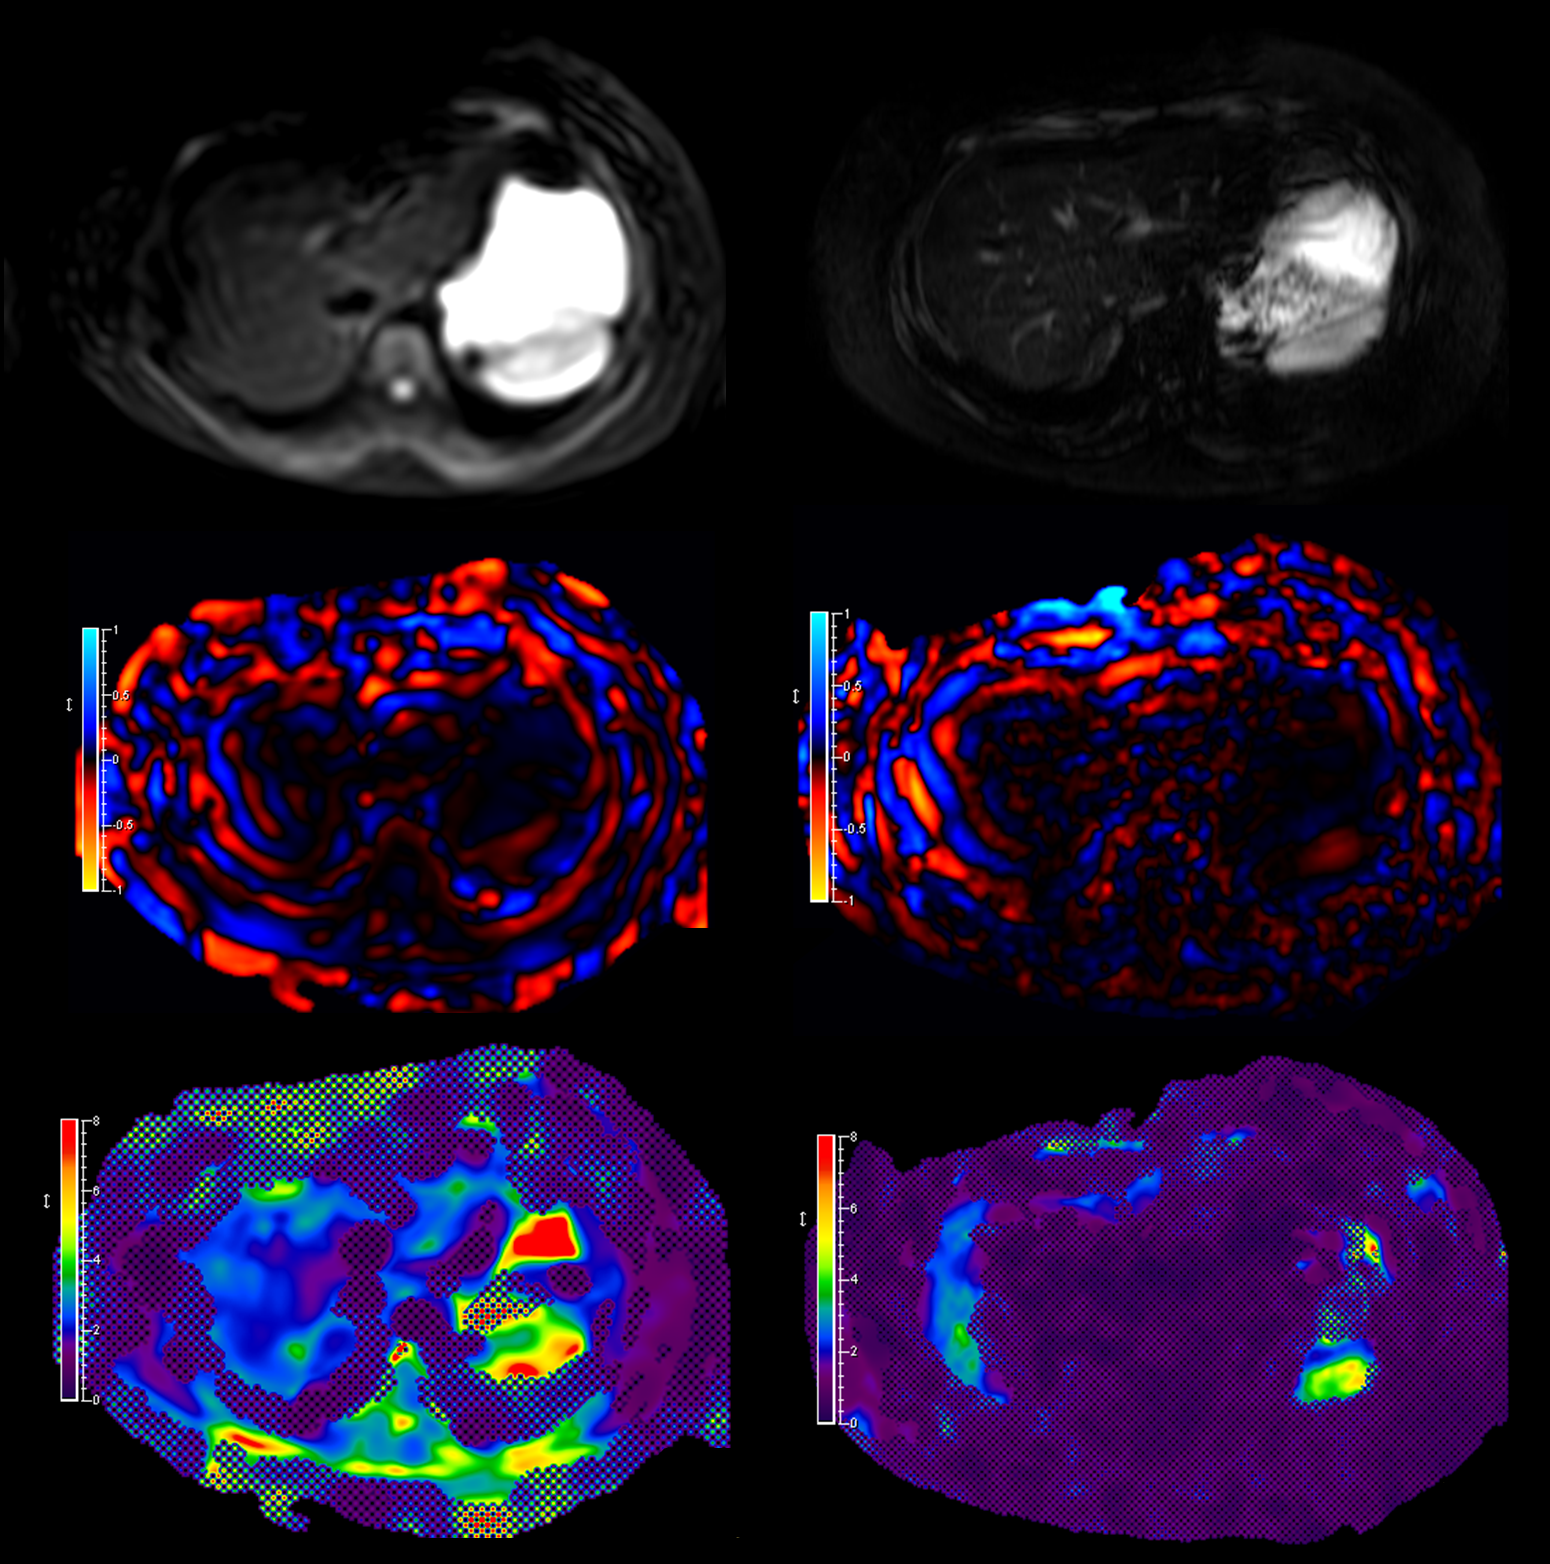
MR elastograms were automatically generated on the vendor platform using a multimodal direct inversion (MMDI) algorithm (Mayo Clinic, Rochester, MN). Region of interest (ROI) was drawn by two experienced pediatric radiologists in consensus to include as much liver tissue as possible. The final liver stiffness (kPa) was calculated as the average stiffness across all four slices. The size of the 95% confidence map was also recorded.
Results
The mean fat fraction of the study population was 19.3%. The mean R2* of the study population was 52 Hz. Mean liver stiffness measured by GRE MRE was 2.74 ± 0.71 kPa and mean liver stiffness measured by SE-EPI MRE was 2.77 ± 0.76 kPa. There was no significant difference in mean liver stiffness between the two sequences (p = 0.42). The mean measurable ROI volume determined by the 95% confidence map was significantly larger for SE-EPI (7596 ± 2281 [SD] mm2 than for GRE (3723 ± 1022 [SD] mm2 (P<0.001).Conclusion
We demonstrate that there is no significant difference between measures of liver stiffness obtained by GRE MRE and SE-EPI MRE at 3.0T in children with NAFLD. However, the measurable ROIs were significantly larger with SE-EPI MRE, which may provide a better estimate of overall liver stiffness and minimizes limitations related to sampling errors.Acknowledgements
No acknowledgement found.References
1. Trout AT, Sheridan RM, Serai SD, et al. Diagnostic Performance of MR Elastography for Liver Fibrosis in Children and Young Adults with a Spectrum of Liver Diseases. Radiology. 2018; 287(3):824-832.
2. Trout AT, Serai SD, Mahley AD, et al. Liver Stiffness Measurements with MR Elastography: Agreement and Repeatability across Imaging Systems, Field Strengths, and Pulse Sequences. Radiology. 2016; 281(3):793-804.
Figures