1732
Three-dimensional MR Elastography (MRE) can replace 2D MRE in staging liver fibrosis: Noninferiority test of the area under the ROC curve and comparison of image quality.1Department of Radiology, The third affiliated hospital of Sun Yat-sen University, Guangzhou, China, 2South China Normal University, Guangzhou, China, 3Department of Pathology, The third affiliated hospital of Sun Yat-sen University, Guangzhou, China, 4Department of Radiology, Mayo Clinic, Rochester, MN, United States, 5MR Research China, GE Healthcare, Beijing, China
Synopsis
2D MR elastography (MRE) has been shown to be the most accurate noninvasive technique for the detection and staging of liver fibrosis. Tissue stiffness quantification based on 3D MRE is theoretically more accurate while having comparable diagnostic accuracy for staging fibrosis. Our results showed that the diagnostic performance of 3D MRE is not inferior to 2D MRE in assessing liver fibrosis by using a noninferiority test of the area under the ROC curve based on the restricted maximum likelihood (REML) method. Moreover, 3D MRE had better image quality and has the potential to replace 2D MRE in clinical applications.
Introduction
Two-dimensional (2D) gradient-recalled echo (GRE) and spin-echo (SE) MR elastography (MRE) are noninvasive techniques with proven efficacy for the detection and stratification of liverfibrosis1-5. Tissue stiffness quantification based on 3D MRE methods is theoretically more accurate than 2D MRE because it requires fewer assumptions about the polarization and propagation direction of the waves and thus can handle more complex shear wave motion in organs6. Most of the previous 2D vs. 3D MRE comparison studies were superiority studies (which conclude a superiority when the P value is less than 0.05, but cannot conclude a similarity when the P value is greater than 0.05), but this superiority of the 3D MRE technique did not show up in improved clinical diagnostic accuracy7-10. It is still unknown whether the diagnostic performance of 2D MRE in liver fibrosis staging is inferior to 3D MRE and whether 3D MRE can eventually replace 2D MRE. Our hypothesis was that the diagnostic performance of 3D MRE was not inferior to 2D MRE. Therefore, the purpose of our study was to conduct a noninferiority test of the area under the ROC curve (AUC) based on restricted maximum likelihood (REML)11 instead of a superiority test to investigate this question and to compare the imaging quality of 2D and 3D MRE.Methods
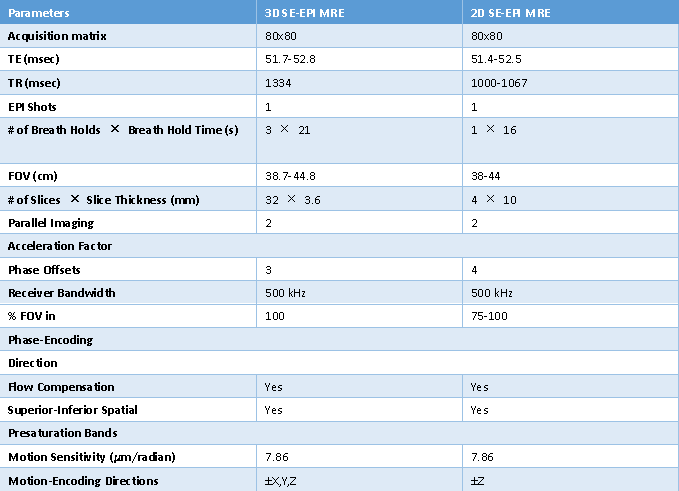
Following ethics committee approval and waiver of consent, 272 HBV-infected adults (median age 50 years, range 18-78 years; 85.5% men) who successfully underwent both 2D and 3D SE-EPI MR elastography on a 3.0T clinical scanner (Discovery MR 750, GE Healthcare, Milwaukee, WI) were retrospectively enrolled, 11 patients were excluded due to technique failure (a loose and disconnected driver). Of the 261 patients, 40 of them underwent 2D and 3D MRE exams twice on the same day and were only used to evaluate the reproducibility of the stiffness measurements. The remaining 221 patients with pathologically confirmed fibrosis (F0-4 METAVIR system) underwent one exam with both 2D and 3D MRE were used to evaluate image quality and diagnostic performance. In the context of this study, the acquisition parameters were shown in Table 1. Two analyzers manually selected ROIs in the right lobe of the liver using the MRE magnitude, wave, and stiffness images while avoiding major vessels, focal liver lesions, liver boundaries, and regions with significant wave interference or artifacts. The image quality of the two MRE techniques was evaluated by two analyzers by consensus and scored using the following definitions: 0= “Acceptable”and “1”= “Excellent”. AUCs were compared using a noninferiority test based on REML of a binormal ROC model of paired data (H0: AUC2D – AUC3D ≥ -0.1; H1: AUC2D - AUC3D < -0.1; noninferiority margin: 0.1).Results
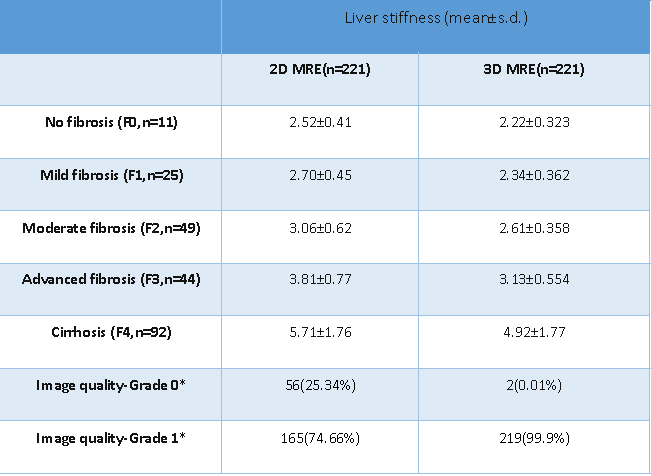
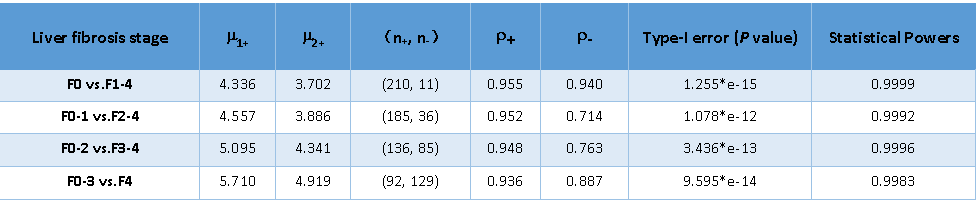
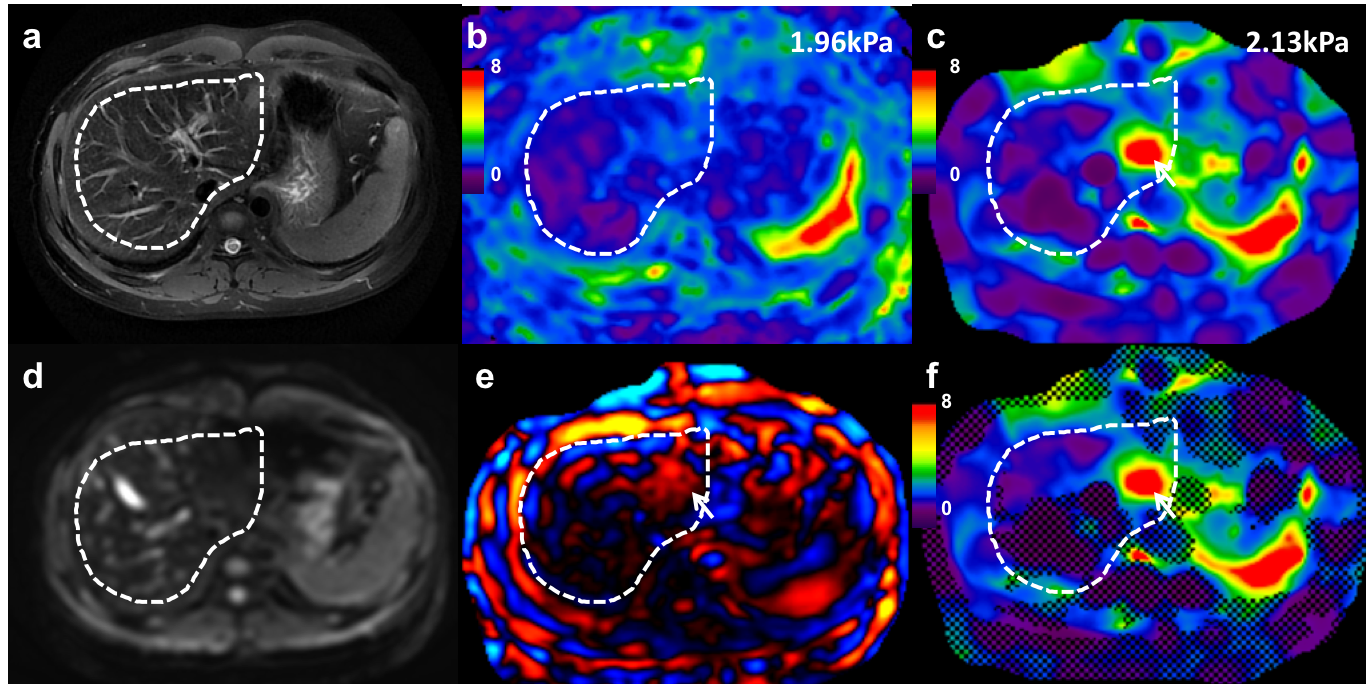
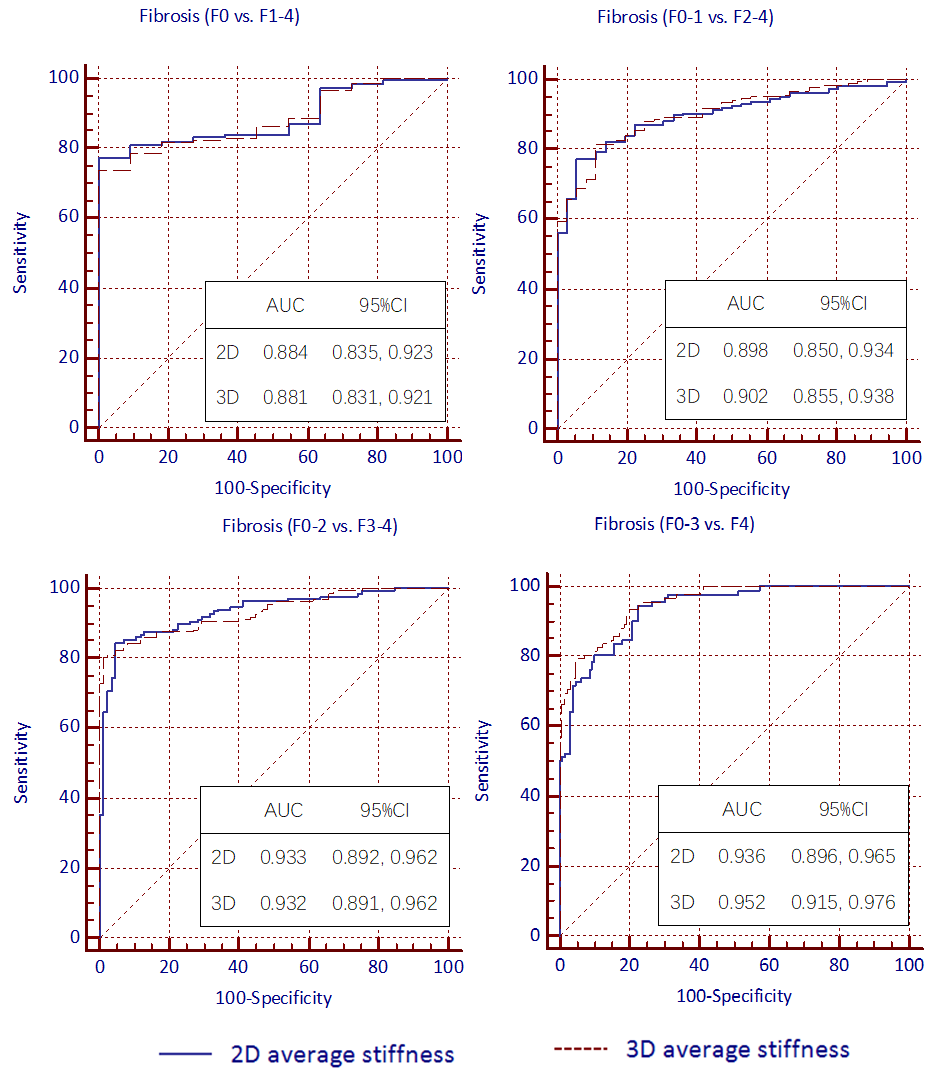
In the group of 40 patients, the intraclass correlation (ICC) for the liver stiffness measured using 2D and 3D SE-EPI MRE was 0.989 (95% CI: 0.983 - 0.993) and 0.991 (95% CI: 0.986 - 0.994), respectively. In the group of 221 patients, the patient stratification for each fibrosis stage and image quality score between 2D and 3D MRE were shown in Table 2. The image quality in 3D MRE was better than 2D MRE (P < 0.01) (Table 2) (Figure 1). The AUCs for discriminating ≥F1, ≥F2, ≥F3, ≥F4 fibrosis stage with 2D MRE were 0.884 (95% CI: 0.835, 0.923), 0.898 (95% CI: 0.850, 0.934), 0.933 (95% CI: 0.892, 0.962), 0.936 (95% CI: 0.896, 0.965) and with 3D MRE were 0.881 (95% CI: 0.831, 0.921), 0.902 (95% CI: 0.855, 0.938), 0.932 (95% CI: 0.891, 0.962), 0.952 (95% CI: 0.915, 0.976), respectively (Figure 2). Noninferiority testing of different fibrosis stages from F0 vs. F1-4 to F0-3 vs. F4 with the noninferiority margin of 0.1 showed the diagnostic performance of 3D MRE was not inferior to 2D MRE (all P>0.05) (Table 3).Discussion
The results of this study show that both 2D and 3D MRE have good reproducibility, which means that both 2D and 3D MRE are suitable for staging fibrosis. Our study also showed that the diagnostic performance of 3D MRE was not inferior to 2D MRE for staging liver fibrosis. Moreover, 3D MRE had better image quality than 2D MRE with fewer artifacts and more confidence to interpret the result, thus it has the potential to replace 2D MRE for staging fibrosis in clinical applications.Conclusion
Good reproducibility of 2D and 3D MRE were observed in this study. The diagnostic performance of 3D MRE was not inferior to 2D MRE in assessing liver fibrosis. Moreover, 3D MRE had better image quality and has the potential to replace 2D MRE for staging fibrosis in clinical applications in the future.Acknowledgements
The authors state that this study has received funding by National Natural Science Foundation of China grant 81271562 (JW) and Science and Technology Program of Guangzhou, China 201704020016 (JW).References
1. Guo Y, Parthasarathy S, Goyal P, McCarthy RJ, Larson AC, Miller FH. Magnetic resonance elastography and acoustic radiation force impulse for staging hepatic fibrosis: a meta-analysis. Abdominal imaging. 2015; 40:818-34.
2. Venkatesh SK, Ehman RL. Magnetic resonance elastography of liver. Magnetic resonance imaging clinics of North America. 2014; 22:433-46.
3. Huwart L, Peeters F, Sinkus R, Annet L, Salameh N, ter Beek LC, et al. Liver fibrosis: non-invasive assessment with MR elastography. NMR Biomed. 2006; 19:173-9.
4. Rouviere O, Yin M, Dresner MA, Rossman PJ, Burgart LJ, Fidler JL, et al. MR elastography of the liver: preliminary results. Radiology. 2006; 240:440-8.
5. Muthupillai R, Lomas DJ, Rossman PJ, Greenleaf JF, Manduca A, Ehman RL. Magnetic resonance elastography by direct visualization of propagating acoustic strain waves. Science. 1995; 269:1854-7.
6. Hamhaber U, Sack I, Papazoglou S, Rump J, Klatt D, Braun J. Three-dimensional analysis of shear wave propagation observed by in vivo magnetic resonance elastography of the brain. Acta Biomater. 2007; 3:127-37.
7. Shi Y, Xia F, Li QJ, Li JH, Yu B, Li Y, et al. Magnetic resonance elastography for the evaluation of liver fibrosis in chronic hepatitis B and C by using both gradient-recalled echo and spin-echo echo planar imaging: a prospective study. Am J Gastroenterol. 2016; 111:823-33.
8. Morisaka H, Motosugi U, Glaser KJ, Ichikawa S, Ehman RL, Sano K, et al. Comparison of diagnostic accuracies of two- and three-dimensional MR elastography of the liver. J Magn Reson Imaging. 2017; 45:1163-70.
9. Loomba R, Cui J, Wolfson T, Haufe W, Hooker J, Szeverenyi N, et al. Novel 3D magnetic resonance elastography for the noninvasive diagnosis of advanced fibrosis in NAFLD: a prospective study. Am J Gastroenterol. 2016; 111:986-94.
10. Wang J, Glaser KJ, Zhang T, Shan Q, He B, Chen J, et al. Assessment of advanced hepatic MR elastography methods for susceptibility artifact suppression in clinical patients. J Magn Reson Imaging. 2017.
11. Jin H, Lu Y. A non-inferiority test of areas under two parametric ROC curves. Contemp Clin Trials. 2009;30(4):375-9.
Figures