1730
Automated Assessment of Liver Parenchymal Enhancement on Hepatobiliary Phase MR Images Using a Convolutional Neural Network1Radiology, University of California San Diego, La Jolla, CA, United States, 2Radiology, Stanford University, Palo Alto, CA, United States, 3Department of Family Medicine and Public Health, University of California San Diego, La Jolla, CA, United States
Synopsis
Adequate hepatocellular enhancement (HCE) in Gd-EOB-DTPA-enhanced MRI studies can often deviate from the standard delay of 20 minutes. In this study, we proposed a fully-automated CNN-based approach for real-time assessment of HCE adequacy and retrospectively evaluated performance using 1201 T1w HBP 3D image sets from 406 unique patients. Our proposed model classified images with inadequate uptake with an AUC of 97%. With further validation, this approach could be used to identify the earliest time point HCE adequacy is achieved, potentially shortening scanning time by tailoring the exam length to the individual liver’s ability to uptake contrast.
INTRODUCTION
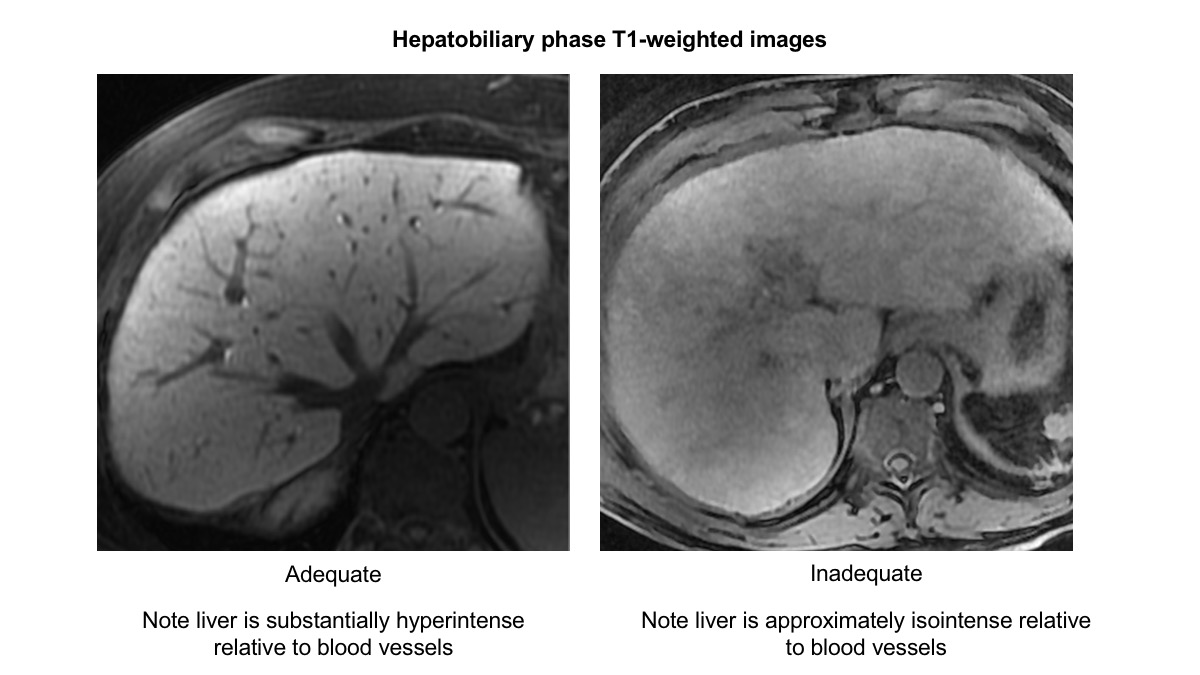
Acquisition delay time necessary for adequate hepatocellular enhancement (HCE) (Figure 1) in Gd-EOB-DTPA-enhanced magnetic resonance imaging (MRI) can often be shorter than the standard hepatobiliary phase (HBP) delay of 20 minutes [1-10]. However, terminating the exam prior to achieving adequate HCE may adversely affect diagnostic sensitivity for malignant lesions [4,6,7]. Conversely, lengthening the exam beyond adequate HCE can increase patient discomfort and costs [5,6].
Convolutional neural networks (CNNs) have been used to assess the quality of MR images [11,12,13]. In this study, we developed and performed preliminary performance assessment of a fully-automated approach to evaluate HCE adequacy, comprising a CNN-based liver segmentation followed by a CNN-based probability prediction of adequate HCE. We envision this approach to identify the earliest time point of adequate HCE after Gd-EOB-DTPA injection, tailoring the exam length to the individual liver’s ability to uptake contrast.This may permit a substantial percentage of exams to be shorter than in current clinical practice, potentially reducing costs and improving patient experience and workflow.
METHODS
Image Analysis
This retrospective, single-center pilot study included 1201 T1w HBP 3D image sets acquired 10 minutes or later after injection 0.025 mmol/kg of Gd-EOB-DTPA from 406 unique patients scanned at 1.5T or 3T between January 2011 to January 2018. 278 of the 406 patients had multiple HBP image sets at variable post injection time points in the same exam. Blinded to field strength and acquisition delay, two expert radiologists independently classified each HBP image set in a different random order as A) adequate HCE or B) inadequate HCE. Images were also classified as having or not having significant motion or other imaging artifacts. Discordant classifications were adjudicated in consensus in a second read which was used as the ground-truth classification.
Model Architectures
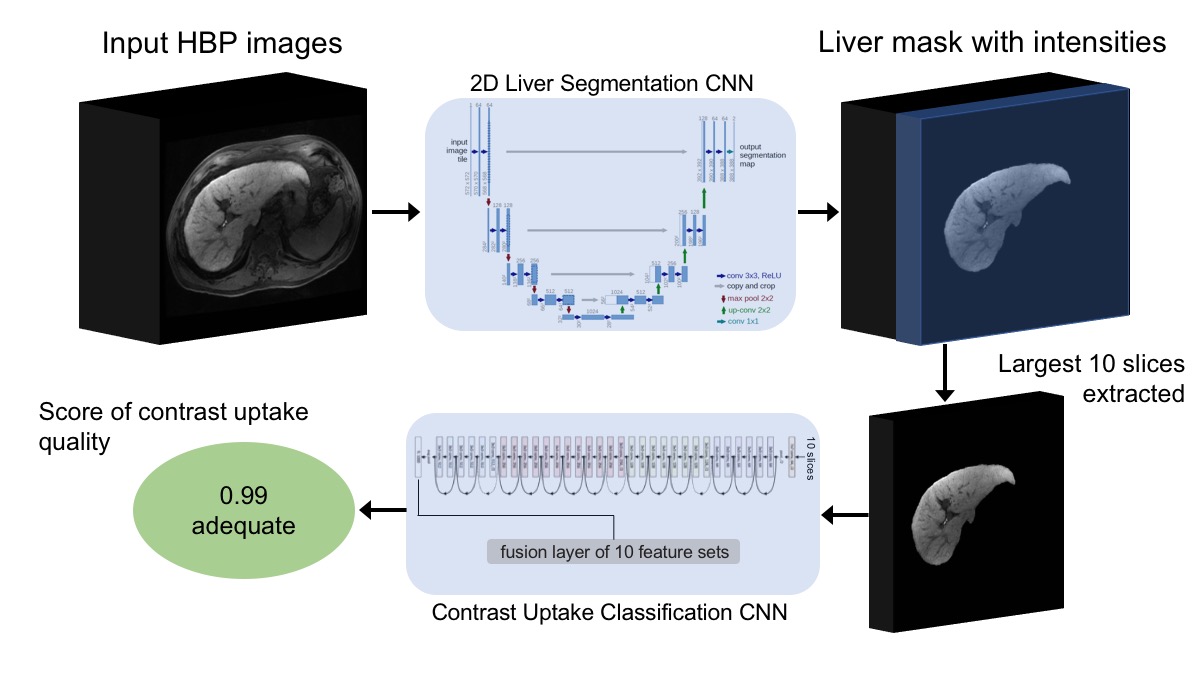
HBP images were sent through a previously developed 2D liver segmentation CNN with U-net architecture to produce masks containing liver intensities. The 10 slices containing the largest liver mask areas were sent through an ImageNet-pretrained 50-layer residual network with a customized appended feature fusion layer to produce a single HCE adequacy score between 0 (adequate) and 1 (inadequate)[14] (Figure 2). Training data for the HCE adequacy CNN comprised 858 sets of HBP image masks from 284 unique patients and their corresponding ground-truth binary HCE classification as model output. The inadequate class was oversampled during model training to mitigate class imbalance.
Testing
We evaluated the proposed model framework on a held-out test set of 375 sets of HBP image masks from 122 unique patients by computing area under the ROC curve (AUC) and other performance metrics, using the consensus classification as a reference standard. Model performance was stratified by consensus-determined presence of artifacts to identify potential failure modes of the proposed framework.
RESULTS
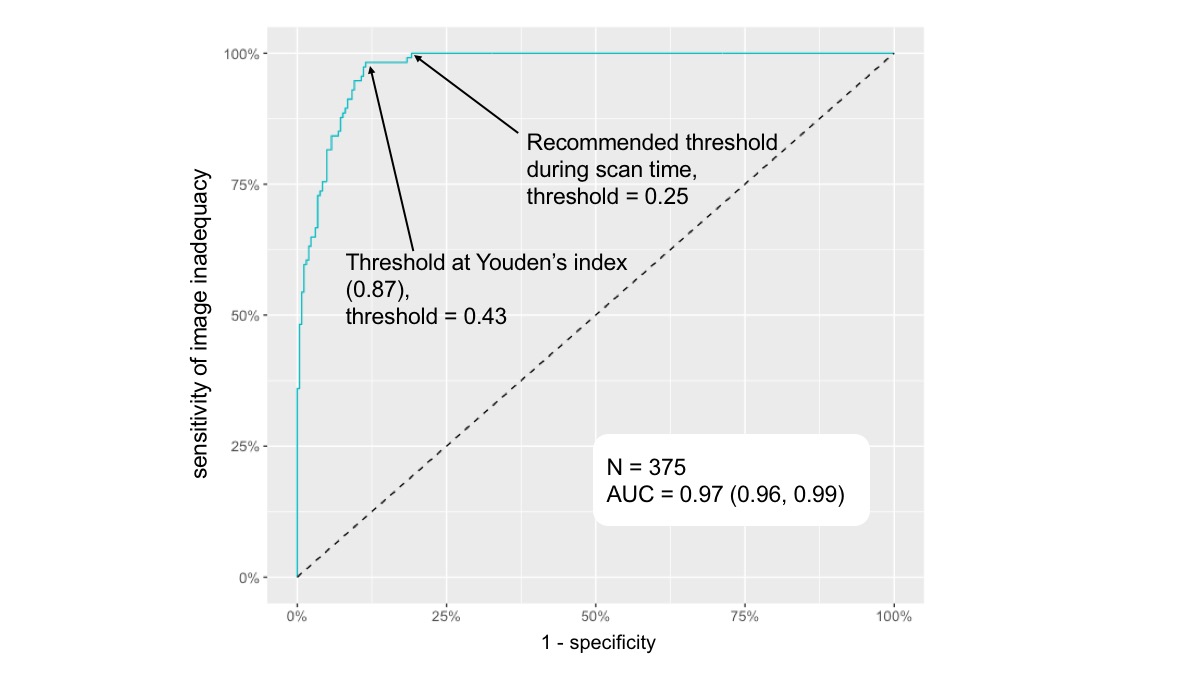
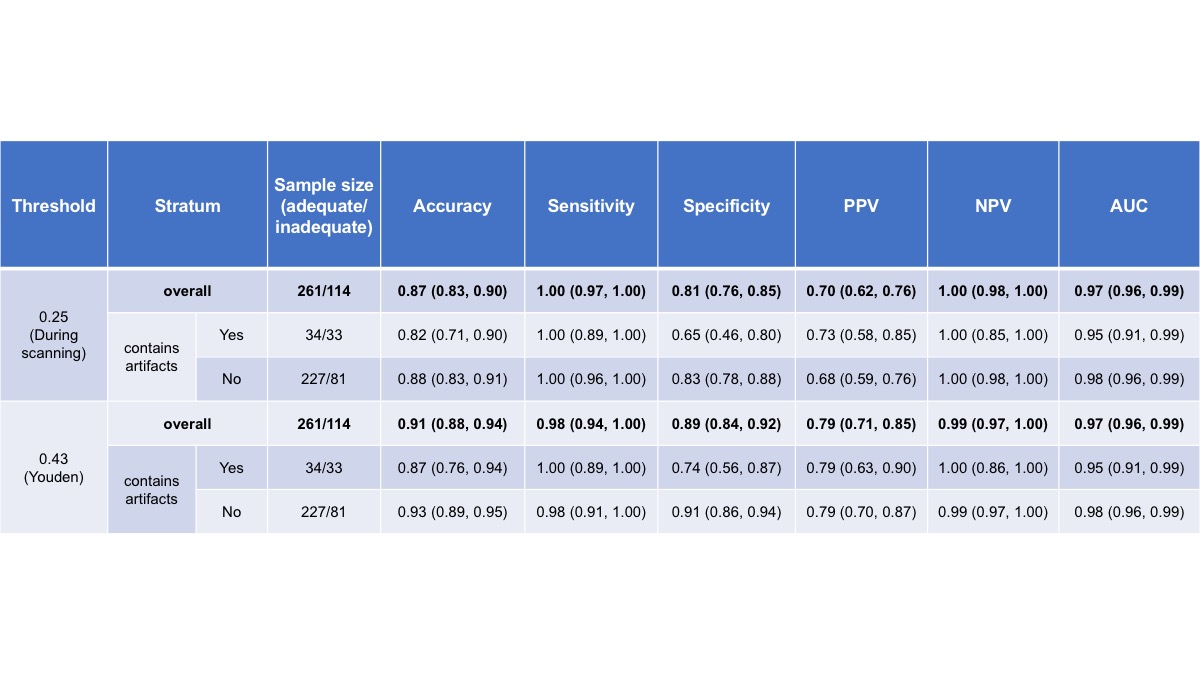
The model classified HBP images as inadequate with an AUC of 97%. Youden’s index cutoff of 0.43 provided 98% sensitivity and 89% specificity for inadequacy (Figure 3). A conservative probability cutoff of 0.25 provided 100% sensitivity and 81% specificity for HCE inadequacy (Table 1). The model had lower classification accuracy (82% vs. 87%) and specificity (65% vs. 74%) for images with artifacts versus without artifacts, while maintaining high sensitivity (98% vs. 100%).DISCUSSION
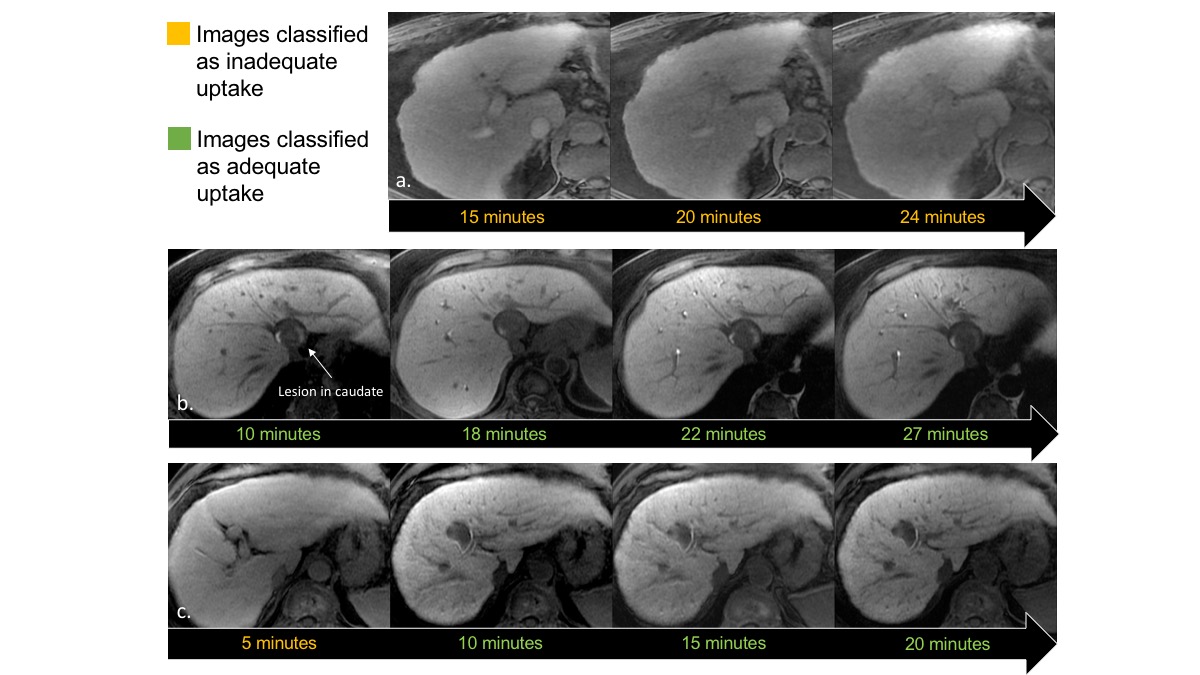
Previous studies have proposed automated assessment of liver image quality [12,13]. Variable accuracies were reported, with better results achieved when liver segmentation was performed [13]. In this work we identified a conservative probability cutoff that provides 100% sensitivity to ensure that images of inadequate HCE are not falsely classified as adequate. With further validation, this cutoff could be used to identify the earliest postcontrast time point at which HCE adequacy is achieved, potentially enabling shorter scanning time. A lower specificity is acceptable for making this determination since adequate images acquired earlier than the 20-minute delay and falsely classified as inadequate would default to the current standard of care for HBP images (Figure 4). Although results indicate that images containing artifacts adversely affect model accuracy and specificity, high sensitivity is maintained.CONCLUSION
Our proposed CNN framework for assessing HCE is comparable to the consensus of two body-fellowship-trained board-certified radiologists. Automated real-time assessment of HBP images using the proposed CNN framework could potentially alert the technologist when adequate HBP images have been acquired, thus enabling earlier termination of the exam and reducing patient discomfort and costs. Further research is needed to determine the percentage of exams that could be shortened by the proposed CNN framework, but our anecdotal experience suggests it could be as high as 80% in patients without advanced liver disease.Acknowledgements
This study would not be possible without the invaluable contributions from the members of the Liver Imaging Group (LIG) and the Augmented Imaging/Artificial Intelligence Data Analytics (AIDA) Laboratory at University of California, San Diego.References
- Tamada T, Ito K, Higaki A, et al. Gd-EOB-DTPA-enhanced MR imaging: evaluation of hepatic enhancement effects in normal and cirrhotic livers. European Journal of Radiology 2011;80(3): e311-e316.
- You MW, Kim HJ, Lim HS, et al. Assessment of Liver Function Using Pharmacokinetic Parameters of Gd-EOB-DTPA: Experimental Study in Rat Hepatectomy Model. Contrast Media & Molecular Imaging vol. 2018, Article ID 6321316, 7 pages, 2018.
- Okada M, Murakami T, Kuwatsuru R, et al. Biochemical and clinical predictive approach and time point analysis of hepatobiliary phase liver enhancement on Gd-EOB-DTPA–enhanced MR images: a multicenter study. Radiology 2016;281(2): 474-483.
- Motosugi U, Ichikawa T, Tominaga L, et al. Delay before the hepatocyte phase of Gd-EOB-DTPA-enhanced MR imaging: is it possible to shorten the examination time? European Radiology 2009;19(11):2623-2629.
- Liang M, Zhao J, Xie B, et al. MR liver imaging with Gd-EOB-DTPA: The need for different delay times of the hepatobiliary phase in patients with different liver function. European Journal of Radiology 2016;85(3):546-552.
- Wu JW, Yu YC, Qu XL, et al. Optimization of hepatobiliary phase delay time of Gd-EOB-DTPA-enhanced magnetic resonance imaging for identification of hepatocellular carcinoma in patients with cirrhosis of different degrees of severity. World Journal of Gastroenterology 2018;24(3):415-423.
- Kessel CS, Veldhui WB, Bosch MAAJ, et al. MR liver imaging with Gd-EOB-DTPA: a delay time of 10 minutes is sufficient for lesion characterization. European Radiology2012;22(10):2153-2160.
- Carlos RC, Branam JD, Dong Q, et al. Biliary imaging with Gd-EOB-DTPA: is a 20-minute delay sufficient? Academic Radiology 2002;9(11):1322-1325.
- Sofue K, Tsurusaki M, Tokue H, et al. Gd-EOB-DTPA-enhanced 3.0 T MR imaging: quantitative and qualitative comparison of hepatocyte-phase images obtained 10 min and 20 min after injection for the detection of liver metastases from colorectal carcinoma. European Radiology 2011;21(11):2336-2343.
- Kobi M, Paroder V, Flusberg M, et al. Limitations of GD-EOB-DTPA-enhanced MRI: can clinical parameters predict suboptimal hepatobiliary phase? Clinical Radiology 2017;72(1):55-62.
- Yamashita R, Nishio M, Do RKGD, et al. Convolutional neural networks: an overview and application in radiology. Insights into Imaging 2018;1-19.
- Esses SJ, Lu X, Zhao T, et al. Automated image quality evaluation of T2‐weighted liver MRI utilizing deep learning architecture. Journal of Magnetic Resonance Imaging 2018;47(3):723-728.
- Kuestner T, Gatidis S, Liebgott A, et al. A Machine-learning framework for automatic reference-free quality assessment in MRI. Magnetic Resonance Imaging (2018)53:134-147.
- He K, Zhang X, Ren S, Sun J, Deep residual learning for image recognition. Computer Vision and Pattern Recognition (CVPR), 2016:770-778.
Figures