1728
A Real-Time Centralized Pipeline for Reconstructing and Quantifying Hyperpolarized 129Xe Gas Exchange MRI1Biomedical Engineering, Duke University, Durham, NC, United States, 2Electrical and Computer Engineering, Duke University, Durham, NC, United States, 3Radiology, Duke University Medical Center, Durham, NC, United States
Synopsis
Hyperpolarized 129Xe MRI is emerging as a powerful means to provide 3D quantitative mapping of ventilation, interstitial barrier uptake, and red blood cell transfer. However, this capability requires non-standard radial reconstruction and accurate lung segmentation to enable quantitative analysis. Such reconstruction and image processing would ideally be standardized and centralized to facilitate using 129Xe gas exchange MRI in multi-center clinical trials. To this end, we developed a neural-network based lung segmentation approach that automatically generates accurate masks. With this capability, we demonstrate a fully centralized processing pipeline for real-time reconstruction and quantitative reporting of 129Xe gas exchange MRI.
Introduction
Recently it has become possible for hyperpolarized 129Xe MRI to provide 3D quantitative mapping of ventilation, interstitial barrier uptake, and red blood cell (RBC) transfer from two inhalations of xenon [1]. However, this capability requires non-standard radial acquisition and reconstruction as well as accurate thoracic cavity segmentation to enable quantitative analysis. To facilitate and accelerate adoption of this capability for multi-center clinical trials, it is desirable to centralize and standardize the reconstruction and image processing procedure. Arguably, the most significant obstacle for such quantitative mapping lies in obtaining an accurate thoracic cavity segmentation. To overcome this hurdle in automatic processing, we have developed an automatic segmentation method based on neural networks, utilizing multi-channel information from both proton and 129Xe images. With this capability, we demonstrate a centralized pipeline for real-time image reconstruction and quantitative reporting of 129Xe gas exchange images.Methods
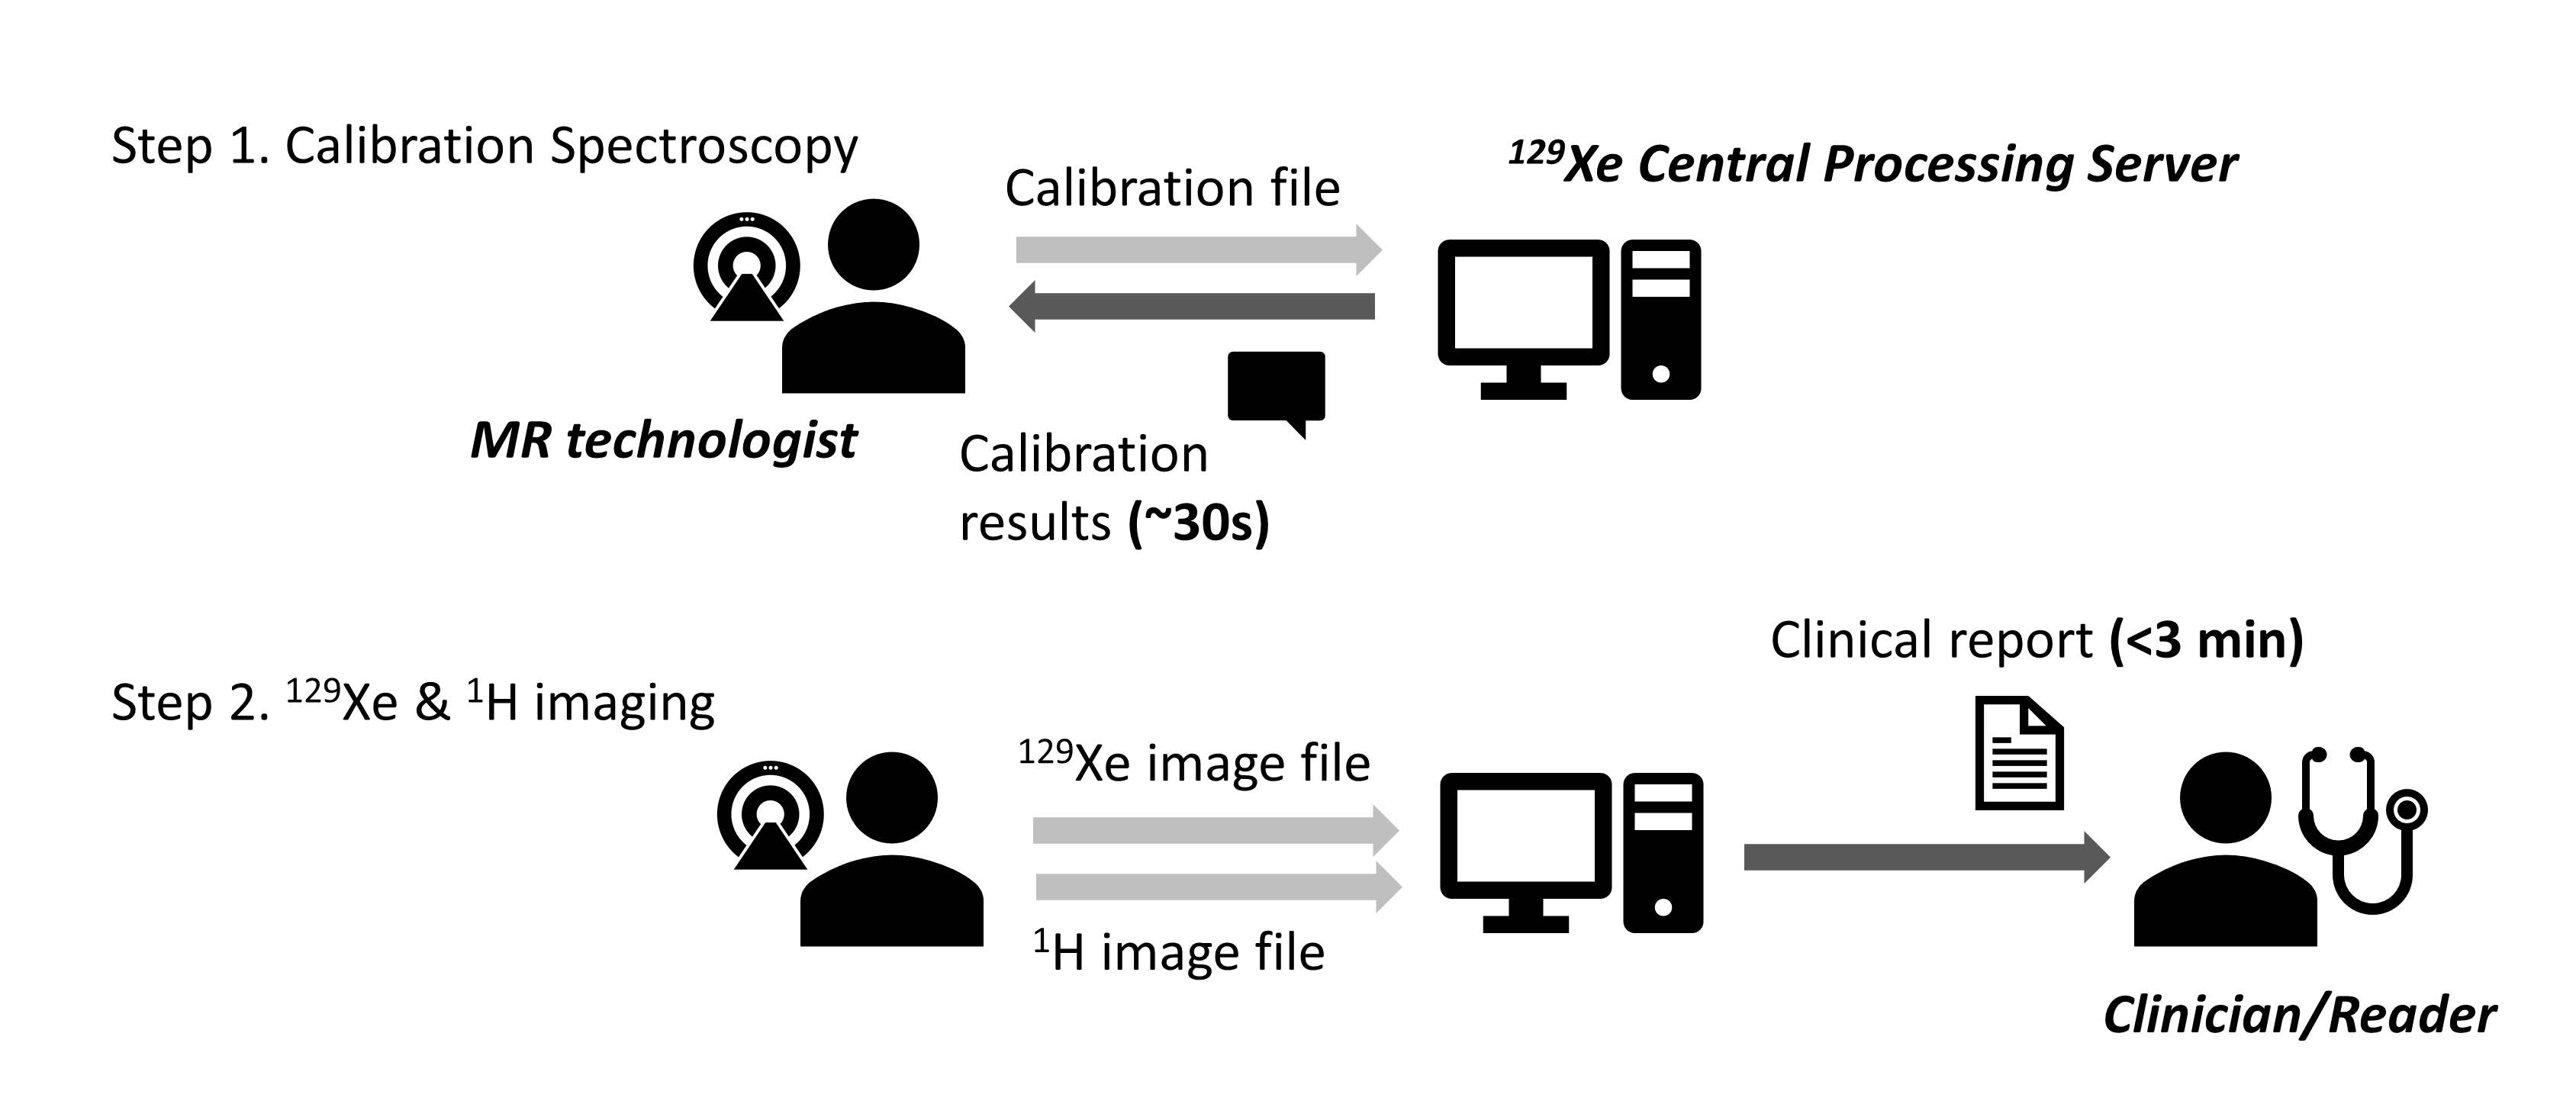
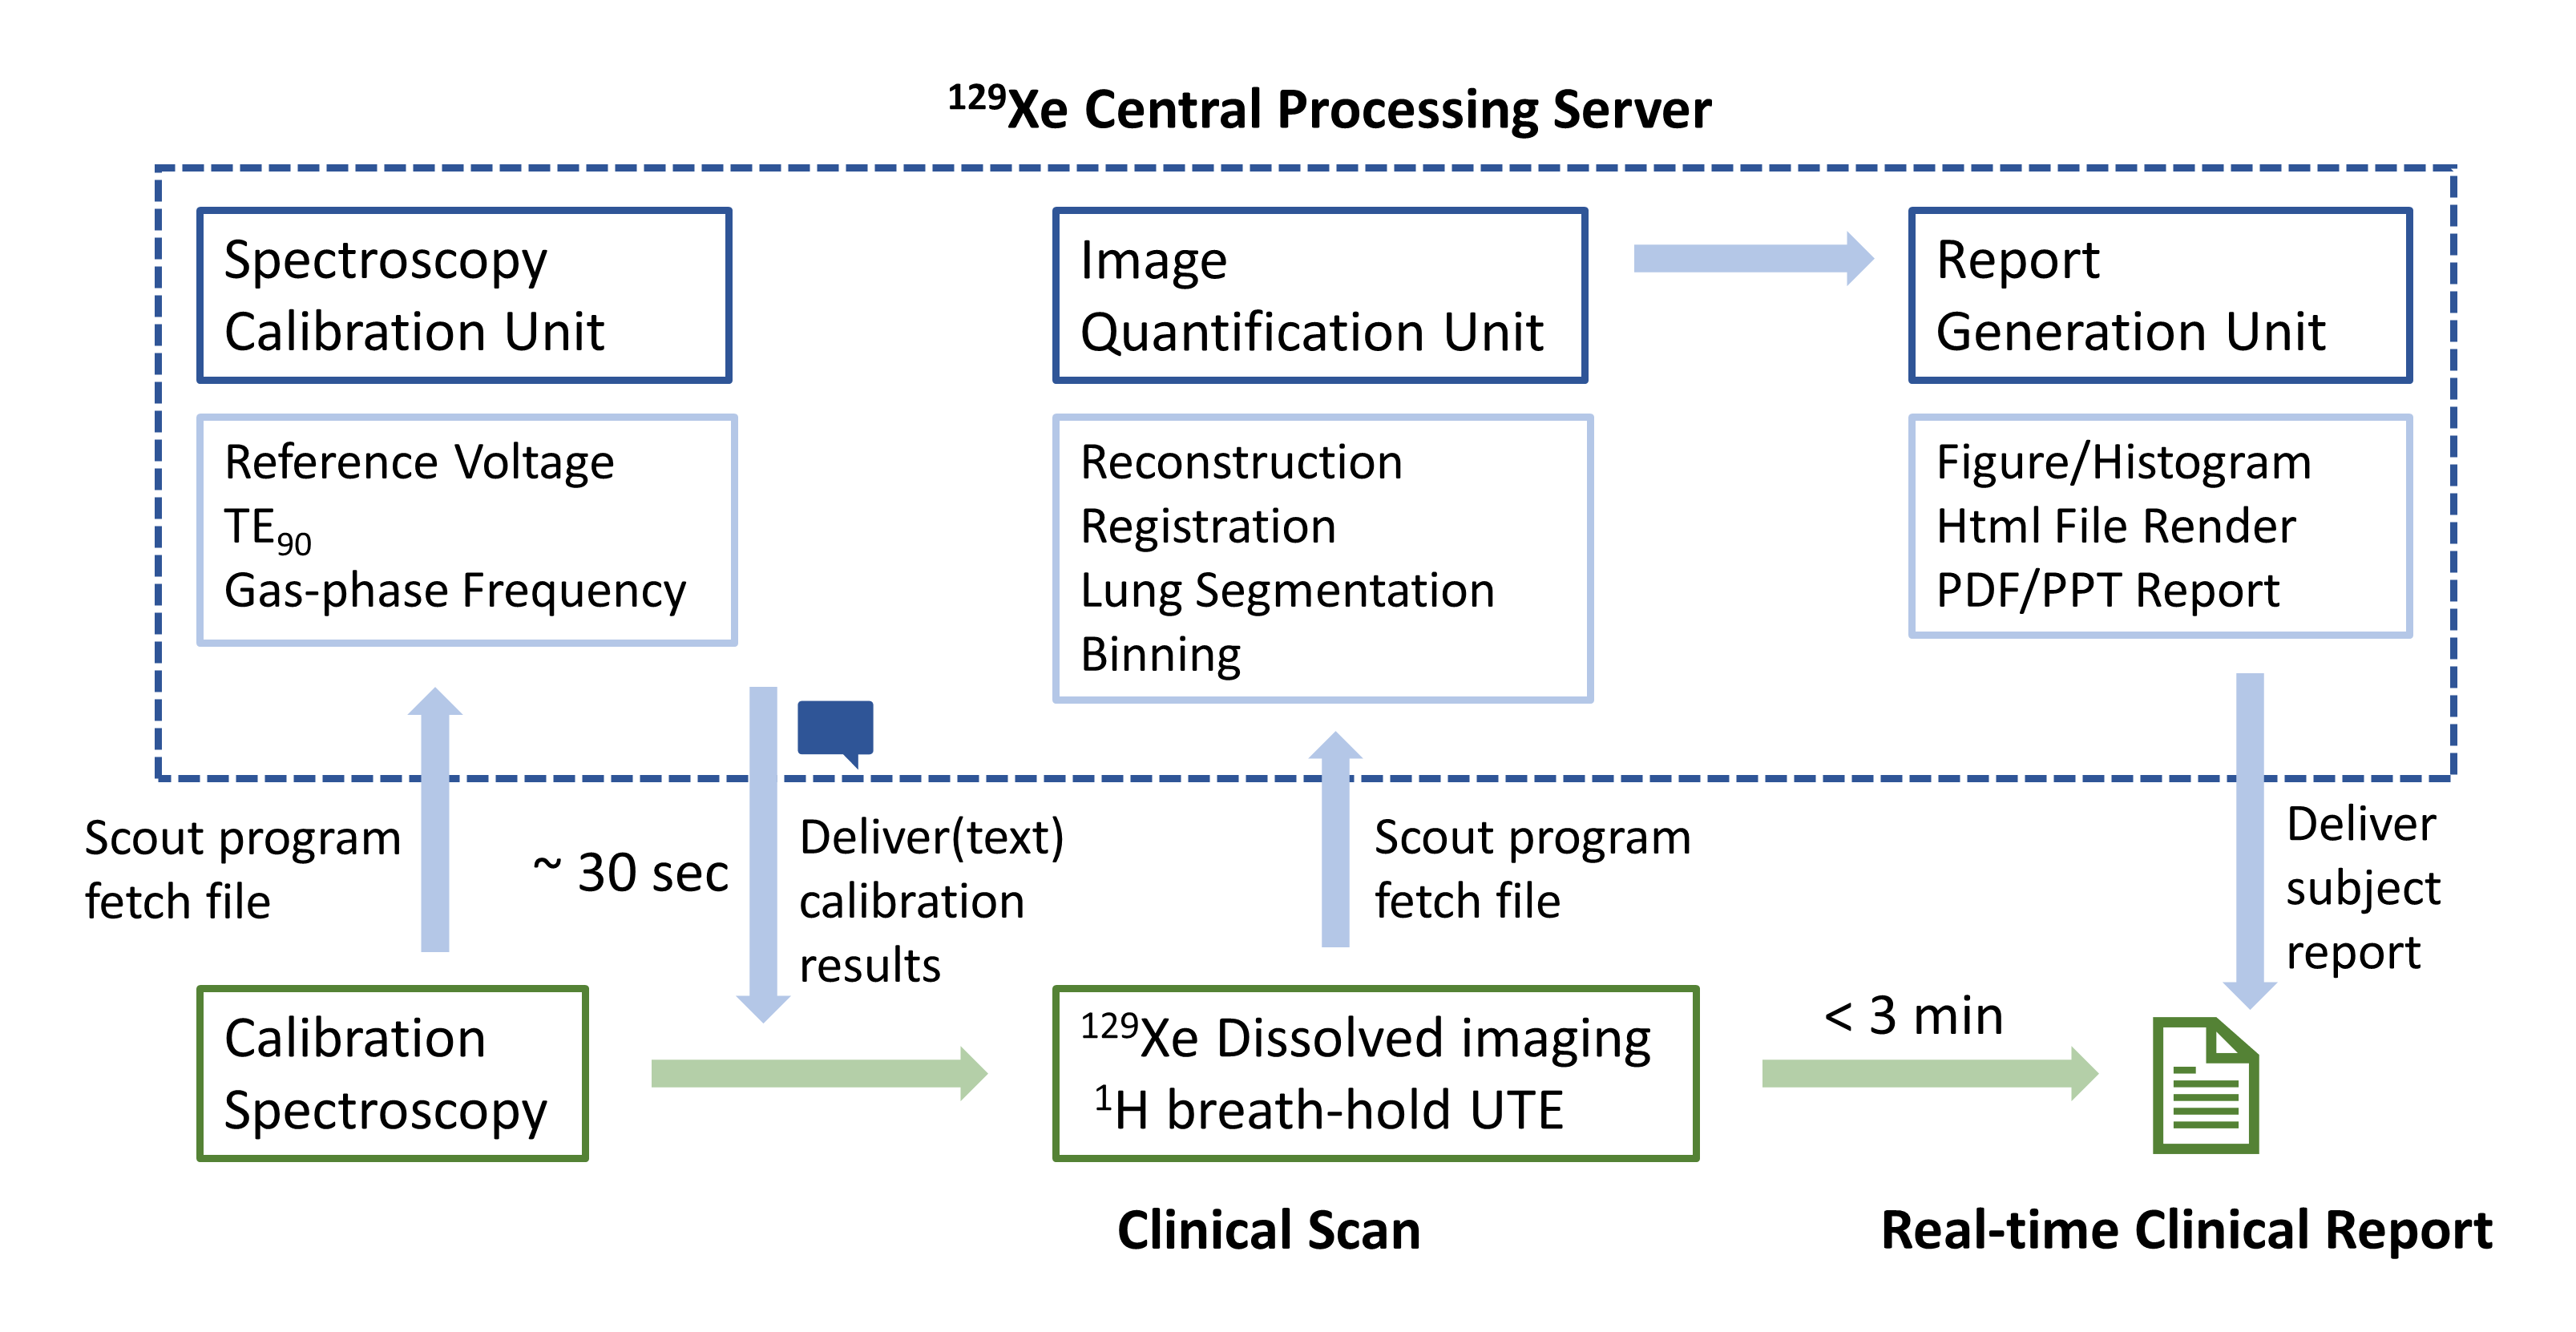
The study enrolled 80 subjects who underwent an imaging protocol consisting of a calibration spectroscopy, a breath-hold 3D radial 129Xe ventilation/dissolved-phase image, and a breath-hold 1H UTE image, as detailed in [2]. All imaging was conducted on a 3T scanner (Siemens MAGNETOM Trio). The pipeline is designed to facilitate the study without human intervention (Figure 1). It consists of 3 major units to facilitate calibration and parameter setting, image reconstruction and quantification, and clinical reporting (Figure 2). The pipeline was implemented on a workstation running the Ubuntu operating system and operates as follows. First, the 129Xe calibration raw file acquired on the scanner is saved to a shared-access folder, where it is detected by the pipeline’s scout program, which launches its Calibration unit. This calculates parameters for setting scanner frequency, transmit voltages, and the TE required for Dixon-based separation of RBC and barrier images. These results are sent to the MR technologist using the Twilio (https://www.twilio.com) SMS text service, thereby allowing the subsequent imaging sequence to be prescribed. Once the 129Xe gas exchange and anatomical 1H raw data have been acquired and saved to the shared folder, the Image Quantification unit is launched and completes image reconstruction (using compiled C code for speed). After reconstruction, it segments the thoracic cavity (using a neural network model described below) and registers the resulting mask to the functional 129Xe MRI scan (using Simple-ITK). The 129Xe ventilation data is bias-field corrected (N4BiasfieldCorrection[3]), and then thresholded to produce color binning maps of ventilation[4]. Similar processing is applied to barrier uptake and RBC transfer, but since these are expressed as a ratio relative to the gas-phase image, the source images are not bias-field corrected [5]. The maps and the related quantitative metrics are then passed to the Report Generation unit to render clinical report using a HTML template. The report is immediately delivered via an email in PDF and PPT format, making it accessible from mobile devices. The unit also archives NIFTI files of the color maps and populates a running CSV file with the subject ID and the derived quantitative image metrics.
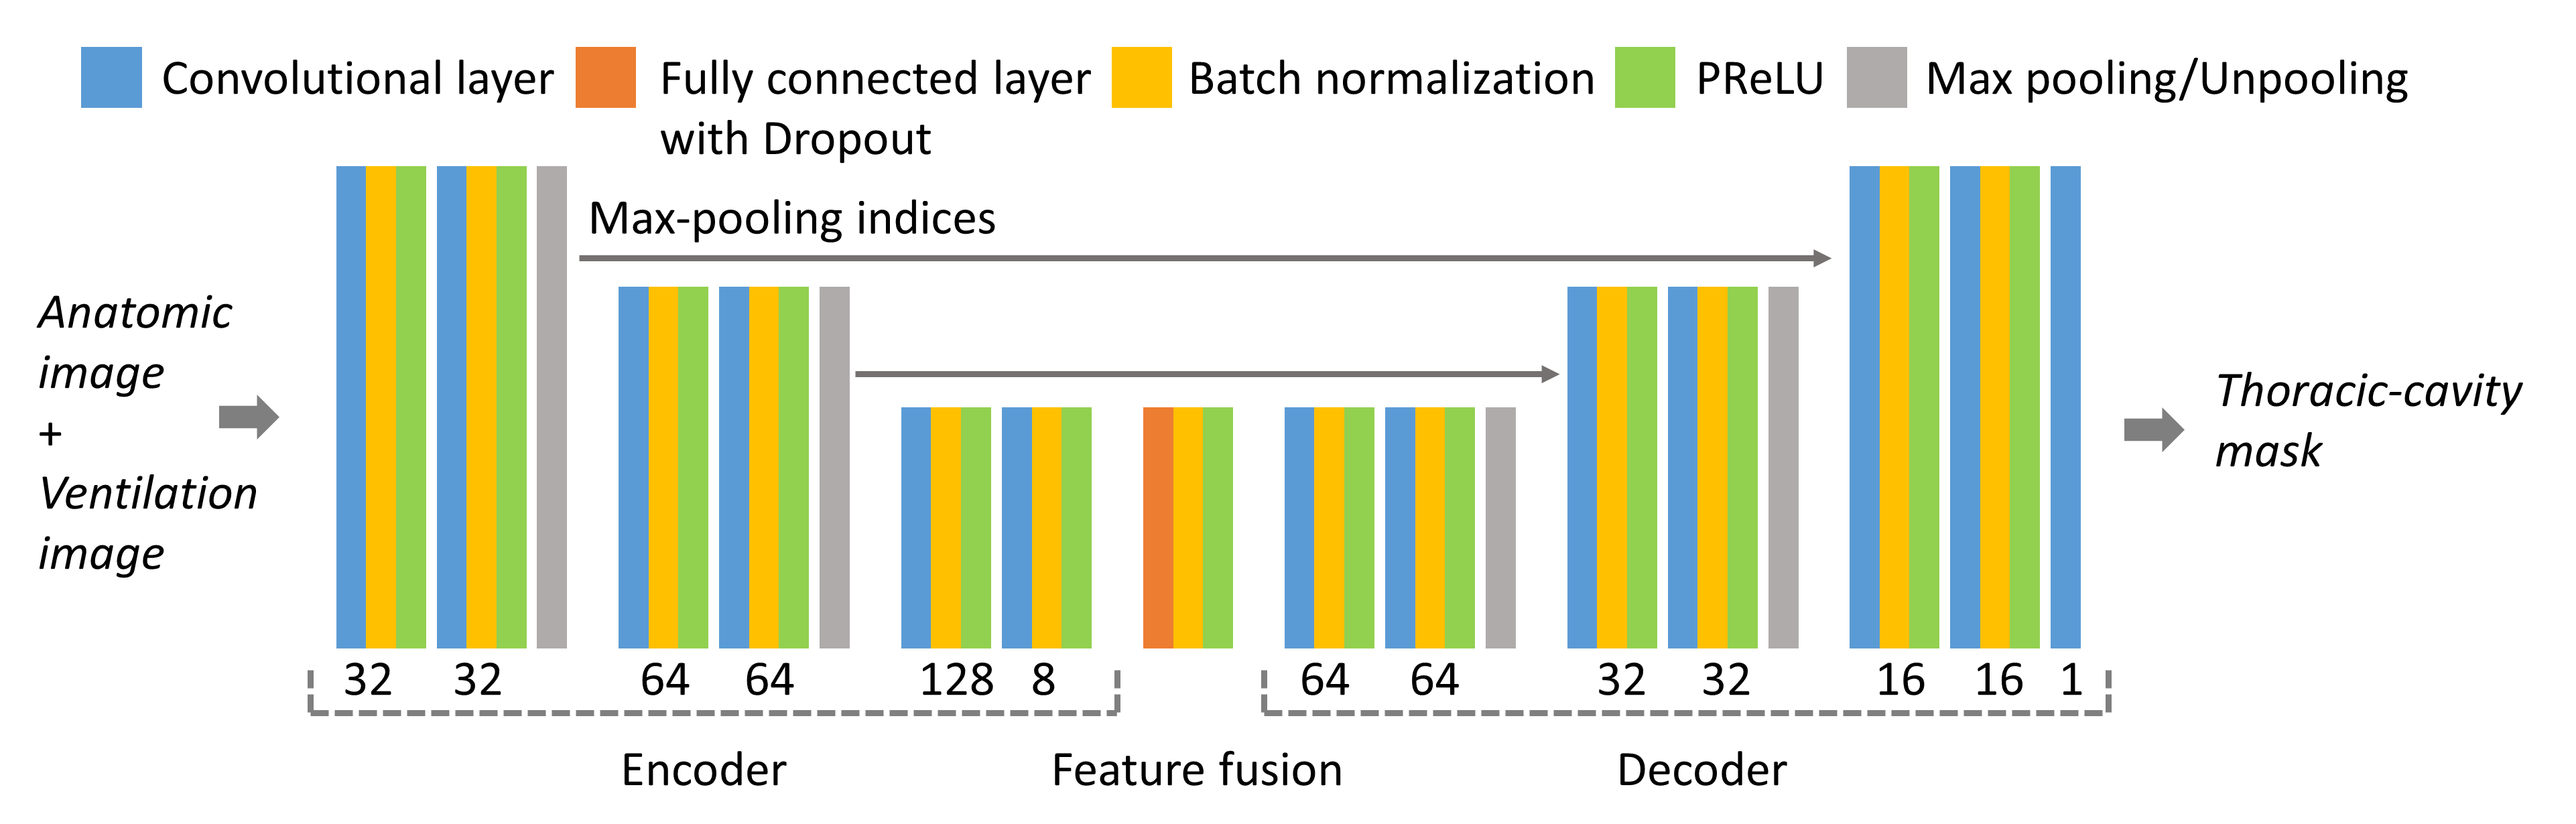
The neural network model for segmentation (Figure 3) employs both the 1H and 129Xe images. It consists of a down-sampling encoder (to extract image features), feature fusion layers (to incorporate the features), and an up-sampling decoder (to restore image resolution), with down-sampling indices preserved to retain high-frequency information [6]. The model was trained using 3D 1H anatomical and 129Xe ventilation images from 116 scans, that were manually segmented in ITK-Snap (http://www.itksnap.org). Training involved minimizing the Mean Squared Error (MSE) loss between the model output and the manually segmented masks.
Results
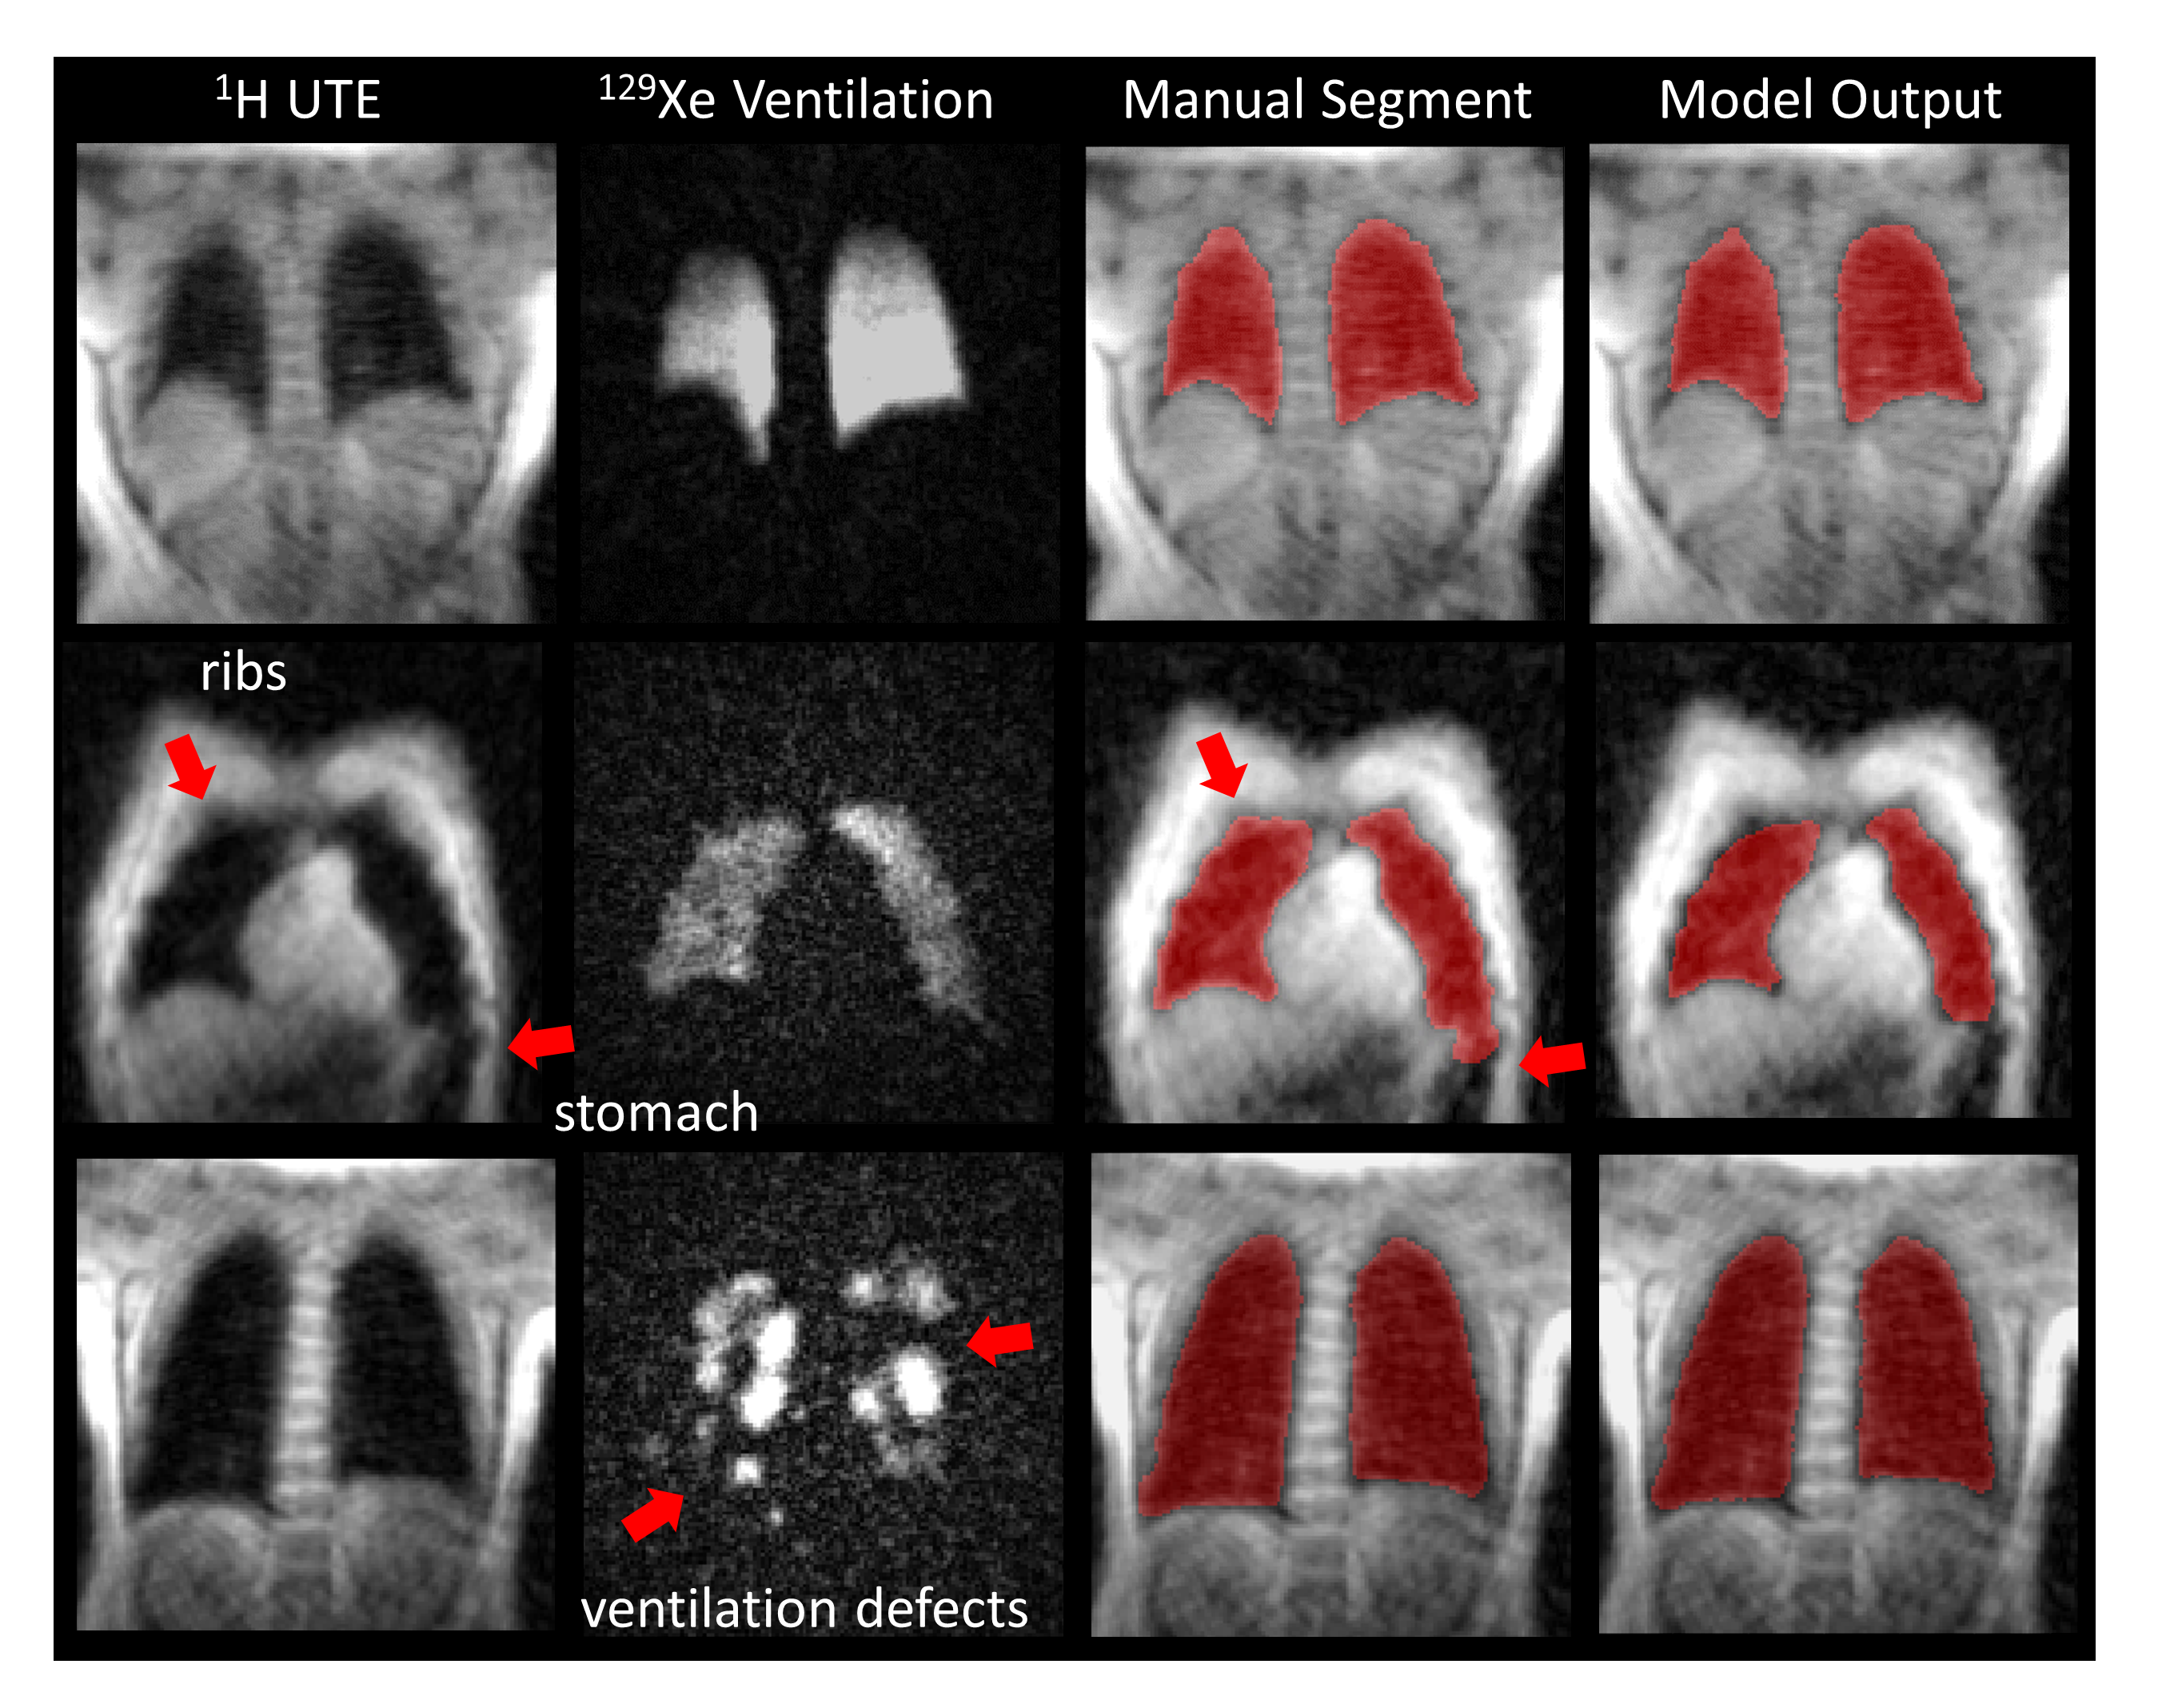
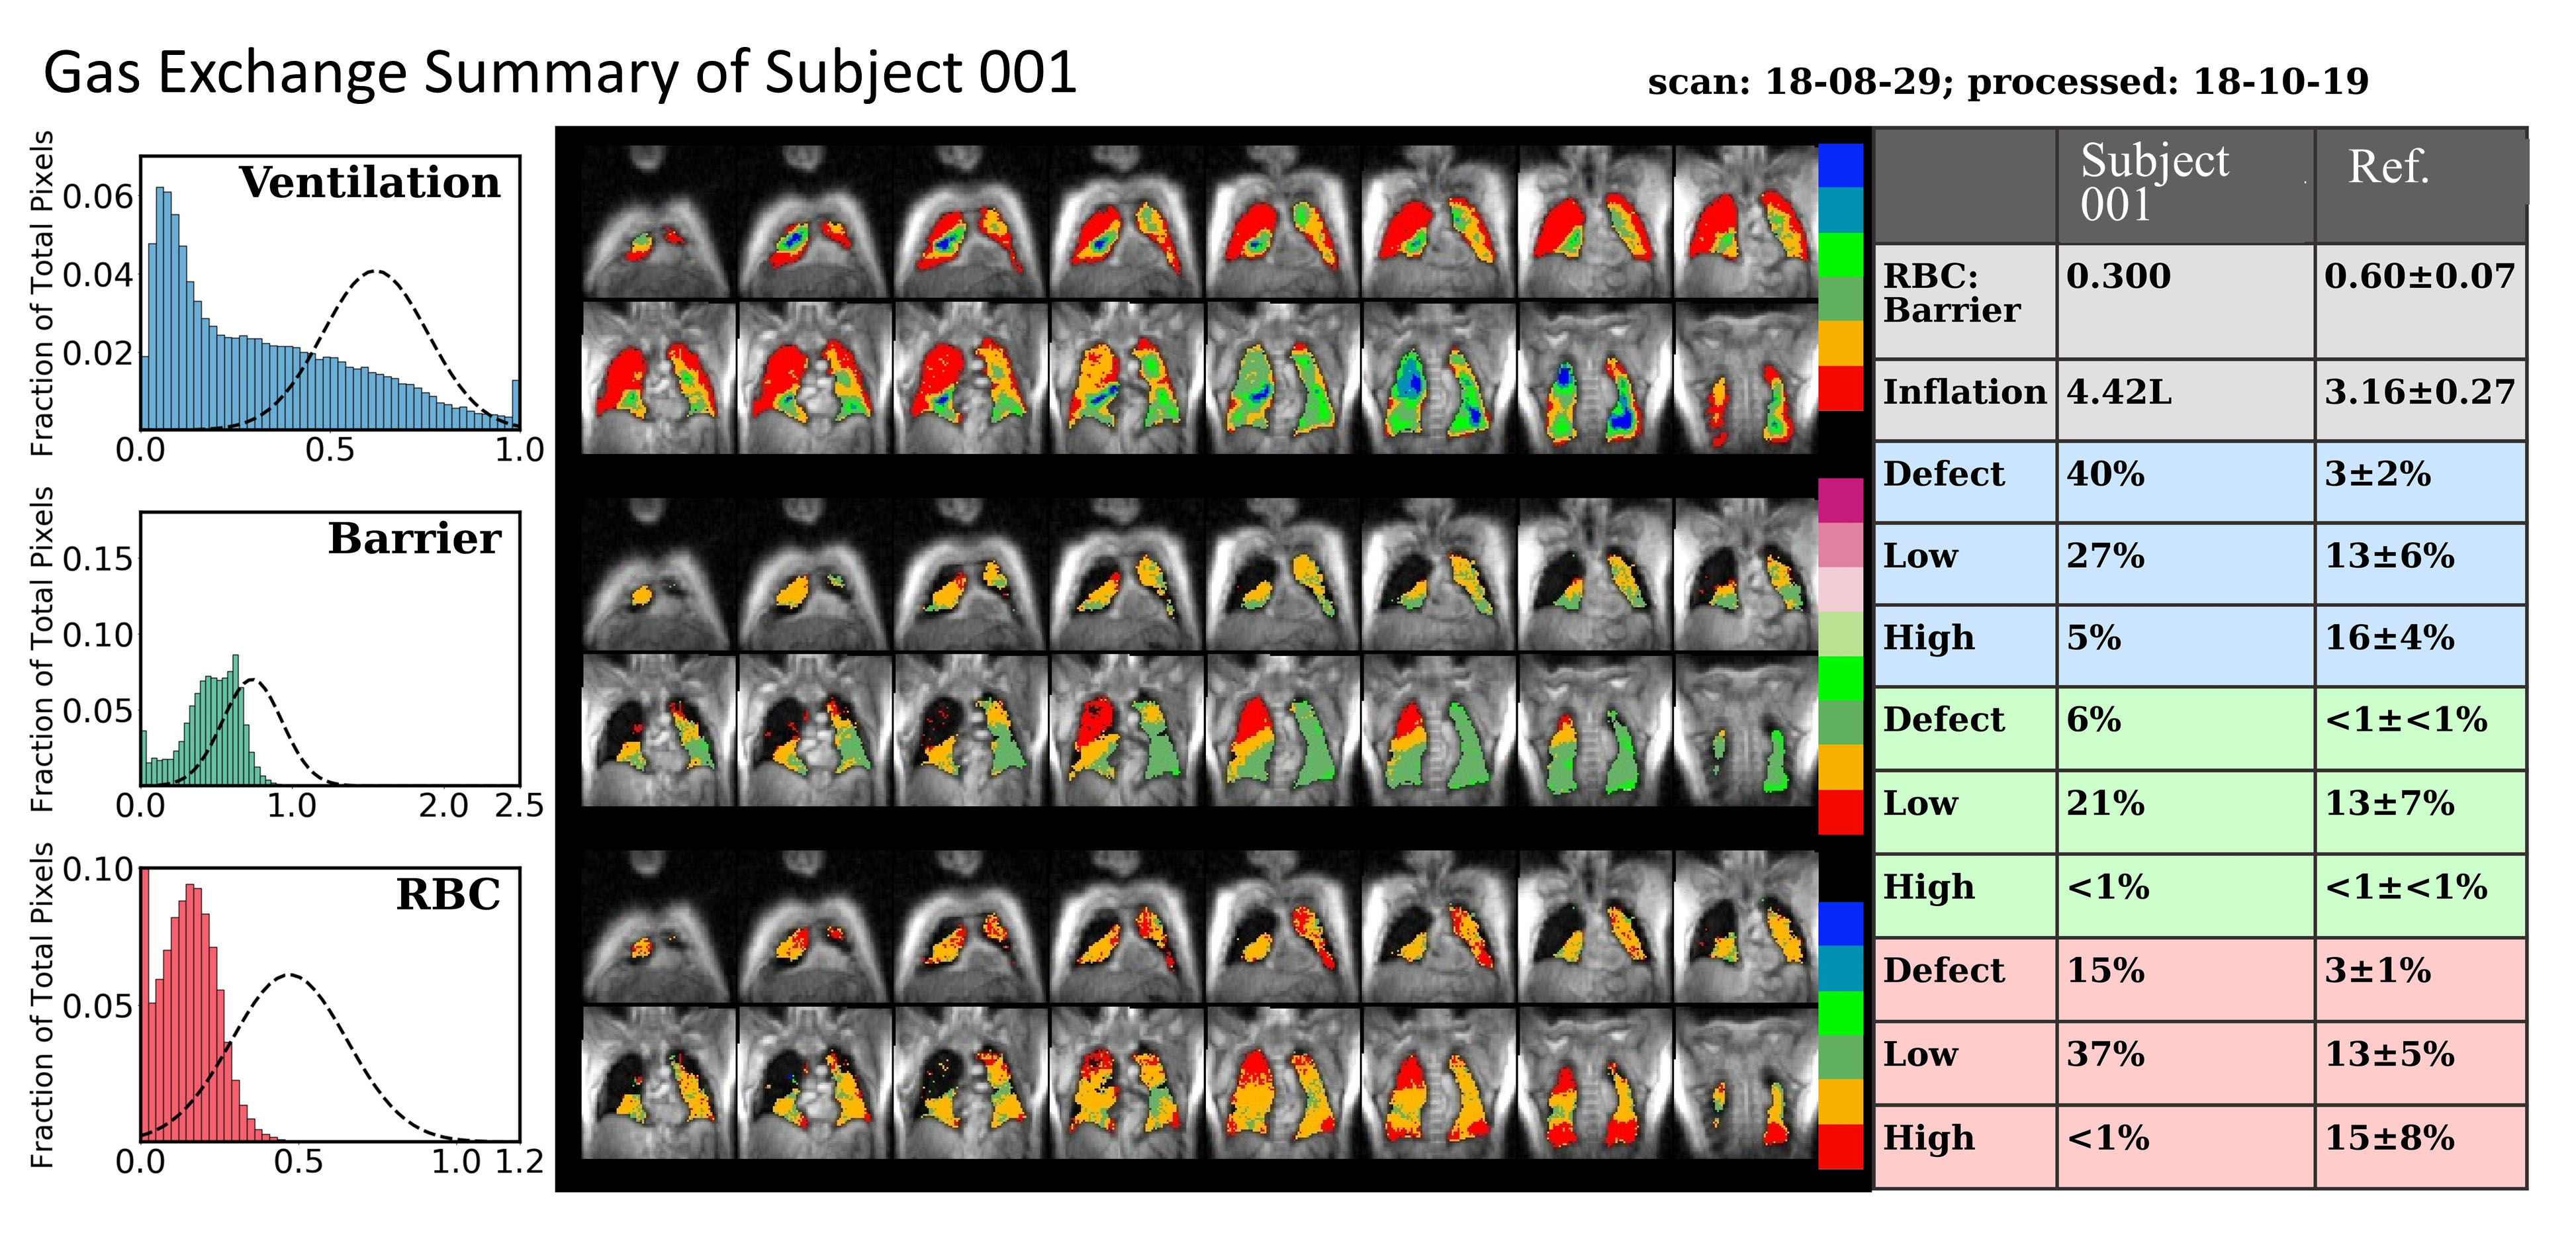
The calibration result (text message) is delivered around 30 seconds after the calibration scan has been saved. The final clinical report (email) is delivered within 3 minutes of scan completion. Figure 4 shows representative segmentation of the thoracic 1H images using the neural network model. Its accuracy was found to be improved by incorporating 129Xe ventilation image data to clarify regions of unclear boundaries such as the ribs and stomach. Such ventilation imaging was found to be useful even when ventilation defects are present. A representative quantitative report is shown in Figure 5, depicting a COPD patient with ventilation defects, diminished barrier uptake (emphysema) and poor RBC transfer.Discussion
The pipeline descried now provides routine, real-time data processing and clinical report generation without human intervention. Moreover, its centralized implementation and rapid delivery positions the system well to ultimately provide remote service through secure, HIPAA-compliant online data transfer. This capability could provide a useful means to standardize image reconstruction and processing procedures to facilitate multi-center studies incorporating gas exchange MRI.Acknowledgements
IH/NHLBI R01 HL105643, NIH/NHLBI R01HL126771, and HHSN268201700001CReferences
1. Kaushik, S.S., et al., Single-breath clinical imaging of hyperpolarized (129)Xe in the airspaces, barrier, and red blood cells using an interleaved 3D radial 1-point Dixon acquisition. Magn Reson Med, 2016. 75(4): p. 1434-43.
2. Wang, Z., et al., Hyperpolarized (129) Xe gas transfer MRI: the transition from 1.5T to 3T. Magn Reson Med, 2018.
3. Tustison, N.J., et al., N4ITK: Improved N3 Bias Correction. Ieee Transactions on Medical Imaging, 2010. 29(6): p. 1310-1320.
4. He, M., et al., Extending semiautomatic ventilation defect analysis for hyperpolarized (129)Xe ventilation MRI. Acad Radiol, 2014. 21(12): p. 1530-41.
5. Wang, Z., et al., Quantitative analysis of hyperpolarized 129 Xe gas transfer MRI. Med Phys, 2017. 44(6): p. 2415-2428.
6. Badrinarayanan, V., A. Kendall, and R. Cipolla, SegNet: A Deep Convolutional Encoder-Decoder Architecture for Image Segmentation. Ieee Transactions on Pattern Analysis and Machine Intelligence, 2017. 39(12): p. 2481-2495.
7. He, K.M., et al., Delving Deep into Rectifiers: Surpassing Human-Level Performance on ImageNet Classification. 2015 Ieee International Conference on Computer Vision (Iccv), 2015: p. 1026-1034.
Figures