1727
The associations between breast density and the radiomic features derived from T1-weighted MRI1Biomedical Engineering, Stony Brook University, Stony Brook, NY, United States, 2Stony Brook University Cancer Center, Stony Brook, NY, United States, 3Hematology and Oncology, Stony Brook Medicine, Stony Brook, NY, United States, 4Pathology, Stony Brook Medicine, Stony Brook, NY, United States, 5Radiology, Stony Brook Medicine, Stony Brook, NY, United States, 6Computer Science, Stony Brook University, Stony Brook, NY, United States, 7Psychiatry, Stony Brook Medicine, Stony Brook, NY, United States
Synopsis
Breast density (BD) has been recognized as a biomarker of breast cancer risk. We previously developed a highly reproducible MRI-based BD measurement (MRD), that is directly comparable to mammographic density, using fat-water decomposition MRI to assess the breast cancer risk in clinical trials. However, this method requires a specific sequence which cannot be applied to previously acquired data. In this work, we investigate possibility of using the radiomic features extracted from routine T1-weighted MRI to represent MRD. This finding enables a possibility of evaluating the breast cancer risk using the routine MRI data in clinical practice.
Introduction
Increased breast density (BD) has been identified as a significant independent risk factor for breast cancer[1-3]. Our group developed a MRI-based BD measurement (MRD)[4] based on fat-water decomposition MRI. Compared to traditional mammographic density, this method avoids ionizing radiation and breast compression. In addition, the proposed MRD is directly comparable to the mammographic density and highly reproducible (scan-rescan variation ~ 1.4%), enabling the detection of individual breast density changes for clinical trials and individual treatment response assessment. However, this MRD measurement is derived from fat-water decomposition MRI, which has not been incorporated into the routine clinical breast MRI protocol, limiting its clinical adoption. In this study, we investigated the relationships between MRD and radiomic features derived from routine T1-weighted MRI to explore a potential method for monitoring breast cancer risk in clinical practice.Methods
Twenty-five breast cancer patients enrolled in a prevention trial were identified for this study. Each patient received MRI scans at baseline, 6 months and 12 months on a 3T Siemens Biograph mMR scanner. Only the baseline scan was used for this analysis. The fat-water decomposition MRI was performed using a 3D Cartesian 6-echo gradient echo pulse sequence with the following parameters: 64 slices, acquisition matrix 78×192, pixel size = 2×2 mm2, slice thickness = 4 mm, flip angle = 6⁰, repetition time (TR) = 11 ms, and 6 echoes with echo time (TE) = 1.37, 2.66, 4.92, 6.15, 7.38, 8.81 ms. T1-weighted images were acquired using T1-weighted FL3D sequence without fat saturation and the following acquisition parameters were used: 128 slices, acquisition matrix 512×512, pixel size=0.625×0.625 mm2, slice thickness = 1.4 mm, flip angle = 20⁰, TR = 6.3 ms, and TE = 2.37 ms.
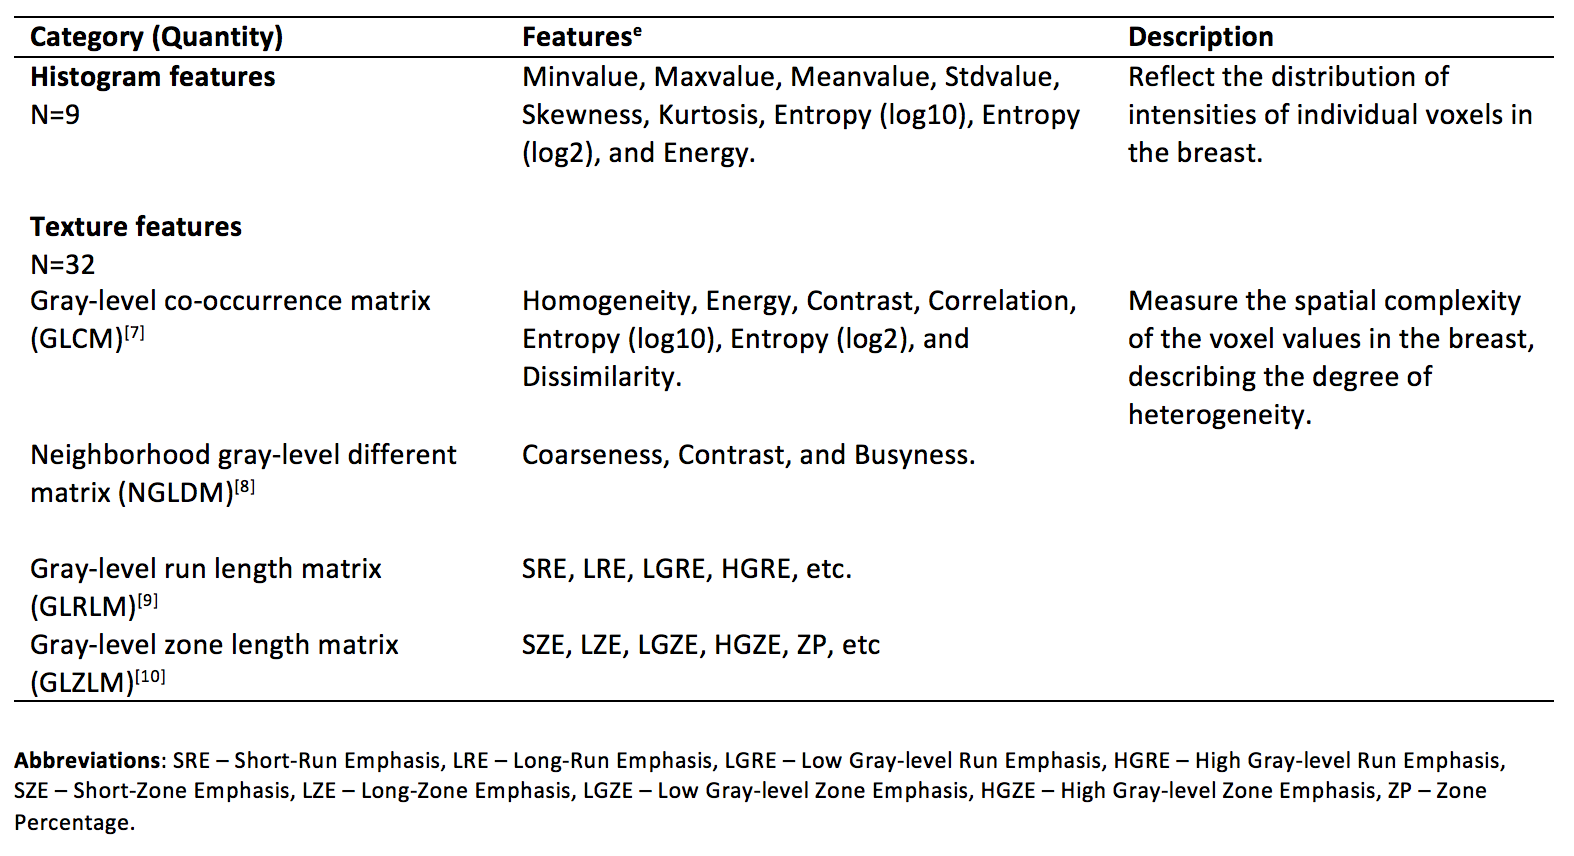
The BD measurement, MRD, was calculated for each scan using our previous method[4] from the fat-water decomposition MRI. A total of 41 radiomic features were extracted using LIFEx 4.0 [5] on the breast region from T1-weighted images after downsampling the in-plane resolution by a factor of 4 and normalizing the image intensity (rescale the maximum to 640 in the breast region), with 64 gray levels. Table 1 shows the details of the extracted features. Using data from 25 baseline scans, a LASSO model with 3-fold cross-validation was performed to select the most important features to predict MRD, i.e. those features with nonzero coefficients when the minimum cross-validation error was reached.
Results
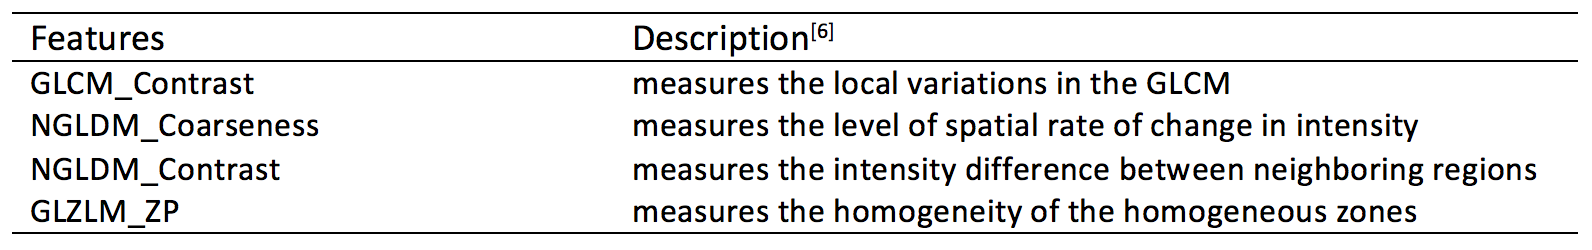
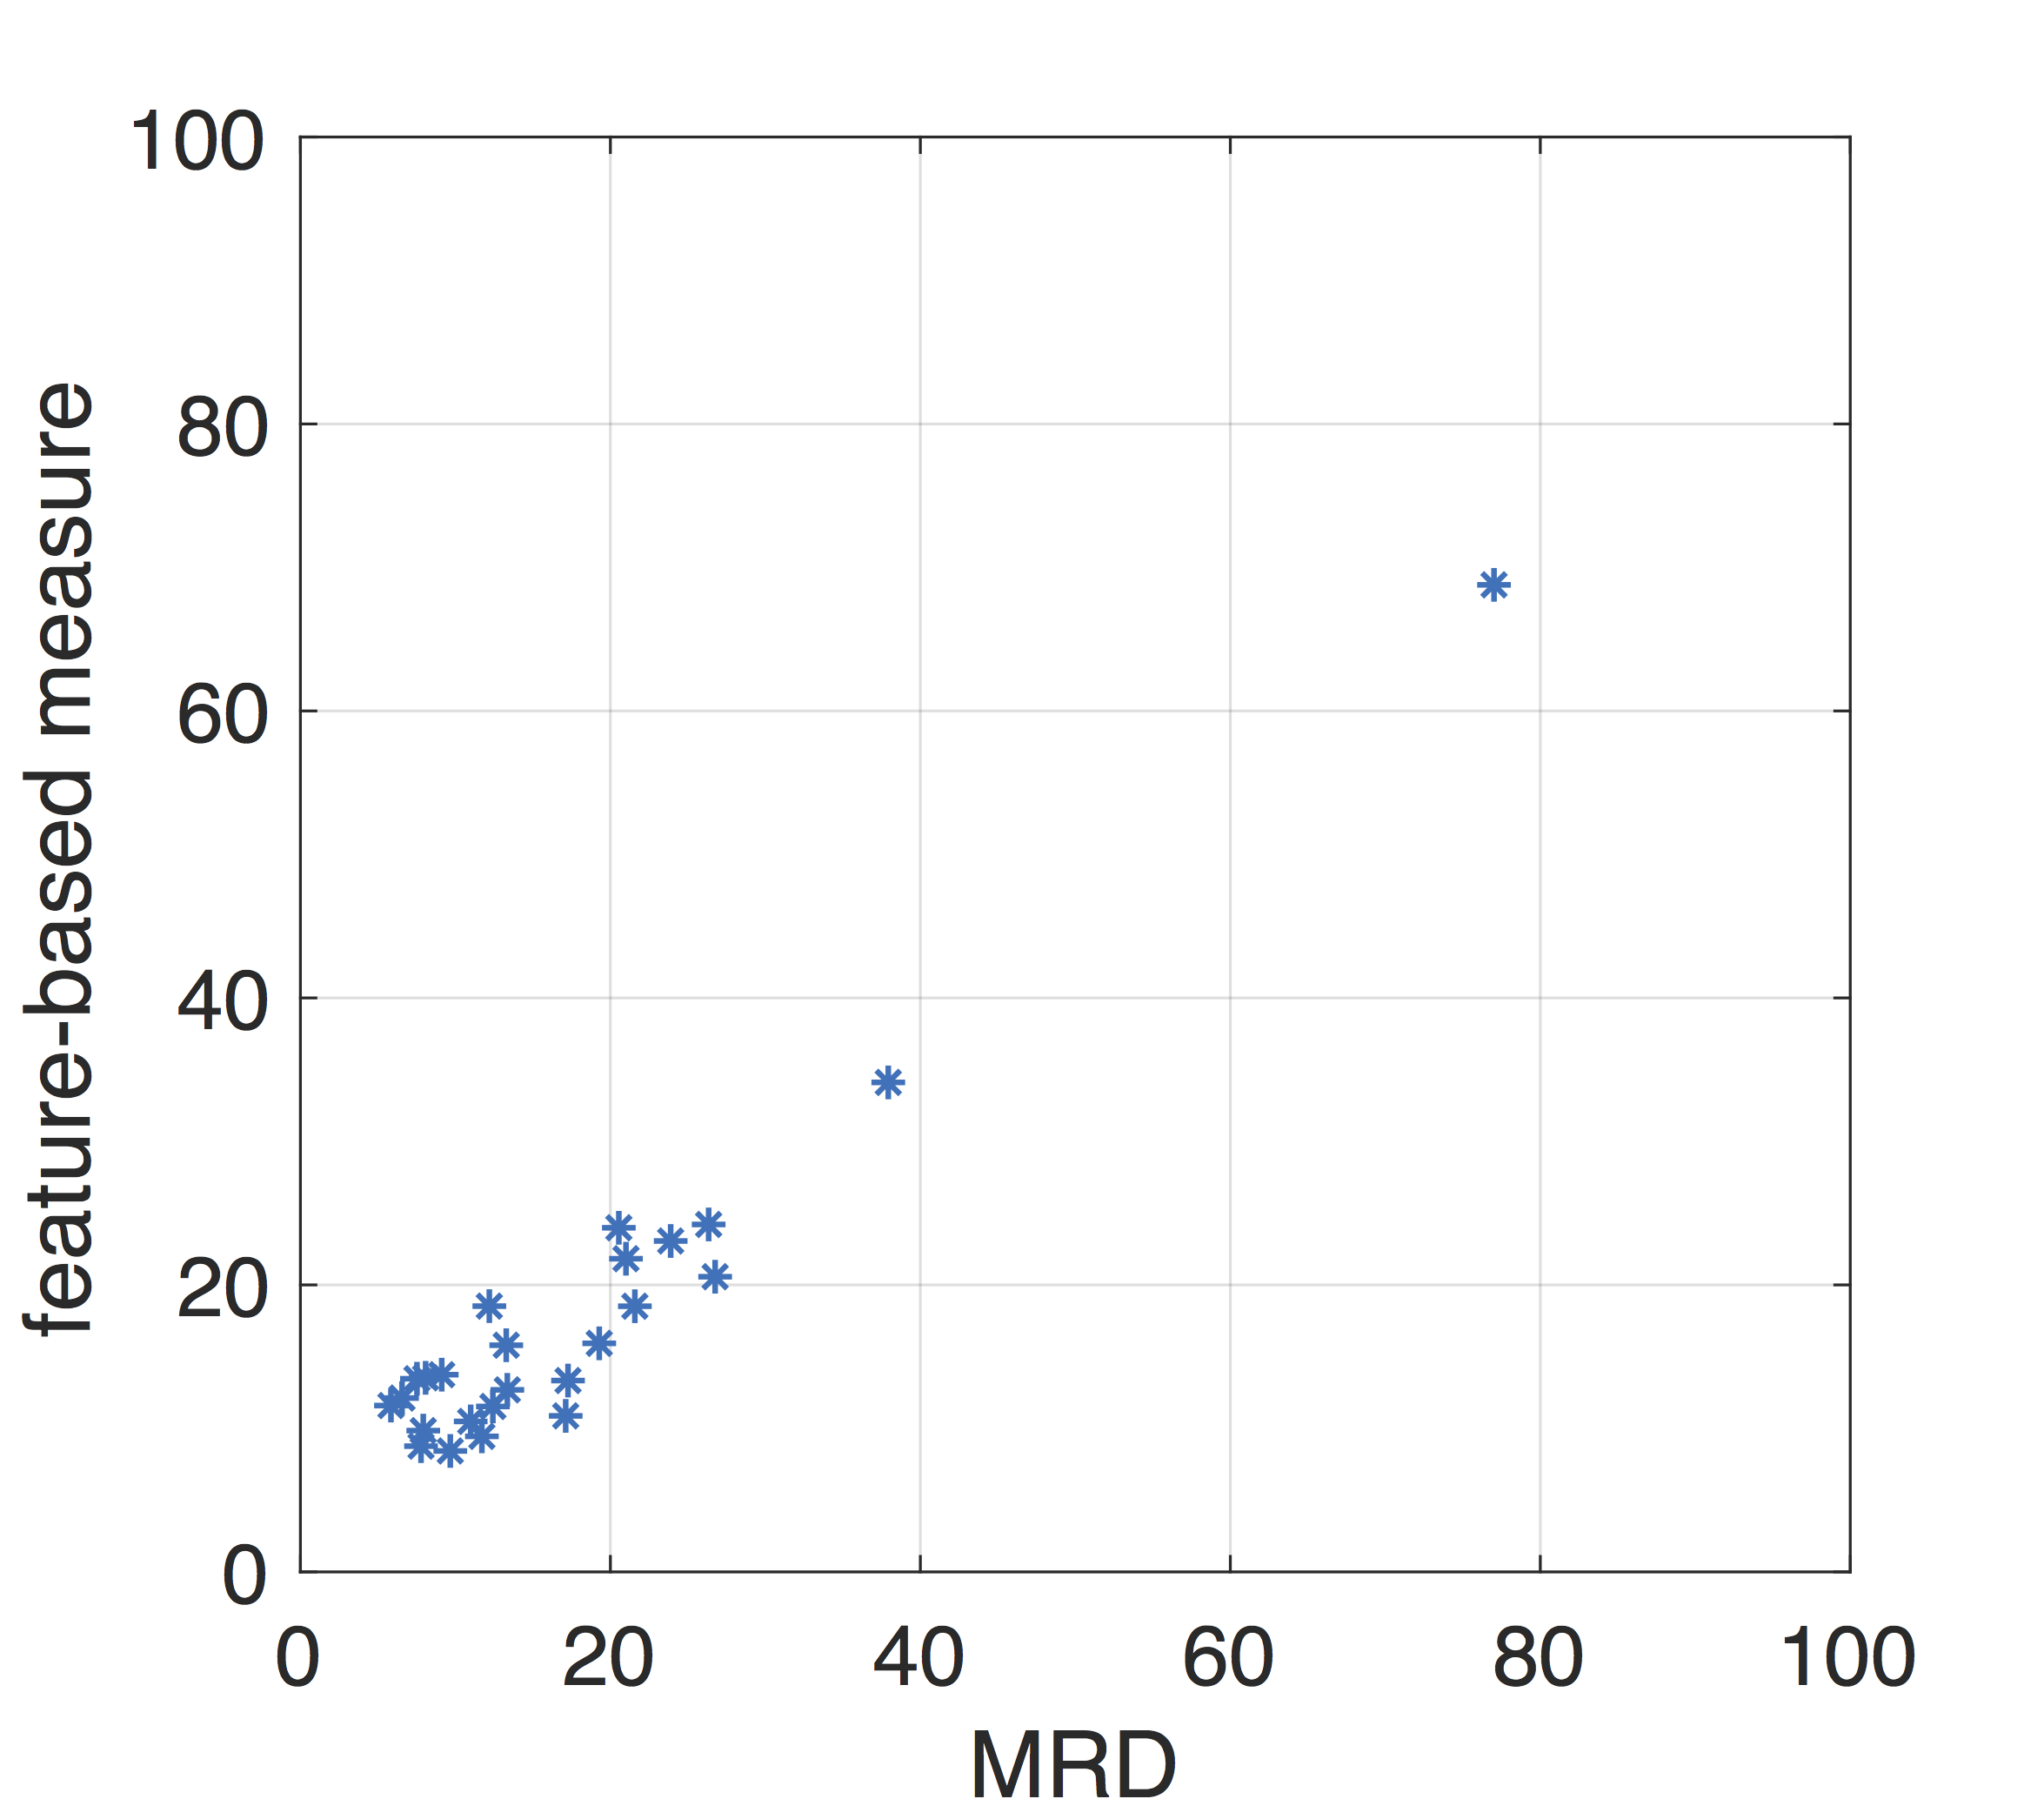
The root-mean-square of the estimation deviation was 6.9% (MRD is directly comparable to percent mammographic density, representing breast density with theoretical range 0%~100%), and at this time, four radiomic features were selected as the most significant predictors of MRD as shown in Table 2. Based on the LASSO model, Figure 1 shows the measure generated by these four features was strongly correlated with the MRD (Pearson rho=0.97, p<<0.0001).Discussion
Our previous MRD, which is directly comparable to mammographic density, provides an accurate and reproducible BD measurement for assessing breast cancer risk in clinical trials[4]. However, it requires images acquired with multi-echo fat-water decomposition MR images. MRD measures the fraction of fibroglandular tissue and actual water content in each voxel and is able to detect changes of small structures in the breast tissue composition which also resolve the partial volume effect. However, this technique is limited in clinical practice as fat-water decomposition MRI, although acquisition time is <1min, has not been included in the routine clinical breast MRI examinations. Therefore, it is of great interest to investigate if the information from the routine T1-weighted MRI could represent the MRD for evaluating the breast cancer risk in clinical practice. Radiomic features are able to capture the heterogeneity and complexity of the microenvironment in the breast, which can potentially reflect the breast density. Our results show that a feature-based measure generated from the routine T1-weighted MRI was strongly correlated with MRD. Although it is not yet as quantitatively accurate as MRD, this method is still clinically useful. For example, the current BIRADS classification for breast density using mammograms; while this feature-based measure, available for breast cancer patients receiving the routine T1-weighted MRI, avoids the ionization radiation and breast compression. Further research will be conducted to determine if other features or better image normalization can be useful for accurate quantitation.Conclusion
The radiomic features extracted from routine T1-weighted MRI can potentially represent breast density measurements for breast cancer patients, enabling the possibility of assessing breast cancer risk in clinical practice. In addition, T1-weighted MRI is a clinical routine breast MRI sequence, allowing easy dissemination of this method for clinical adoption.Acknowledgements
This work was supported by National Institutes of Health (R03CA223052), Carol M. Baldwin Foundation for Breast Cancer Research (2017-Huang), Walk-for-Beauty Foundation.References
1. Boyd, N.F., et al., Breast tissue composition and susceptibility to breast cancer. Journal of the National Cancer Institute, 2010.
2. Boyd, N.F., et al., Heritability of mammographic density, a risk factor for breast cancer. New England Journal of Medicine, 2002. 347(12): p. 886-894.
3. Engmann, N.J., et al., Population-Attributable Risk Proportion of Clinical Risk Factors for Breast Cancer. JAMA oncology, 2017.
4. Ding, J., et al., Reproducible automated breast density measure with no ionizing radiation using fat‐water decomposition MRI. Journal of Magnetic Resonance Imaging, 2018.
5. Nioche, C., et al., A freeware for tumor heterogeneity characterization in PET, SPECT, CT, MRI and US to accelerate advances in radiomics. Journal of Nuclear Medicine, 2017. 58(supplement 1): p. 1316-1316.
6. Orlhac, F., C. Nioche, and I. Buvat, Technical appendix—local image features extraction——LIFEx—. 2016, Paris.
7. Haralick, R.M. and K. Shanmugam, Textural features for image classification. IEEE Transactions on systems, man, and cybernetics, 1973(6): p. 610-621.
8. Amadasun, M. and R. King, Textural features corresponding to textural properties. IEEE Transactions on systems, man, and Cybernetics, 1989. 19(5): p. 1264-1274.
9. Xu, D.-H., et al., Run-length encoding for volumetric texture. Heart, 2004. 27: p. 25.
10. Thibault, G., et al., Shape and texture indexes application to cell nuclei classification. International Journal of Pattern Recognition and Artificial Intelligence, 2013. 27(01): p. 1357002.
Figures