1723
Predicting Pathological Response to Neoadjuvant Chemotherapy Using 3D Texture Feature Radiomics on Baseline Dynamic Contrast-Enhanced (DCE) MRIYifan Wu1, Daniel S. Hippe1, Ginger L. Lash1, Lanell M. Peterson1, Jennifer M. Specht2, and Savannah C. Partridge1
1Radiology, University of Washington, Seattle, WA, United States, 2Medicine, University of Washington, Seattle, WA, United States
Synopsis
There is emerging data supporting the value of texture and other radiomics features extracted from dynamic contrast-enhanced (DCE) MRI to characterize breast cancer subtypes and recurrence risk. DCE texture features may also provide unique value in predicting response to neoadjuvant chemotherapy (NAC). Our study investigated the predictive value of pretreatment DCE tumor texture features in 30 women with triple negative and luminal-B cancers undergoing NAC. We found higher-order texture features significantly predicted pathologic response, while other standard quantitative metrics did not. Our findings suggest texture features on DCE MRI may provide valuable information prior to treatment to help tailor therapies.
Introduction
A single MRI examination can provide insights on a variety of tumor physiologic features. Specifically, dynamic contrast-enhanced (DCE) MRI has been commonly used for detecting and characterizing breast cancers based on morphologic and kinetic features. Recent studies have shown that texture features, such as Gray Level Co-occurrence Matrix (GLCM) features, on the DCE images correlate with breast cancer biology in terms of molecular subtypes and recurrence risk.1-5 Previous studies have combined radiomics with machine learning methods to predict pathologic response to neoadjuvant chemotherapy (NAC) in breast cancer patients.6,7 However, correlation of texture features with treatment response is not yet well-studied, and may provide novel markers to predict response and tailor therapies. Therefore, the purpose of this study was to investigate whether tumor texture features on pretreatment DCE MRI correlate with pathologic complete response (pCR) in women undergoing NAC for breast cancer.Methods
In this IRB-approved prospective study, 35 women with locally advanced breast cancer (median age 43 yrs; range 31-66 yrs) underwent serial breast MR and FDG-PET/CT imaging during NAC: pre-therapy, mid-therapy (2-12 weeks after start of NAC), and post-therapy (after completion of NAC). To reduce heterogeneity of the patient population, we restricted analysis to patients in the two largest subtype groups of triple negative (n=12) and luminal-B (n=18) cancers. Multiparametric breast MRI was performed on a 3T Philips Achieva scanner with a 16-channel breast coil (Philips Healthcare, Best, Netherlands), and included diffusion-weighted imaging (DWI, b=0,100,800s/mm2) and fat-suppressed dynamic contrast enhanced (DCE) sequences. DCE was performed with post-contrast volumes centered at 2, 5, and 8 mins after contrast injection. In addition to standard morphologic and kinetic assessment, radiomics analysis was performed on the baseline (pre-therapy) MRI using the first post-contrast images only. Regions-of-interest (ROI) for radiomics measurements were drawn on every slice where the lesion was visible, and reasonable thresholds were applied to mask out normal tissue (Figure 1). An adapted MATLAB software tool was used to perform 3D radiomics measurements on the selected voxels in the ROI, with intensity level quantization performed before feature calculation (using the Lloyd method).8 Thirty-eight higher-order texture features were calculated based on GLCM, Gray Level Run-Length Matrix (GLRLM), Gray Level Size-Zone Matrix (GLSZM), and Neighboring Gray Tone Difference Matrix (NGTDM) (Figure 2).9-12 Three 1st order global texture features were calculated before quantization. FDG-PET imaging was performed on a GE PET/CT scanner (GE Healthcare, Waukesha, WI). ROIs of approximately 1.5cc were drawn over the area of highest uptake to calculate SUVmax and SUVmean. Other relevant clinical and pathologic factors were collected from clinical reports, including pathologic response (pCR or non-pCR). Univariate associations of imaging features with pCR were assessed by Wilcoxon rank-sum test without multiple comparison adjustment, p<0.05 was considered significant. Performance for predicting pCR was evaluated by ROC analysis and calculating the area under the curve (AUC).Results
Of 30 women with triple negative and/or luminal-B cancer, one did not undergo surgery due metastatic disease and was excluded. The remaining 29 women were included in analysis, of which 10 (34%) achieved pCR and 19 (66%) were non-pCR; 17 (59%) were luminal-B and 12 (41%) triple negative. From baseline 3D texture analysis, 5 GLCM features and 3 GLRLM features were significantly associated with pCR (p < 0.05), with AUCs ranging 0.73-0.83 (Table 1). No association with pCR was seen for Global, GLSZM, and NGTDM features. Among the standard imaging features evaluated (e.g., FDG-PET SUV, DCE-MRI tumor volume and kinetics, DWI ADC), only mean signal enhancement ratio (SER) was predictive of pCR (AUC=0.74, p=0.04), while ADC showed a trend (AUC=0.72, p=0.054).Conclusion and Discussion
Our findings support the hypothesis that radiomics on baseline DCE MRI can predict breast cancer pathological response to NAC. Study results suggest that for luminal-B and triple negative tumors, response to NAC is correlated with appearance on DCE-MRI in terms of gray level intensity variation and distribution reflected by GLCM and GLRLM texture features. Due to the small sample size, further multivariate analysis was not possible for this study. However, our findings suggest that baseline MRI texture features may hold prognostic value in breast cancer treatment and warrant further validation in larger studies.Acknowledgements
This research was supported by National Institutes of Health Grant P50CA138293 and a gift from the Safeway Foundation.References
- Li H. et al. Quantitative MRI radiomics in the prediction of molecular classifications of breast cancer sybtypes in the TCGA/TCIA data set. npj Breast Cancer. 2016 May; 2(2016): 16012
- Fan M. et al. Radiomic analysis reveals DCE-MRI features for prediction of molecular subtypes of breast cancer. PLOS ONE. 2017 Feb; 12(2): e0171683
- Li H. et al. MR imaging radiomics signatures for predicting the risk of breast cancer recurrence as given by research versions of MammaPrint, Oncotype DX, and PAM50 gene assays. Radiology. 2016 Nov;281(2): 382-391
- Li H. et al. Quantitative MRI radiomics in the prediction of molecular classifications of breast cancer subtypes in the TCGA/TCIA data set. 2016 May;16012(2016)
- Ashraf A. et al. Identification of intrinsic imaging phenotypes for breast cancer tumors: preliminary associations with gene expression profiles. 2014 Aug;272(2):374-84
- Pinker-Domenig K. et al. Radiomics with magnetic resonance imaging of the breast for early prediction of response to neo-adjuvant chemotherapy in breast cancer patients. ISMRM 2018
- Jahani N. et al. Deformable image registration as a tool to improve survival prediction after neoadjuvant chemotherapy for breast cancer: results from the ACRIN 6657/I-SPY-1 trial. 2018 Feb. Proceedings SPIE Medical Imaging 2018: Computer-Aided Diagnosis;10575: pp. 105752S-105752S-7
- Vallieres M. et al. A radiomics model from joint FDG-PET and MRI texture features for the prediction of lung metastases in soft-tissue sarcomas of the extremities. Phys. Med. Biol. 2015 June;60(2015): 5471-5496
- Haralick R. et al. Textural features for image classification. IEEE Trans. Syst. 1973 June; 610-621
- Dasarathy B. et al. Image characterizations based on joint gray level-run length distributions. Pattern Recogn. Lett. 1991 Aug;12(8): 497-502
- Thibault G. et al. Texture indexes and gray level size zone matrix: application to cell nuclei classification. Pattern Recognition and Information Processing. 2009 Nov; pp.140-145
- Sun C. et al. Neighboring gray level dependence matrix for texture classification. Computer Vision, Graphics, and Image Processing. 1983 Sep;23(3): 341-352
Figures
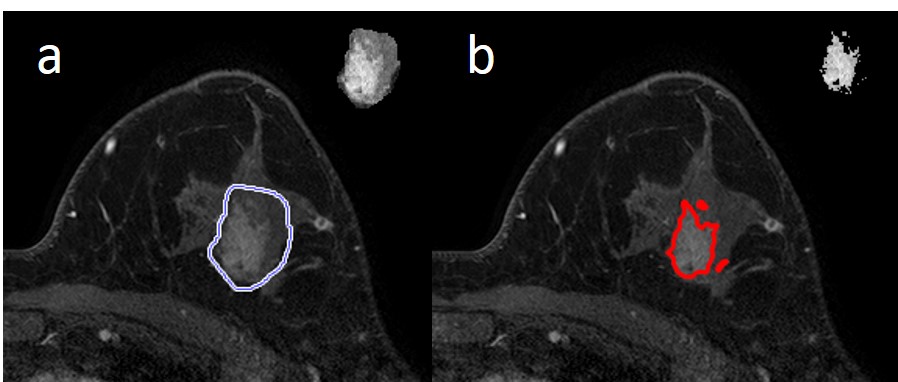
Figure 1. ROI
illustrating the process of image thresholding. a) ROI drawn around tumor
before thresholding applied. b) ROI auto-selected by software after
thresholding. Insets demonstrate segmented tumor regions, with final region
(right) used for texture feature calculations.
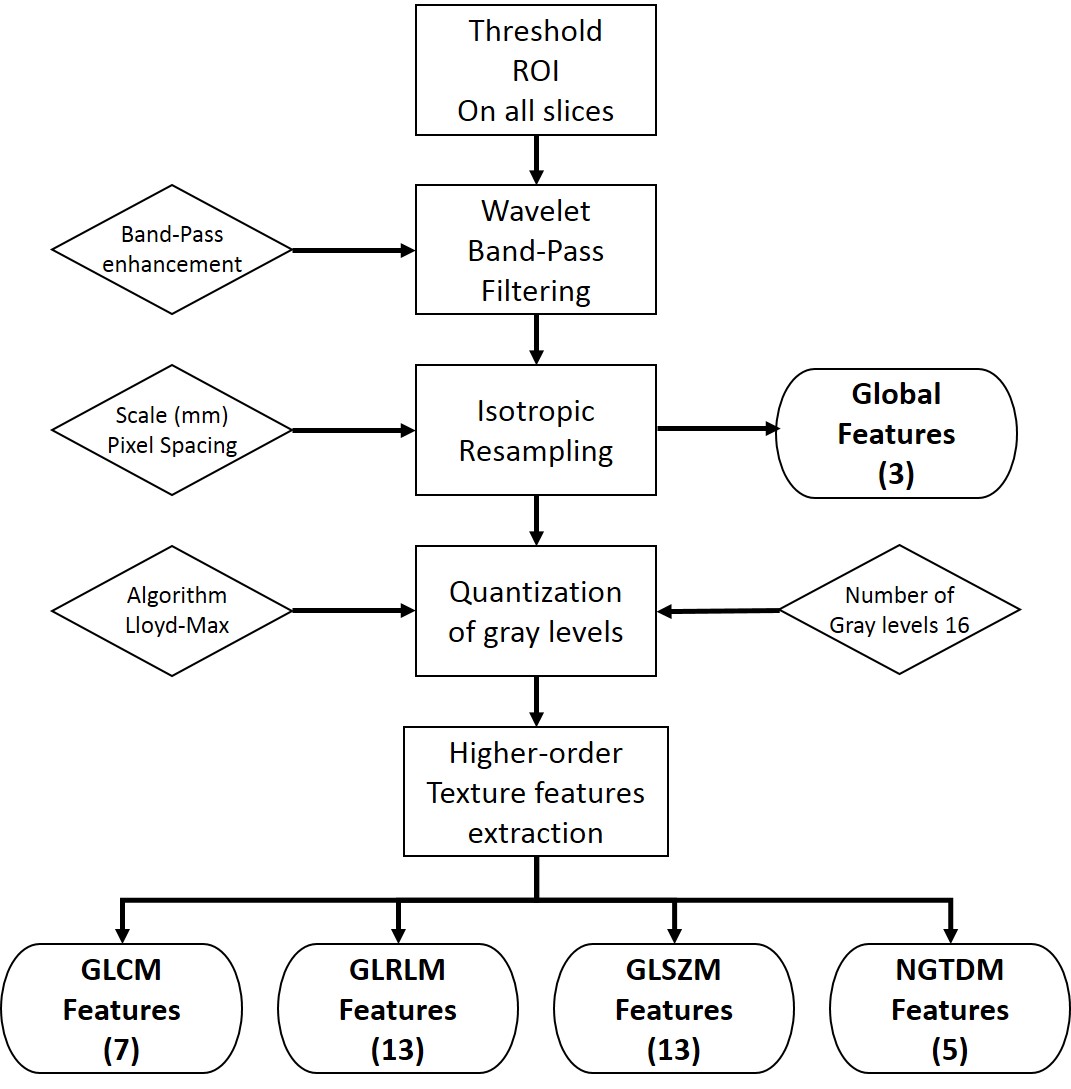
Figure 2. Flow chart demonstrating lesion texture feature calculation process.
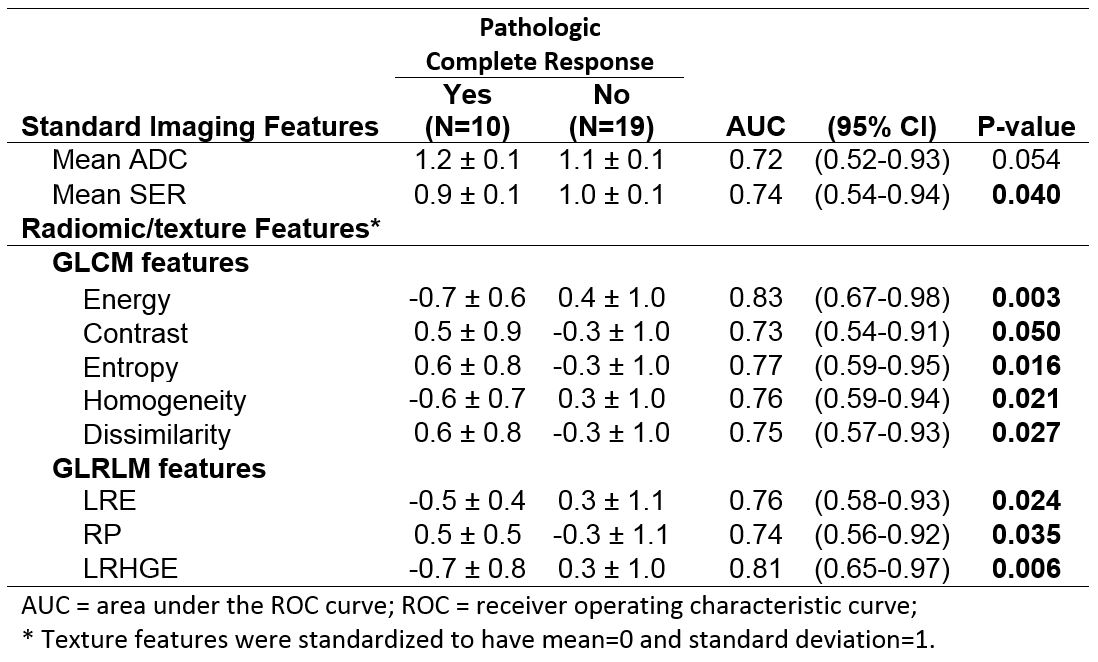
Table 1. Significant
associations of radiomics features with pCR in luminal-B and triple negative
lesions.