1716
Texture Analysis based on functional magnetic resonance imaging for evaluation of renal functionGumuyang Zhang1, Hao Sun1, Jianfeng Sun2, Hailong Zhou1, Yanhan Liu1, Ning Guo2, Jing An3, Huadan Xue1, and Zhengyu Jin1
1Peking Union Medical College Hospital, Beijing, China, 2Philips Healthcare, Shanghai, China, Beijing, China, 3MR Collaboration, Siemens Healthcare Ltd, Beijing, China, Beijing, China
Synopsis
Texture analysis (TA) based on apparent diffusion coefficient (ADC), T1 and T2 mapping to evaluate glomerular filtration rate (GFR) has not been explored before. A total of 116 participants underwent DWI, T1 and T2 mapping of both kidneys on a 3T MR scanner and texture features were measured for the cortex and medulla of each kidney. Models incorporating texture features mainly quantified from ADC and T1 maps produced a satisfactory performance for detecting abnormal renal function and characterizing the different severity of GFR decline. It’s promising that TA based on ADC and T1 maps could serve as imaging markers to evaluate renal function.
Introduction
Evaluation of renal microstructure is important for managing kidney diseases and it is currently assessed by invasive renal biopsy, which has side effects and sampling bias. Functional magnetic resonance imaging (MRI) including diffusion-weighted imaging (DWI) has been explored to noninvasively evaluate glomerular filtration rate (GFR), but the application of T1 and T2 mapping in the assessment of renal function are limited1. Texture analysis (TA) is a novel technique that quantifies tissue heterogeneity and has been used to classify tumors, predict prognosis and monitor treatment responses2. In this study, we examined whether TA based on the apparent diffusion coefficient (ADC), T1 and T2 values can serve as imaging biomarkers to detect GFR decline and evaluate renal function.Methods
A total of 116 participants including 22 healthy volunteers (12males, 10 females; age, 29 ± 6 years) and 94 patients (57 males, 37 females; age, 42 ± 14 years) with confirmed diagnosis of kidney diseases (Gitelman syndrome, n=20; IgA nephropathy, n =26; IgG4 nephropathy, n=12; malignant hypertension, n =8; chronic kidney disease, n =28) underwent axial T2-weighted imaging, DWI, T1 and T2 mapping of both kidneys on a MAGNETOM Skyra 3T MR scanner (Siemens Healthcare, Erlangen, Germany) using an 18-channel phased-array body coil combined with a 32-channel spine coil with imaging parameters described in Table 1. Renal function based on estimated GFR (eGFR, ml/min/1.73 m2) was classified as follows: eGFR: ≥90, normal, n=46; 60 to 89, mildly decreased, n=14; 30 to 59, moderately decreased, n=27; 15 to 29, severely decreased, n=19; < 15, kidney failure, n=10. TA was performed with the TexRAD software on ADC, T1, and T2 maps. Regions of interest (ROIs) were placed manually in to the cortex and medulla of both kidneys. Texture parameters of mean gray-level intensity (mean), standard deviation (sd), entropy, mean of positive pixels (mpp), skewness and kurtosis quantified at different Spatial Scaling Factors (SSF 0,2,3,4,5,6) were measured for the cortex and medulla of each kidney respectively. Two central axial slices were selected for the measurements and the values obtained were averaged. We selected the texture features with Analysis of Variance (ANOVA) and built the models with Linear Discriminant Analysis (LDA) to distinguish between normal (eGFR≥90) and abnormal (eGFR<90) renal function and Supported Vector Machine (SVM) to characterize the severity of impaired renal function (eGFR:≥60 v.s 30-59; 30-59 v.s <30). Receiver operating characteristic (ROC) analysis was performed and the area under the ROC curve (AUC) was calculated. Above process were implemented on with scikit-learn (scikit-learn.org) and FAE (https://github.com/salan668/FAE) on Python 3.5.4 (https://www.python.org/).Results
As for distinguishing between normal and abnormal renal function, we found that LDA with 10 texture features could detect eGFR decline with AUC=0.914 (95% CI: 0.857-0.966), accuracy=88.1%, sensitivity=93.3%, specificity=80.5%, negative predictive value (NPV)=89.2% and positive predictive value (PPV)=87.5%. The selected 10 texture features and the corresponding coefficients in the LDA model were shown in Table 2. As for assessing the severity of impaired renal function, we found that SVM with 8 texture features could distinguish between eGFR≥60 and eGFR 30-59 with AUC=0.910 (95% CI: 0.846-0.962), accuracy=87.1%, sensitivity=87.8%, specificity=86.5%, NPV=88.2%, PPV=86.0% and the selected 8 texture features and the corresponding coefficients in the SVM model were shown in Table 3. We also found that SVM with 15 features could differentiate between eGFR 30-59 and eGFR<30 with AUC=0.928 (95% CI: 0.845-0.990) and accuracy=87.8%, sensitivity=96.3%, specificity=77.3%, NPV=94.4%, PPV=83.9% and the selected texture features and the corresponding coefficients in this SVM models were shown in Table 4. The ROC curves of all the classifications were shown in the Figure 1.Discussion
This study investigated the potential of texture parameters in the renal cortex and medulla quantified from ADC, T1 and T2 maps to characterize the severity of eGFR decline. Our results demonstrated that texture features based on functional MRI produced satisfactory classifications of renal function. Mean, skewness and kurtosis from ADC map, and mean, mpp, skewness and kurtosis from T1 map seem to be helpful texture features while entropy and sd are not correlated with renal function. It’s worth pointing out that very little of the T2 map may have to do with the evaluation of renal function as none of the texture features quantified from renal cortex on T2 map were selected to build any models and only kurtosis (SSF2) and skewness (SSF4) quantified from renal medulla on T2 map were selected to distinguish between moderately and severely decreased renal function.Conclusion
Texture analysis based on the ADC, T1 and T2 values can noninvasively evaluate renal function.Acknowledgements
NoneReferences
1. Caroli A, Schneider M, Friedli Iris, et al. Diffusion-weighted magnetic resonance imaging to assess diffuse renal pathology: a systematic review and statement paper. Nephrol Dial Transplant. 2018; 33: ii29-ii402. Miles KA, Ganeshan B, Hayball MP. CT texture analysis using the filtration-histogram method: what do the measurements mean? Cancer Imaging. 2013; 13:400-406.Figures
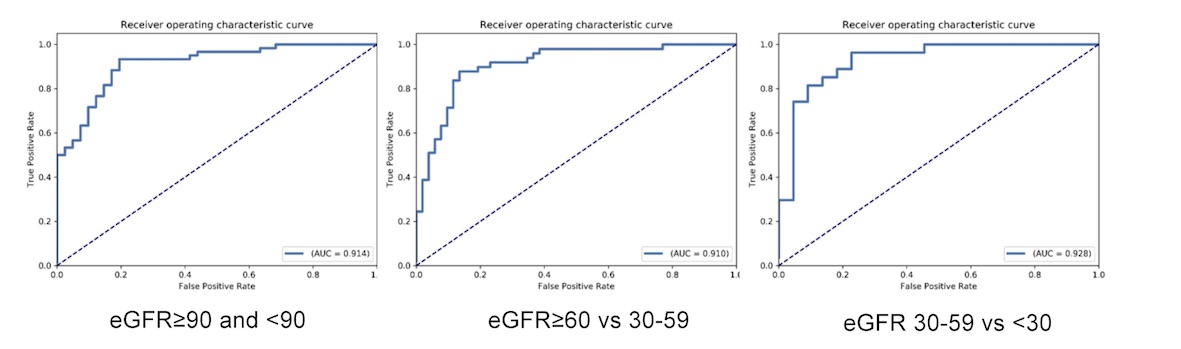
The ROC curves of all the classifications.
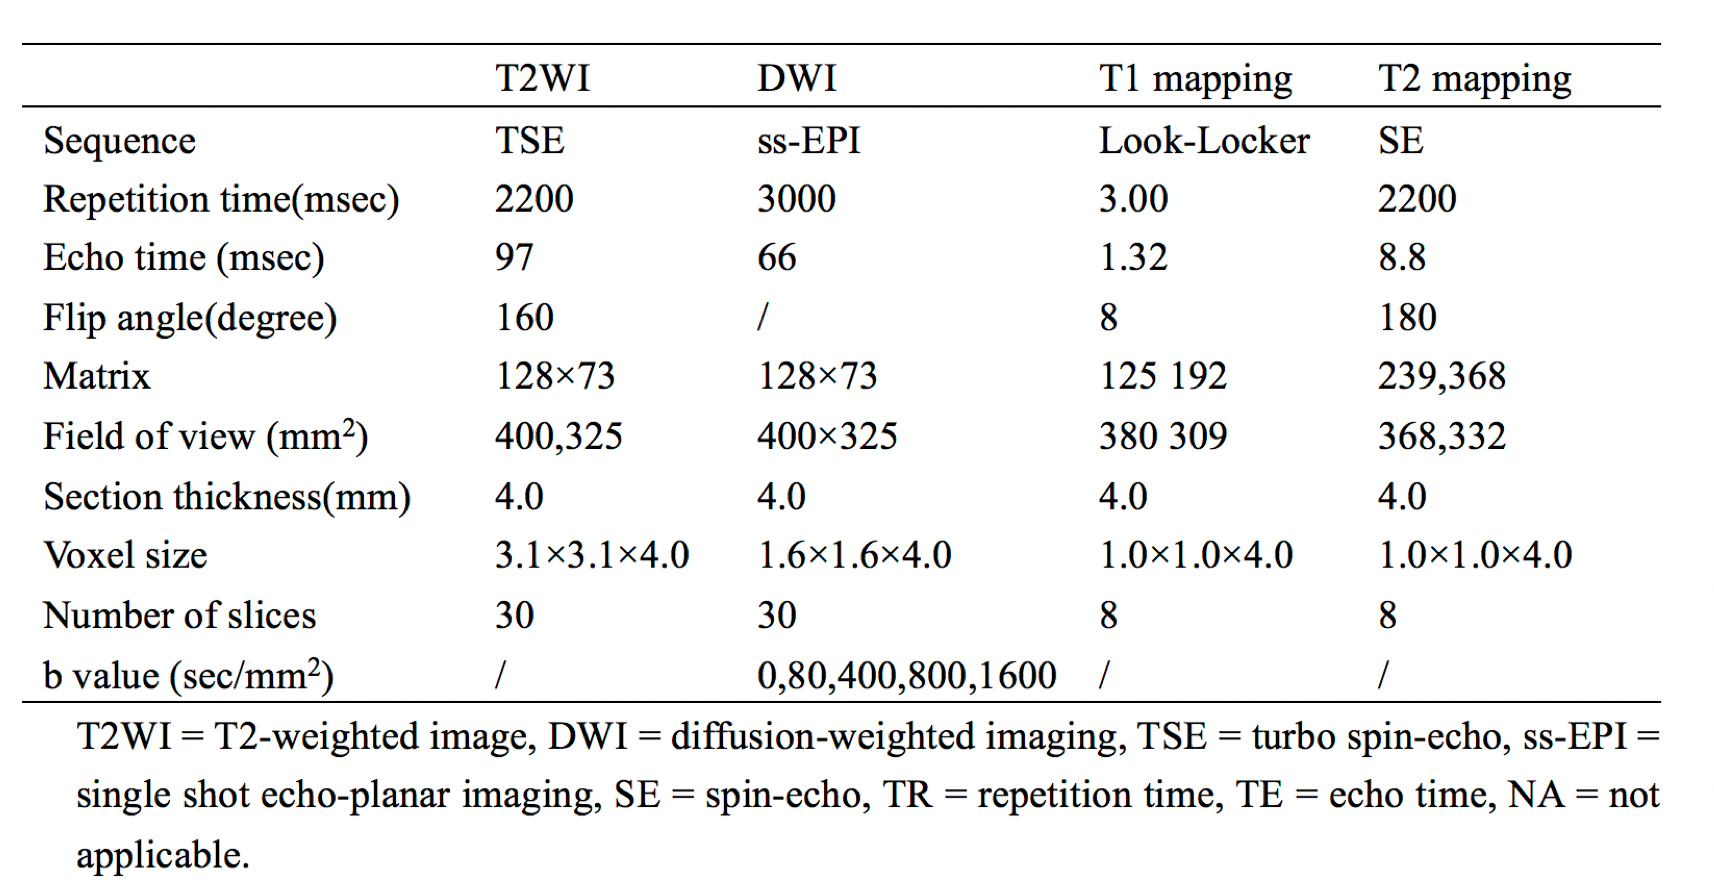
Table 1. Imaging parameters for renal functional MR.
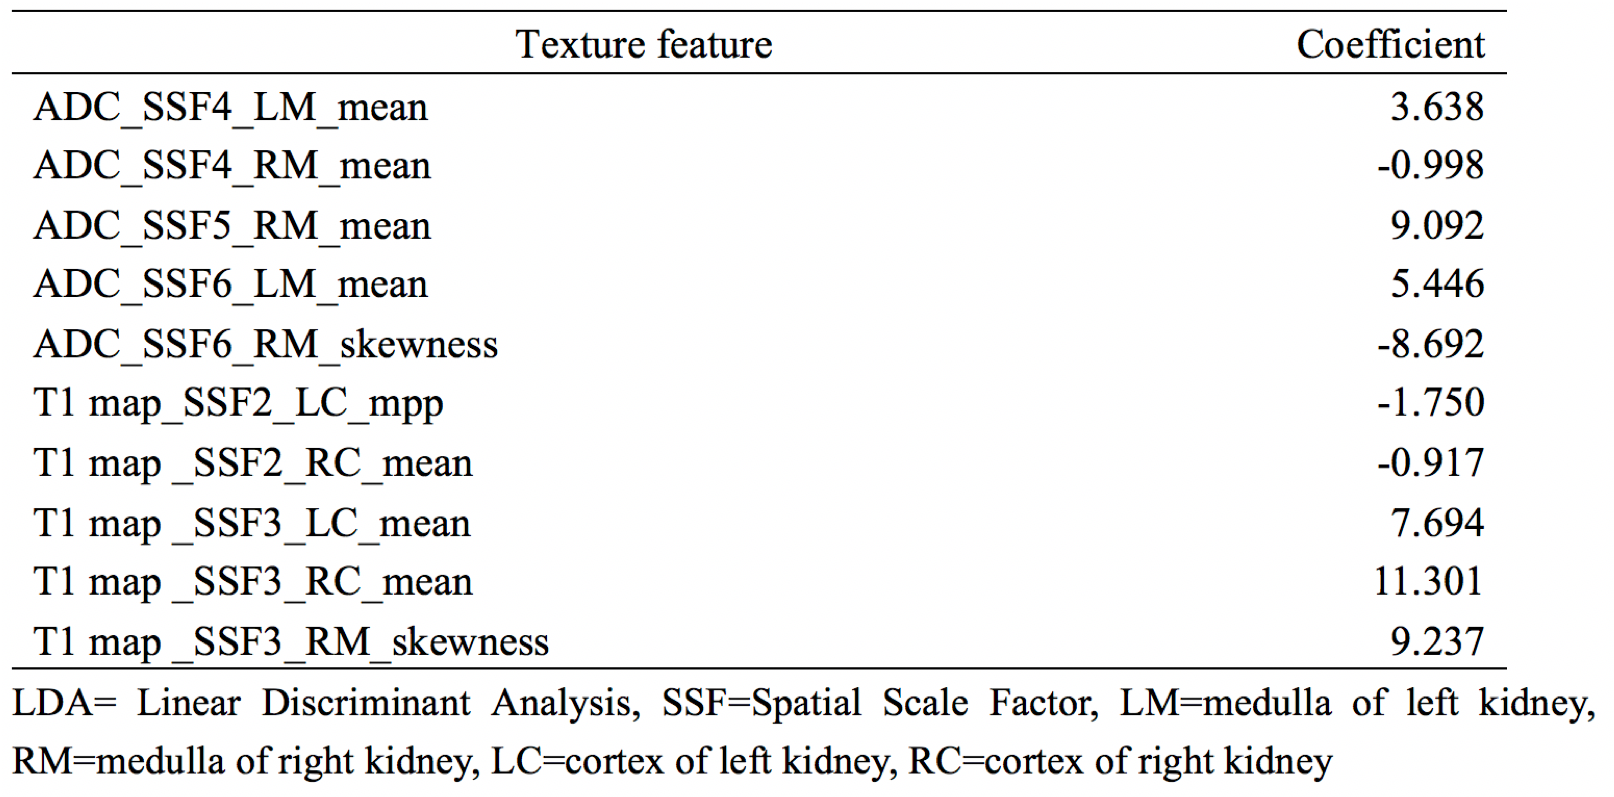
Table 2. The selected texture features and the corresponding coefficients of LDA for classification between normal and abnormal renal function.
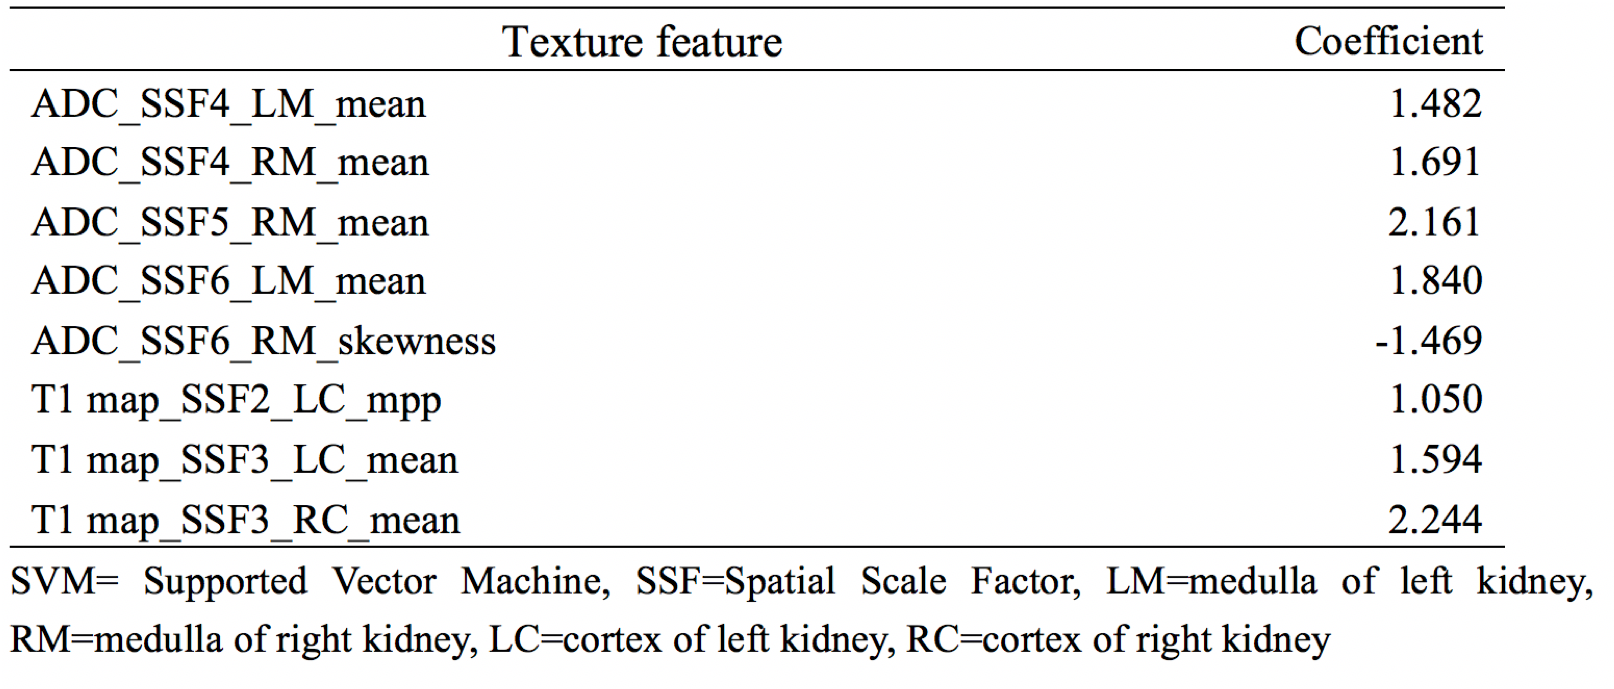
Table 3. The selected texture features and the corresponding coefficients of SVM for classification between mildly and moderately decreased renal function.
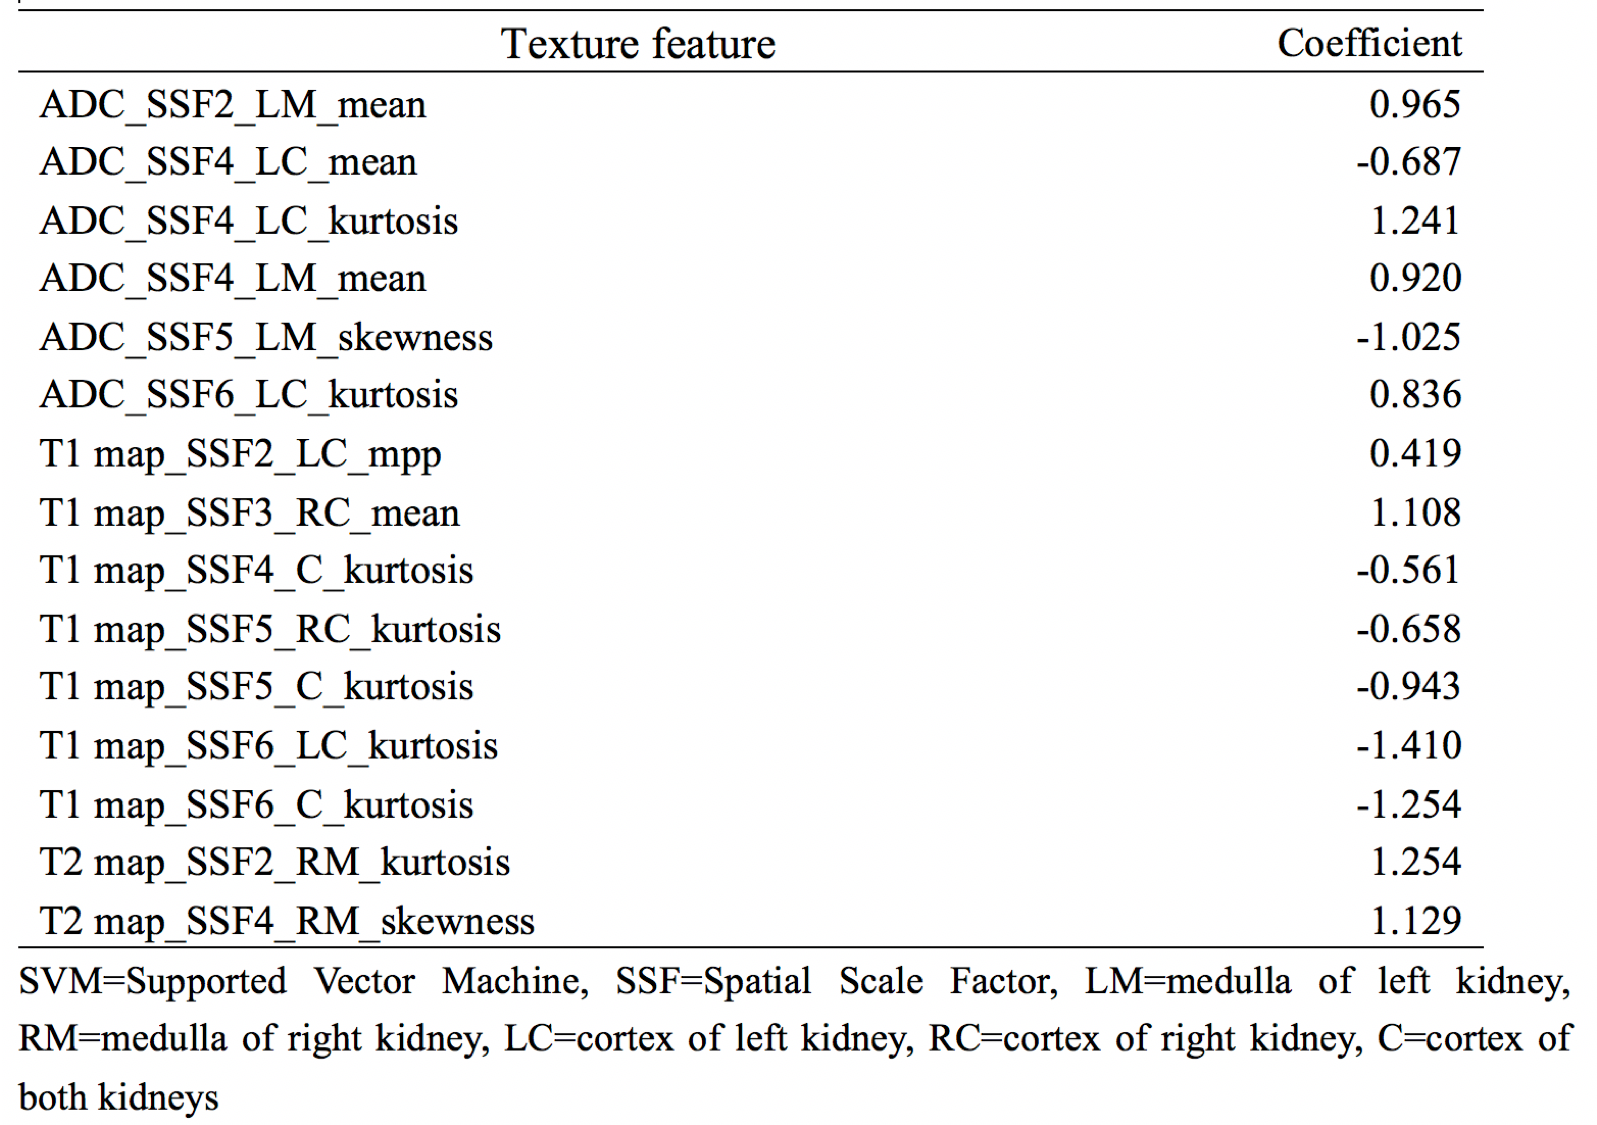
Table 4. The selected texture features and the corresponding coefficients of SVM for classification between moderately and severely decreased renal function.