1714
Prediction molecular subtypes of Breast Cancer by MRI Radiomics1Radiology, JiLin Cancer Hospital, ChangChun, China, 2Radiology, Jilin Cancer Hospital, ChangChun, China, 3Thoracic Oncology, Jilin Cancer Hospital, ChangChun, China, 4Philips Healthcare, shanghai, China
Synopsis
Breast cancer molecular subtypes are indicators of disease free and overall survival. This study aimed to investigate whether quantitative radiomic features extracted from MRI images are associated with molecular subtypes of breast cancer. 135 women diagnosed with invasive breast cancer were enrolled and divided into 3 groups as follow: triple-negative vs non–triple-negative, HER2-enriched vs non–HER2-enriched, and luminal (A + B) vs nonluminal. A machine learning scheme was employed for the classification. The mean AUC of the three models are 0.76, 0.85 and 0.73, respectively. There is a moderate association between tumour molecular biomarkers and radiomic features extracted from MRI images.
Purpose
Breast cancer molecular subtypes, based on genotype variation, are indicators of disease free and overall survival1. Breast cancer subtypes can be classified by genetic array testing or approximated using immunohistochemistry markers in typical clinical practice. Immunohistochemistry requires tissue specimens typically obtained by a needle biopsy. However, due to the relatively small tissue sample size and tumor heterogeneity, the assessment on a small tissue sample cannot represent the characteristics of the entire tumor. Radiomics, the extraction and analysis of quantitative imaging features that has the ability to capture a broader range of tumor heterogeneity, enables imaging phenotypes to be correlated with genetic information2. This mineable data can be used to build models, which could potentially classify breast cancer subtypes on magnetic resonance imaging (MRI). This study aimed to investigate whether quantitative radiomic features extracted from MRI images are associated with molecular subtypes of breast cancer.Methods
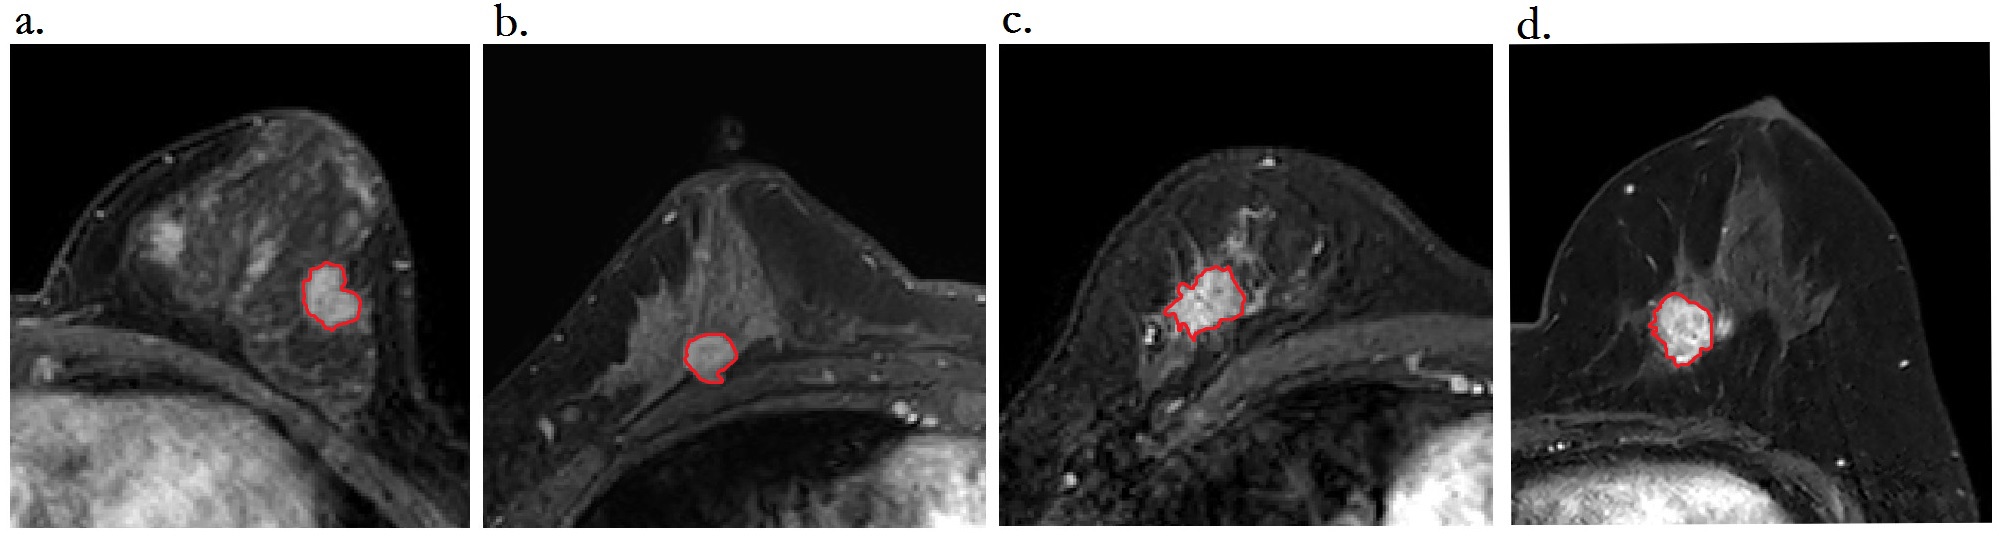
In this retrospective study, 135 women diagnosed with invasive breast cancer between Oct.2016 and Sep.2018 were enrolled. This cohort included 17(12.6%) triple-negative, 18(13.3%) human epidermal growth factor receptor 2(HER2)-enriched, 20(16.0%) luminal A, and 80(59.3%) luminal B lesions. Clinical and pathologic features were collected. A dedicated software (Philips radiomics tool) was used to draw the contour of the tumors and calculate the features. Total 1765 radiomic features quantified tumor characteristics for each patient using tumor intensity statistics, size and shape, intensity statistics, and texture. These radiomic features quantified tumor characteristics using tumor intensity statistics, size and shape, intensity statistics, and texture.In the following feature dimension reduction analysis, we used Pearson correlation, hierarchical cluster analysis and principal component analysis (PCA) to select the key features. In modeling stage, we investigated 19 classification methods (including Passive Aggressive Classifier, Perceptron, Ridge Classifier, SGD Classifier, Logistic Regression, AdaBoost Classifier, Bagging Classifier, Extra Trees Classifier, Gradient Boosting Classifier, Random Forest Classifier, K Neighbors Classifier, Support Vector Classifier, Decision Tree Classifier, Linear Discriminant Analysis, Quadratic Discriminant Analysis, MLP Classifier, XGB Classifier, Extra Tree Classifier, Gaussian Process Classifier) for training and prediction. These models were trained on the training cohort and their performance was evaluated on the cross-validation cohort using the area under ROC curve (AUC).Results
We build three models to classify: 1) triple-negative vs non–triple-negative, 2) HER2-enriched vs non–HER2-enriched, and 3) luminal (A + B) vs nonluminal. The machine learning classifier of this six model are chosen to be LinearSVC, AdaBoostClassifier, XGBClassifier, respectively. The performance and ROC curves of each model are shown in Figure 2 and Figure 3. The mean AUC of the three models are 0.76, 0.85 and 0.73, respectively. Beside, the best ROC curves of single feature are also plotted in Figure 4, the corresponding AUCs are 0.77, 0.84 and 0.70, respectively.Discussions
In this study, we conducted a comprehensive radiomics analysis of breast cancer in the context of dynamic contrast enhanced MRI using a machine-learning-based approach. Our results on the three binary classifications of subtypes (ie, triple-negative vs other types, HER2-enhanced vs other types, and luminal vs other types) showed that a set of such quantitative radiomic features is predictive of the molecular subtypes of breast cancer with mean AUC of 0.76, 0.85 and 0.73. The best ROC curves of classifications is the HER2-enhanced vs other types ,as we know , HER2 is a vascular growth factor receptor responsible in part for tumoural angiogenesis. Positive HER2 status has been associated with an increased incidence of multifocal and multicentric disease, increased apparent diffusion coefficient (ADC) scores, and more rapid early enhancement3.4.The results based on the sample size collected so far are encouraging, we can apply this to patients who have difficulty acquiring histopathology, provide assistance for the formulation of its clinical therapy decision. However, our research also has some deficiencies, due to the different proportion of different molecular subtypes in breast cancer patients, as a result, the number of samples varies greatly among different subtypes, and the statistical results will be biased. In the following stage, we will continue to collect related cases, increase the sample size and result credibility, so as to provide higher reliability for clinical diagnosis and treatment reference.Acknowledgements
No acknowledgement found.References
1. Nguyen PL, Taghian AG, Katz MS, Niemierko A, et al. Breast cancer subtype approximated by estrogen receptor, progesterone receptor, and HER-2 is associated with local and distant recurrence after breast-conserving therapy. J Clin Oncol. 2008; 26:2373–2378. [PubMed: 18413639]
2. Boisserie-Lacroix M, Hurtevent-Labrot G, Ferron S, Lippa N, Bonnefoi H, Mac Grogan G.Correlation between imaging and molecular classification of breast cancers. Diagn Interv Imaging.2013; 94:1069–1080. [PubMed: 23867597]
3. Grimm, L. J., Johnson, K. S., Marcom, P. K., Baker, J. A. & Soo, M. S. Can breast cancer molecular subtype help to select patients for preoperative MR imaging?Radiology 274, 352–358 (2015)
4. Martincich, L. et al. Correlations between diffusion-weighted imaging and breast cancer biomarkers. Eur. Radiol. 22, 1519–1528 (2012).
Figures