1711
Automatic prostate and prostate zones segmentation of magnetic resonance images using convolutional neural networksNader Aldoj1, Federico Biavati1, Miriam Rutz1, Sebastian Stober2, and Marc Dewey1
1Charite, Berlin, Germany, 2University of potsdam, Berlin, Germany
Synopsis
The purpose was to develop a fully automatic and accurate tool for prostate and prostate zone segmentation using T2-weighted MRI. Thus, we developed a new neural network named Dense U-Net which was trained on 143 patient datasets and tested on 45 patient datasets. This Dense U-Net compared with the state-of-the-art U-Net achieved an average dice score for the whole prostate of 89.4±0.8% vs. 88.4±0.8%, for the central zone of 83±0.2% vs. 83±0.2%, and for the peripheral zone of 76.9±0.2% vs. 74.6±0.2%, respectively. In conclusion, the developed Dense U-Net was more accurate than the state-of-the-art U-Net for prostate and prostate zone segmentation.
Introduction
Prostate cancer (PCa) is the second leading cause of death among the cancer family in men. Thus, accurate prostate segmentation is an essential step in medical imaging analysis for diagnosis and treatment planning1-3. Furthermore, the importance of segmenting the prostate zones, such as the central zone (CZ) and the peripheral zone (PZ) lies in the fact that the diagnostic guidelines differ depending on in which zone the lesion is located. Thus, lesion detection should always be accompanied by zonal information or at best segmentation for an accurate assessment of tumor severity4. Recently, deep convolutional neural networks (CNNs) became the dominant and most promising methods for automated segmentation in both medical and semantic image segmentation problems. In this study, we address prostate segmentation and its subsequent zones using a novel network architecture inspired by U-Net5 and DenseNet6.Materials and Methods
In this study, a dataset of 188 patients with T2-weighted MR images was used (PROSTATEx challenge). All images were segmented manually and examined by an experienced radiologist. We used 143 patients (including a total of 2982 slices) as the training set and 45 patients (including a total of 912 slices) as the test set. All images were first resampled to a common resolution of 0.5, 0.5, 3.0 mm in x, y, z direction respectively. Then the images were cropped with a 256x256 pixel window positioned at the center of the 3D volume. The developed Dense U-Net, see Figure 1, is based on the U-Net architecture with 6 stages in the encoding and the decoding part. We replaced the normal stack of convolutional layers with a DenseNet-like architecture which consists of two small Dense blocks separated by transitional layers. Each of the Dense blocks comprises 4 convolutional layers. Their input is the concatenated output from all respective previous layers within the block. Focal loss with AdamOptimizer was used to train the network. We tested the Dense U-Net against the classical U-Net, and evaluated the segmentation with manual segmentation as the reference standard according to the mean dice score (MDS) with 95% confidence interval (CI), median dice score (MeDS), standard deviation (Std), mean relative absolute volume difference (MRAVD), mean Haussdorf distance (MHD) as a contour consistency measure and mean surface distance (MSD).Results and Discussion
The Dense U-Net achieved an average and median dice score for the prostate of 89.4±0.8% and 90% which was higher in comparison to the classical U-Net with average and median dice scores of 88.4±0.8% and 89%, respectively. In addition, the Dense U-Net had an equal dice score of 83±0.2% in the central zone, yet a higher value of 76.9±0.2% in the peripheral zone when comparing it to 74.6±0.2% achieved by the U-Net. This improvement of the performance was due to the nature of the Dense U-Net which is based on feature maps concatenation where one convolutional stage has a direct access to all previous feature maps from all subsequent stages and this enables feature map reuse. Furthermore, concatenating feature maps from different stages enhances the input variations and makes the data flow through the model more efficient. As we can observe in Figure 2, both networks performed accurate segmentation of the prostate gland and its subsequent zones with details of the statistical measures shown in table 1. However, it is clear that the prostate’s middle region had a relatively higher average dice score of 94% for the Dense U-Net and 93% for classical U-Net in comparison to a relatively lower value for the apical and basal region of the prostate (Dense U-Net: 72% and 80%; Classical U-Net: 71% and 77%) respectively, see Figure 3. One can hypothesize that apical and basal regions are harder to segment accurately due greater ambiguity of the prostate border and the lower number of representative slices in comparison to the middle prostate region. MHD was computed to measure the distance between the predicated delineation and the ground truth. It is obvious, see Figure 4, that the classical U-Net offered a better contour consistency than the Dense U-Net in prostate, CZ and PZ. One can conclude, see Table 1, that the resulted dice score of the Dense U-Net is higher than the classical U-Net, yet the border’s delineation using the classical U-Net is much more reliable.Conclusion
The developed Dense U-Net architecture was more accurate than the state-of-the-art U-Net for prostate and prostate zone segmentation on axial T2-weighted MRI sequences.Acknowledgements
This work is funded by the German research foundation (GRK2260, BIOQIC)References
- Y. Wang, J.-Z. Cheng, D. Ni, M. Lin, J. Qin, L. Xiongbiao, M. Xu, X. Xie und P. A. Heng, „Towards Personalized Statistical Deformable Model and Hybrid Point Matching for Robust MR-TRUS Registration,“ IEEE Trans Med Imaging, Feb 2016.
- O. Zettinig, A. Shah, C. Hennersperger, M. Eiber, C. Kroll, H. Kübler, T. Maurer, F. Milletarì, J. Rackerseder, C. Schulte zu Berge, E. Storz, B. Frisch und N. Navab, „Multimodal image-guided prostate fusion biopsy based on automatic deformable registration,“ International Journal of Computer Assisted Radiology and Surgery, p. pp 1997–2007, December 2015.
- S. Sabouri, . L. Fazli, . S. D. Chang, . R. Savdie, E. C. Jones, S. L. Goldenberg, P. C. Black und . P. Kozlowski, „MR measurement of luminal water in prostate gland: Quantitative correlation between MRI and histology,“ Journal of Magnetic Resonance Imaging, January 2017.
- J. C.Weinreb, J. O.Barentsz, P. L.Choyke, F. Cornud, M. A.Haider, K. J.Macura, D. Margolis, M. D.Schnall, F. Shtern, C. M.Tempany, H. C.Thoeny und S. Verma, „PI-RADS Prostate Imaging – Reporting and Data System: 2015, Version 2,“ European Urology, January 2016.
- O. Ronneberger, P. Fischer und T. Brox, „U-Net: Convolutional Networks for Biomedical Image Segmentation,“ Medical Image Computing and Computer-Assisted Intervention, November 2015.
- G. Huang, . Z. Liu, . L. van der Maaten und . K. Q. Weinberger, „Densely Connected Convolutional Networks,“ Densely Connected Convolutional Networks, 2017.
Figures
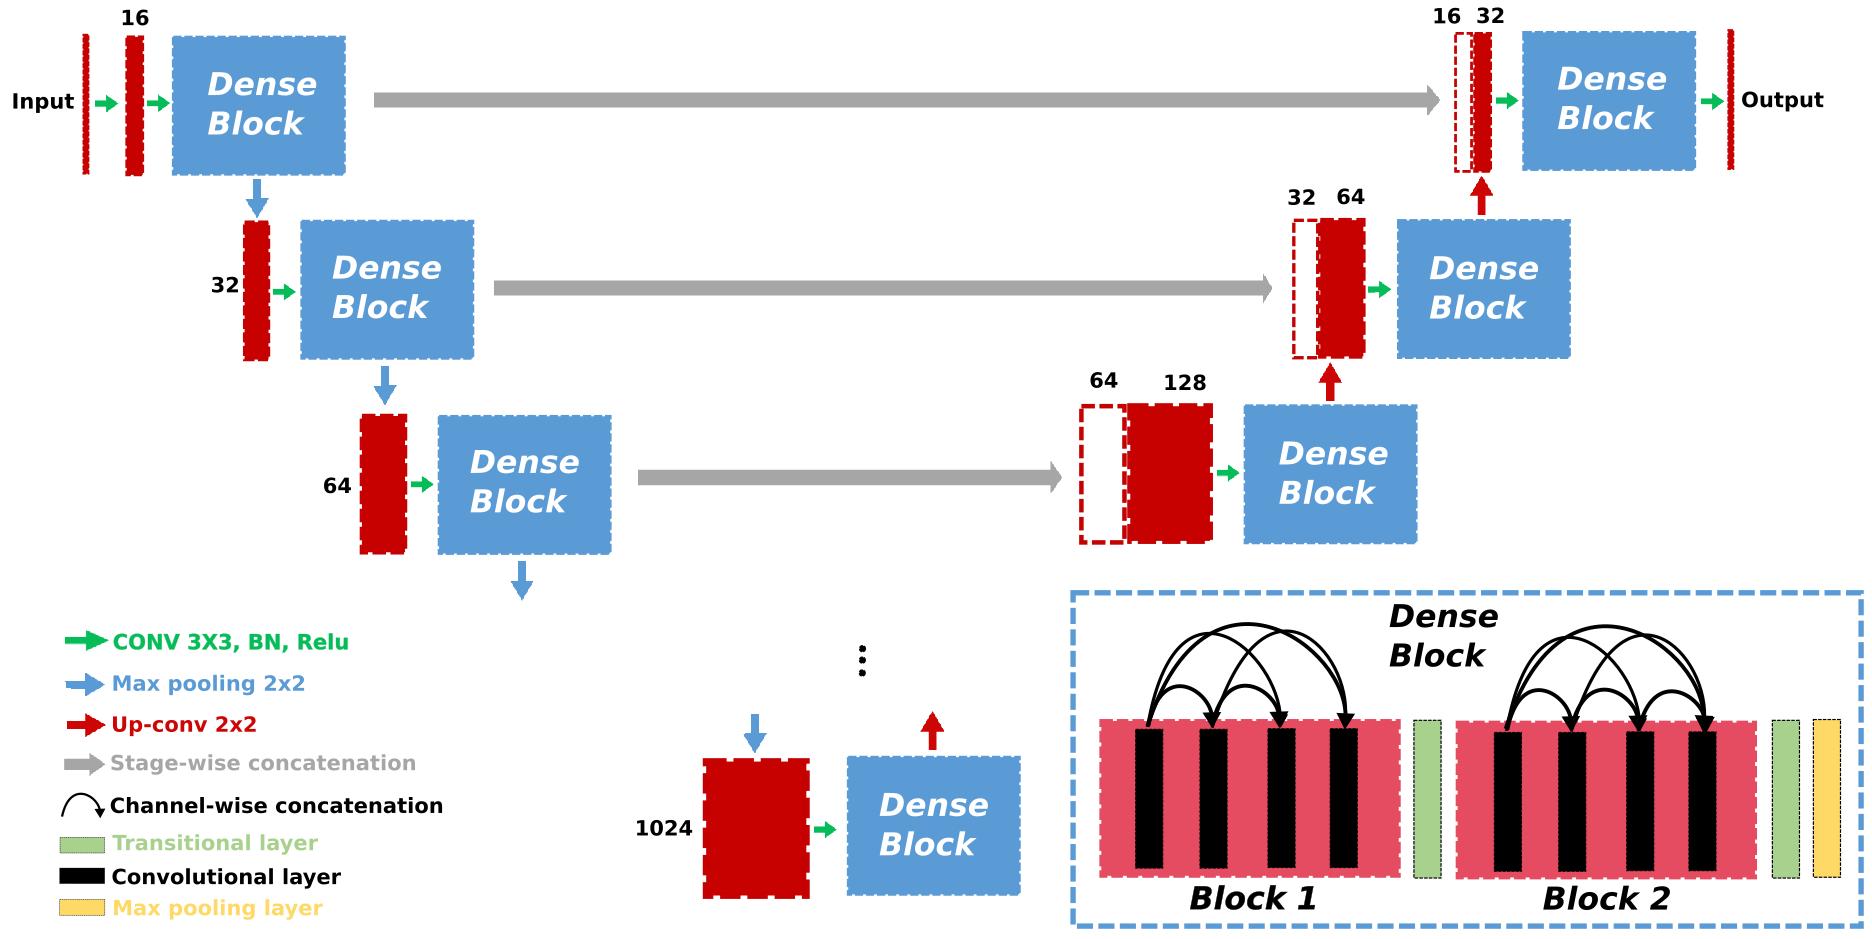
Figure
1: The detailed Dense U-Net architecture: the numbers refer to the
feature maps
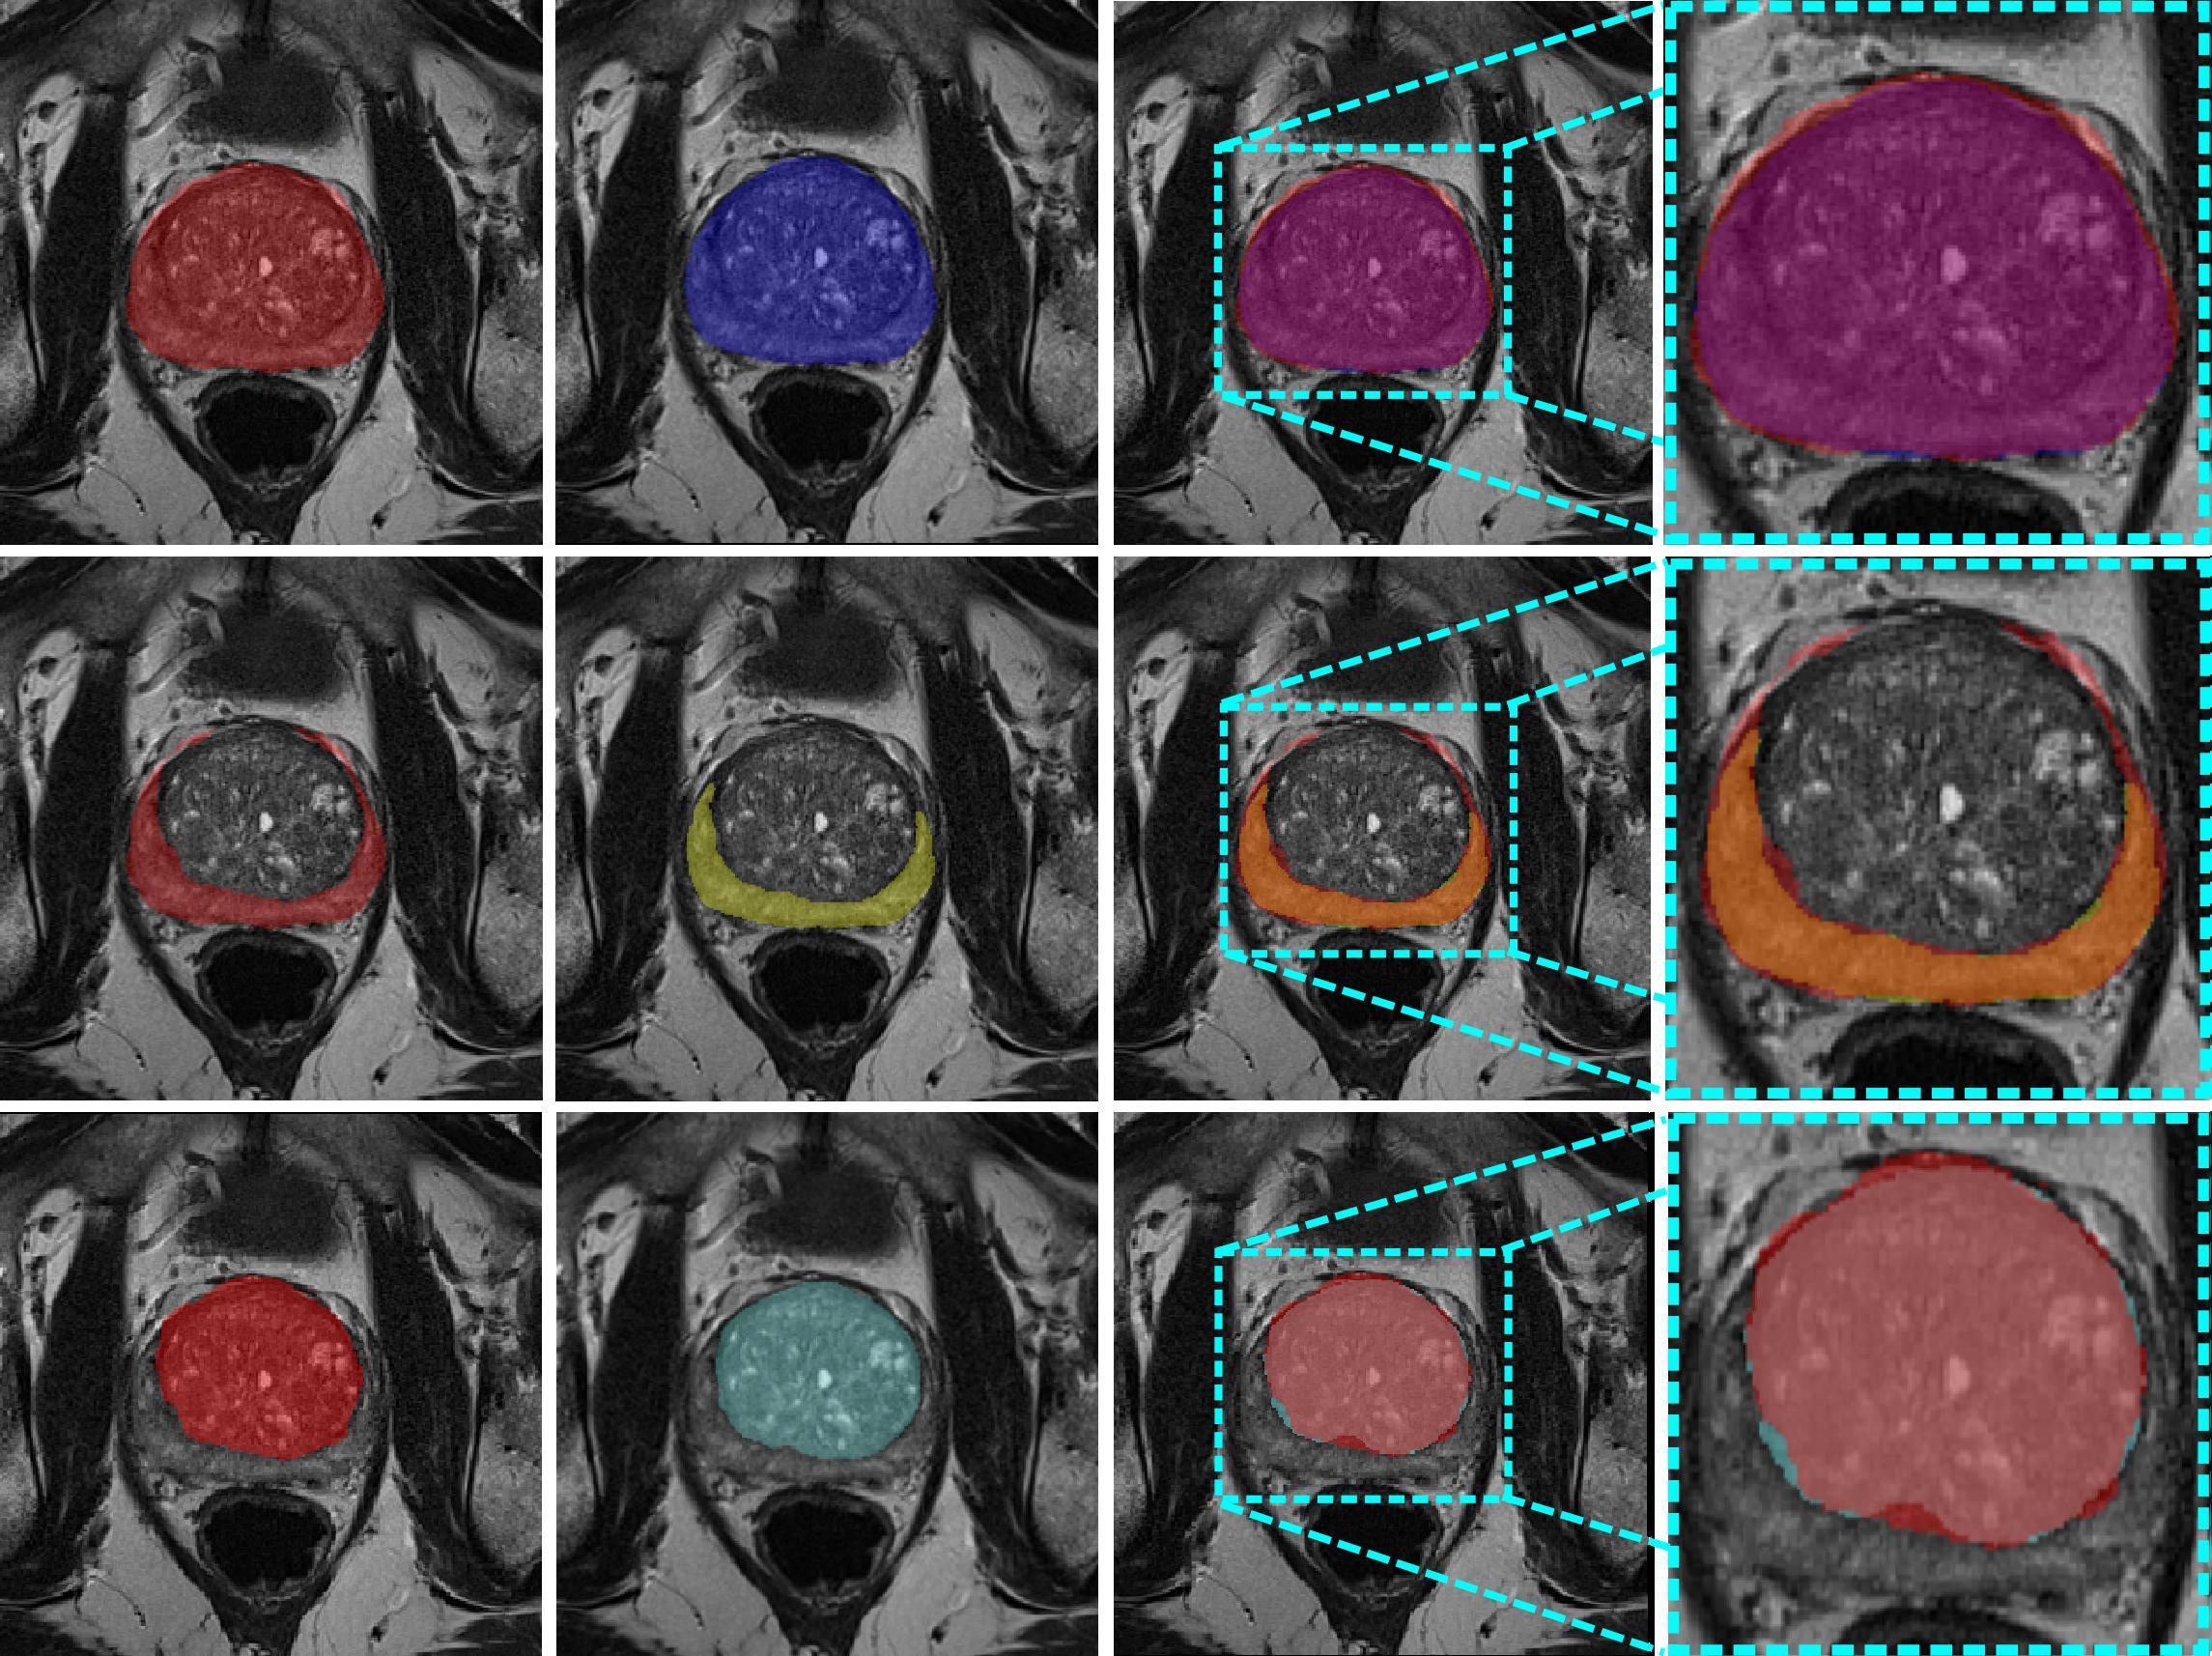
Figure 2: Segmentation of
prostate and its zones using the Dense U-Net: Columns from left to
right show images of the ground truth, predicted mask, the overlap
between the two masks and a magnification of the overlap; the rows
from top to bottom show images of prostate, PZ and CZ respectively
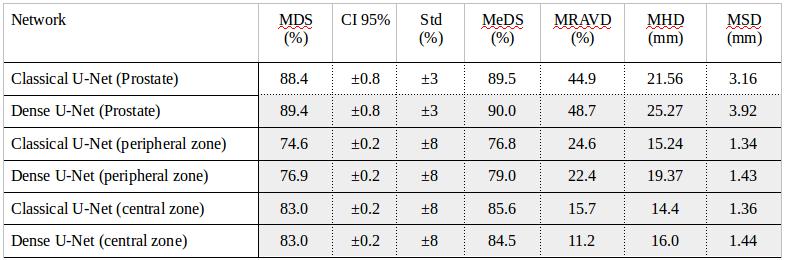
Table 1: The statistical measurements of the segmentation results
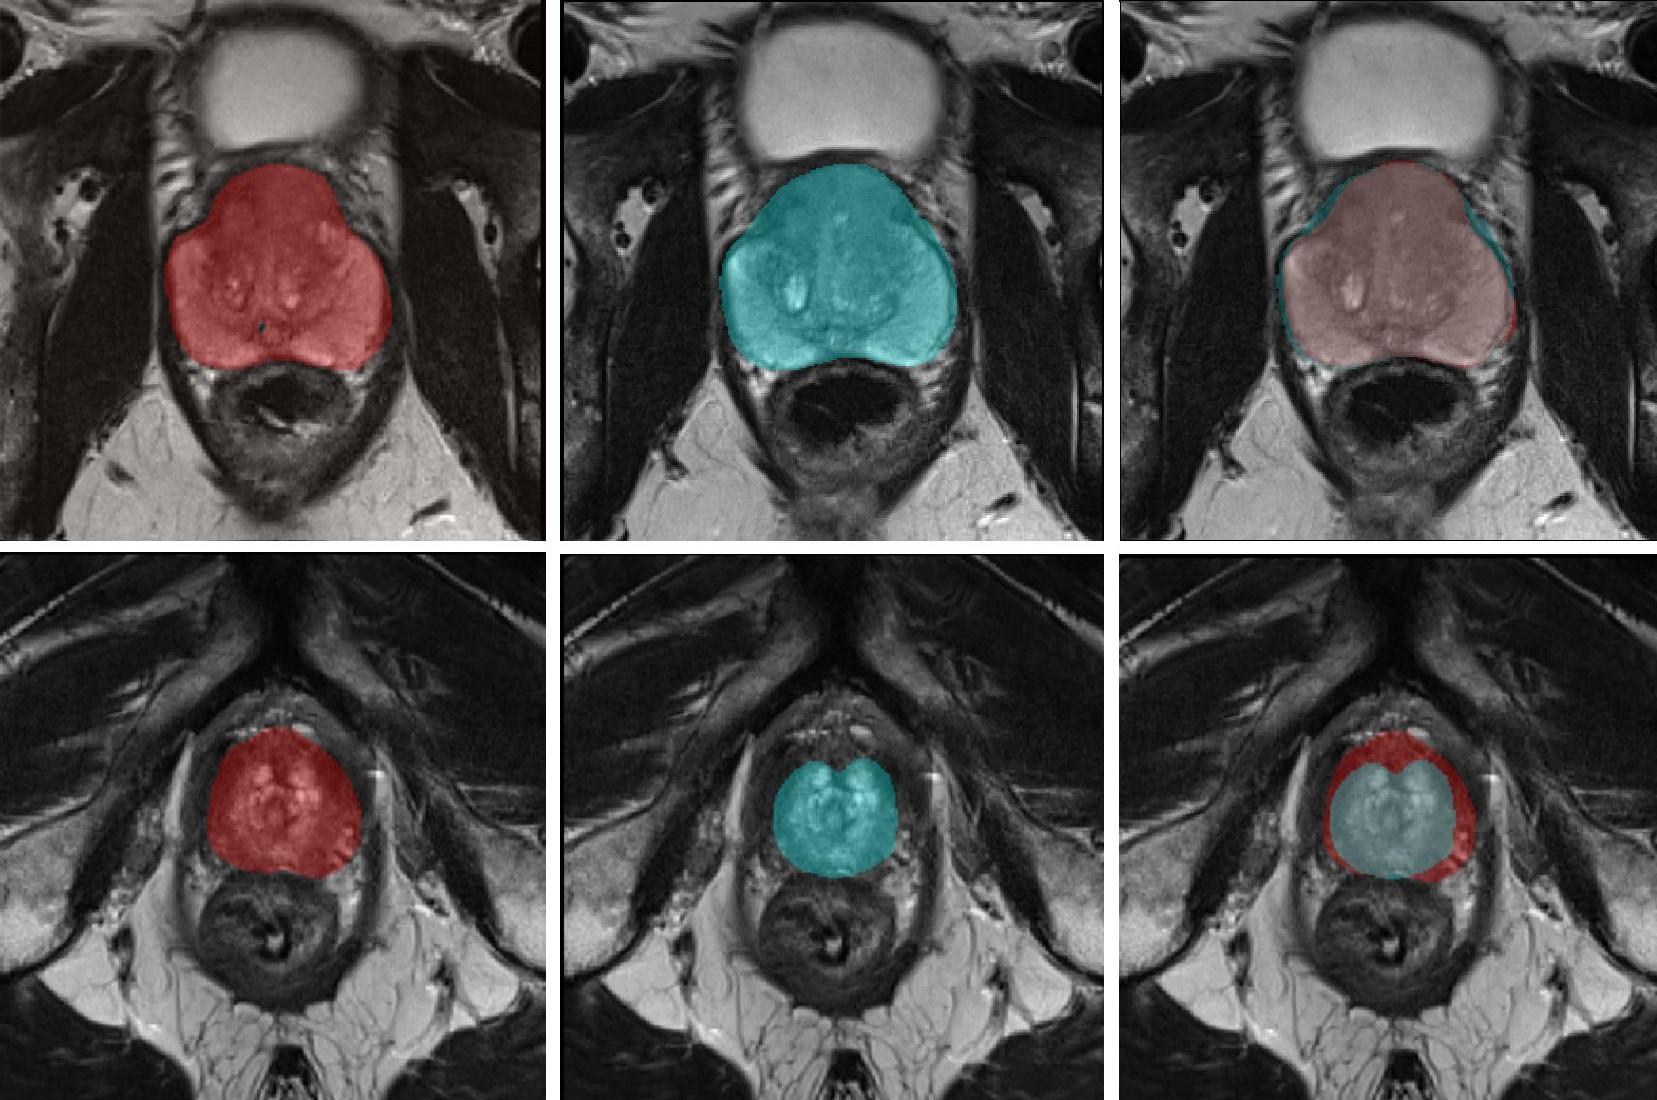
Figure 3: The segmentation results of the Dense U-Net. (left) ground truth, (middle) the predicted segmentation mask, (right) the overlap between the ground truth and the predicted segmentation mask. The top row shows images of the middle prostate region and the bottom row shows images of the apical prostate region.
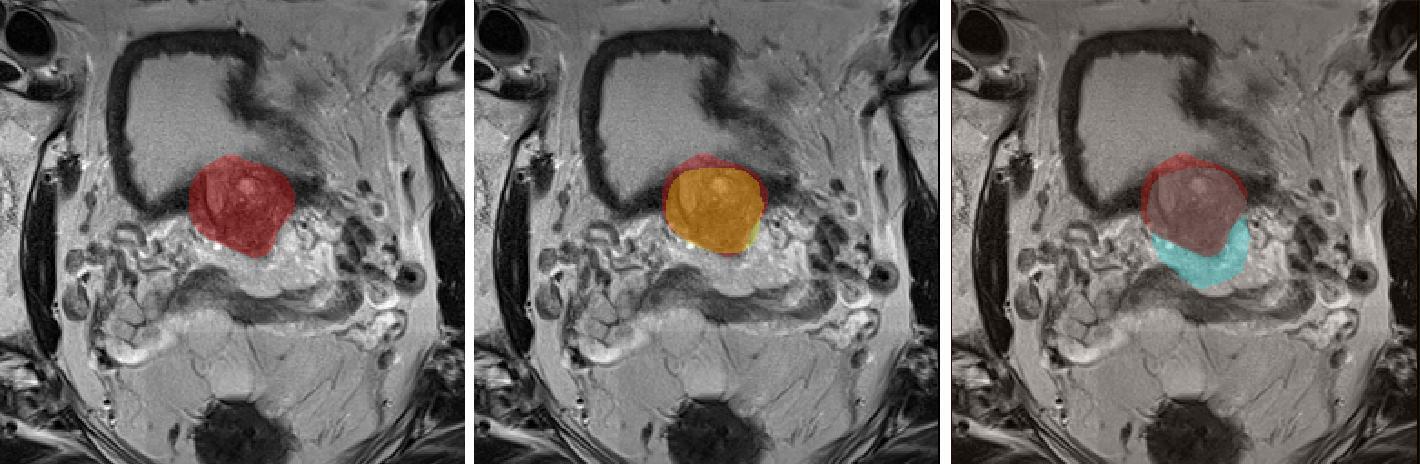
Figure 4: Contour consistency. (left) the ground truth, (middle) the overlap between the U-Net segmentation mask and the ground truth, and (right) the overlap between the Dense U-Net segmentation mask and the ground truth