1710
Characterization of sub 1 cm Breast Lesions using Radiomics Analysis1Radiology, Memorial Sloan Kettering Cancer Center, New York, NY, United States
Synopsis
DCE MRI of breast lesions has high sensitivity (>90%) and reasonable specificity (>70%). However, the specificity for smaller lesions is known to be poorer due to the inability to confidently distinguish morphological and kinetic features. This work utilizes radiomics of model free parameter maps to improve the diagnostic accuracy of sub 1cm lesions with a PPV of 100% and a NPV of 91% obtained in a test dataset. The high level of correlation between texture features calculated from initial enhancement, overall enhancement, and area under the enhancement curve maps indicate that data acquisition beyond peak enhancement may be unnecessary.
Introduction
Despite the high sensitivity (>90%) of DCE MRI its specificity for smaller lesions is poor due to the inability to confidently distinguish morphological and kinetic features, including irregular lesion borders and heterogeneous internal enhancement1. With the widespread adoption of MR screening for selected high-risk populations it has been noted that the majority of invasive carcinomas detected via this route are less than 1 cm in size2. Lesions regarded as suspicious (BIRADS 4 or 5) are recommended for biopsy3, and since a higher percentage of smaller lesions are known to be benign4 this leads to a large number of negative biopsies and thus a low positive predictive value.
This study was undertaken to examine the utility of radiomic features extracted from model free parameters maps, based on high resolution post contrast scans, in the differentiation of benign and malignant lesions less than 0.52 cm3 in volume (~1 cm diameter sphere).
Methods
MR imaging was performed using a 3.0T scanner (GE Discovery 750) with a dedicated breast coil. A high spatial resolution T1 weighted scan was acquired pre-contrast injection (TR/TE/FA=7.9/4.3/12°; reconstructed matrix, 512×512; 1.1 mm isotropic resolution). Differential sub-sampling with cartesian ordering (DISCO) was employed for the first 60 secs post contrast injection (0.1 mmol gadobutrol/kg body weight). Subsequently, conventional steady-state DCE images (1.1 mm isotropic) were acquired with a temporal resolution of ~120 secs for 3 phases.
Parameter maps quantifying the initial enhancement (IE), overall enhancement (OE), washout (WO), and area under the enhancement curve (AUEC) were calculated pixel-by-pixel according to
$$IE = 100\times\frac{S_{1}-S_{0}}{S_{0}}$$
$$OE = 100\times\frac{S_{3}-S_{0}}{S_{0}}$$
$$WO = 100\times\frac{S_{3}-S_{1}}{S_{1}}$$
$$AUEC = \int_{i=1}^{3}\frac{S_{i}-S_{0}}{S_{0}}$$
Segmentation was performed on the first post-contrast phase images, on all lesion containing slices, and the region of interest subsequently transferred to the remaining DCE phases. ROI data was reduced to 16 gray levels, ensuring reasonable counting statistics for texture feature calculations. Heterogeneity measures based on first order statistics were determined, alongside texture features based on gray level co-occurrence matrices (GLCM)5, run length matrices (RLM)6, size zone matrices SZM)7 and neighborhood gray tone difference matrices (NGTDM)8.
The data was split into a training dataset (~75%) and a test dataset (~25%). All model development was performed on the training dataset. Univariate analysis was initially employed to explore significant differences between benign and malignant lesions, and correlation analysis to help guide feature selection. Classification analysis was performed utilizing support vector machines (SVMs), a non-linear classification technique that exploits mapping inputs into higher-dimensional spaces.
Finally, the efficacy of the developed models was assessed using the previously unseen test dataset and sensitivity, specificity, positive predictive value and negative predicted values determined.
Results
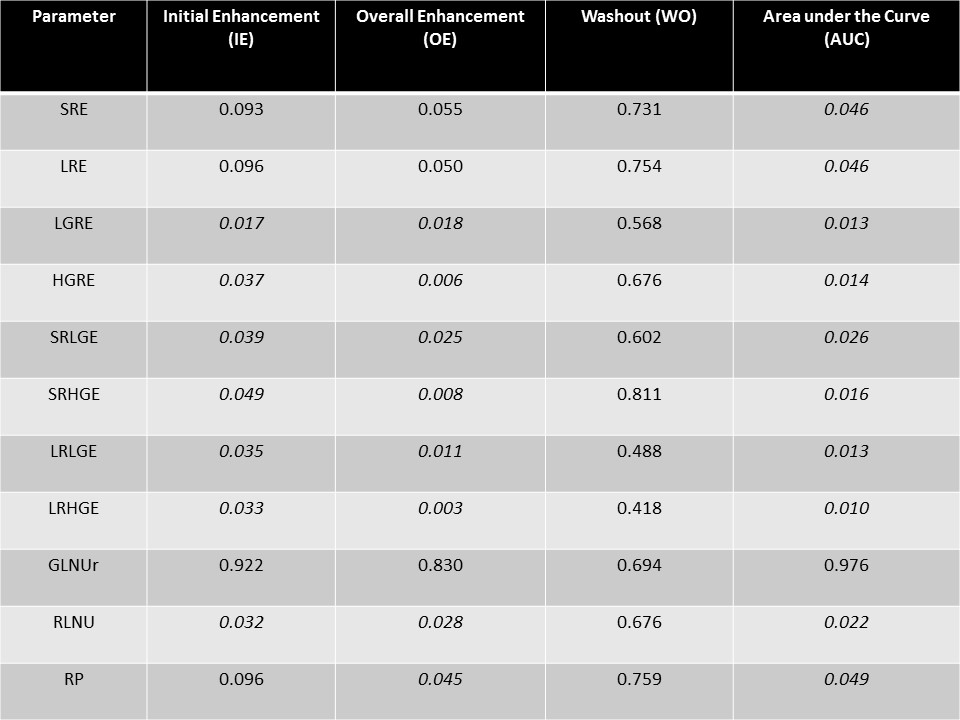
Univariate analysis on the training dataset revealed a large number of significant differences for the first order and textural parameters calculated from IE, OE and AUEC maps. For the first order statistics 12/15 parameters were significantly different between benign and malignant lesions (p<0.050), 14/48 parameters were significant for GLCM-based features (p<0.047), 25/33 parameters (see figure 1) were significant for RLM-based features (p<0.050) and 7/33 parameters were significant for SZM-based parameters (p<0.043). No significant differences were noted utilizing the washout maps. Patient age was also determined to be significantly different (p=0.0003).
Further analysis showed very strong correlations for all texture features compared across IE, OE and AUEC maps (0.544<r<0.992, p<0.005 in all cases). Therefore it was deemed appropriate to develop predictive models based on texture features of IE, OE and AUEC maps independently of one another.
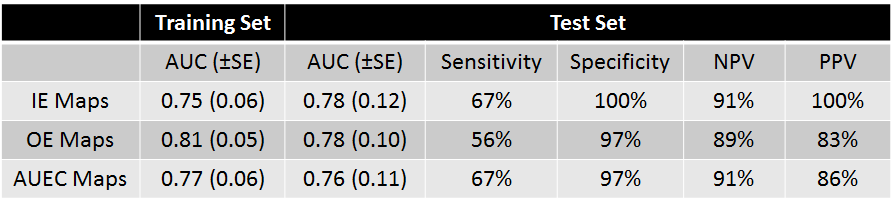
Whilst a large number of parameters were determined to be significantly different between groups, the final predictive models only utilized the 4 most significant texture parameters for each set of parameter maps, alongside patient age, to obviate potential overfitting. Results for the 3 independent models are shown in figure 2.
Discussion
Noted study limitations include the relatively small sample size, its single center nature and the absence of motion correction between the dynamic phases.
From figure 2 it can be seen that there is little, if any, additional benefit in utilizing texture features calculated from the OE and AUC maps compared to the IE maps, indicating that, in this cohort of patients, acquiring data beyond peak enhancement is unnecessary. This intimation is further reinforced when it is considered that no significant differences in texture features calculated from washout maps were seen.
Despite the relatively small size of the test dataset (32 benign, 9 malignant), its independent nature from the training data, and the high NPVs and PPVs obtained, indicate that unnecessary biopsies may be potentially avoided, and that radiomics analysis of small lesions is both feasible and efficacious.
Acknowledgements
No acknowledgement found.References
1. Schlossbauer T, Leinsinger G, Wismuller A, et al. Invest Radiol 2007; 43:56-64.
2. Kuhl C, Weigel S, Schrading S, et al. J Clin Oncol 2010; 28:1450–7.
3. Morris EA, Comstock CE, Lee CH. ACR BI-RADS® Magnetic Resonance Imaging. ACR BI-RADS® Atlas, Breast Imaging Reporting and Data System. Reston, VA: American College of Radiology; 2013.
4. Liberman L, Mason G, Morris EA, Dershaw DD. AJR Am J Roentgenol 2006; 186:426-430.
5. Haralick RM, Shanmugam K, Dinstein I. IEEE Trans Syst Man Cybern 1973; SMC3:610-621.
6. Conners RW, Trivedi MM, Harlow CA. Comput Vis Graph Image Process 1984; 25:273-310.
7. Galloway MM. Comput Vision Graph 1975; 4:172-179 (1975).
8. Thibault G, Fertil B, Navarro C, et al. Intern J Pattern Recognit Artif Intell 2013; 27:1357002.
9. Amadasun M, King R. IEEE Trans Syst Man Cybern 1989; 19:1264-1274.
Figures