1708
A Two-Center Analysis of Hyperpolarized 129Xe Lung MRI in Stable Pediatric Cystic Fibrosis: Comparison of Image Analysis Approaches1Translational Medicine Program, The Hospital for Sick Children, Toronto, ON, Canada, 2Department of Medical Biophysics, University of Toronto, Toronto, ON, Canada, 3School of Medicine, University of Missouri, Columbia, MO, United States, 4Division of Respiratory Medicine, The Hospital for Sick Children, Toronto, ON, Canada, 5Center for Pulmonary Imaging Research, Cincinnati Children's Hospital Medical Center, Cincinnati, OH, United States
Synopsis
The ventilation defect percent (VDP), measured from hyperpolarized 129Xe MRI, is sensitive to functional changes in early cystic fibrosis (CF) lung disease; however, there is no consensus on which VDP calculation method is most appropriate for future multi-center clinical trials in CF. This study compared VDP analysis methods in hyperpolarized 129Xe datasets acquired in stable pediatric CF subjects at two institutions. In a combined dataset, a comparison of k-means, mean-anchored linear binning, and 99th percentile-anchored linear binning demonstrated that all three methods provide a good characterization of the disease, but mean-anchored linear binning provided the strongest correlation to pulmonary function tests.
Introduction
The spatial distribution of ventilation defects in hyperpolarized (HP) 129Xe MRI provides insight into cystic fibrosis (CF) lung disease1 and treatment.2 The ventilation defect percent (VDP) measured from HP 129Xe images provides a sensitive measure of ventilation heterogeneity in early cystic fibrosis (CF) lung disease.3,4 VDP is potentially more sensitive for detecting early functional changes in CF lung disease compared to pulmonary function test (PFT) indices, such as the forced expiratory volume in one second (FEV1) and the lung clearance index (LCI).3,5 VDP can be calculated by segmenting the HP 129Xe image using k-means3,6 or linear binning4,7,8 to quantify the fraction of the lung that corresponds to ventilation defect. A recent single-center comparative study has found a good agreement between adaptive k-means and linear binning VDP measurements in adults with asthma9; however, it is unknown which method will be the most appropriate for future multi-center prospective clinical trials in CF. The purpose of this study was to perform a retrospective analysis of HP 129Xe images from stable pediatric CF subjects obtained at two different institutions using slightly different MRI protocols to assess the agreement between VDP calculation methods as well as the correlation between VDP and PFT measurements (i.e., FEV1 and LCI).Methods
This retrospective analysis included 26 participants from two institutions (18 CF, 8 healthy, age range 10–17). Pulmonary function tests, N2 multiple breath washout, and HP 129Xe MRI were performed using previously described methods.3,4 Table 1 shows the subject demographics for the two sites, and Table 2 shows the MR acquisition parameters. VDP was calculated using (i) k-means clustering according to Santyr et al.1, (ii) mean-anchored linear binning according to Thomen et al.4, and (iii) 99th percentile-anchored linear binning according to He et al.7 For each analysis method, VDP was calculated as the total volume of unventilated lung obtained from the respective segmented 129Xe images divided by the total lung volume obtained from the 1H image masks. VDP was compared between methods using a Bland-Altman analysis. VDP was compared with FEV1 and LCI using a linear regression analysis, where HP 129Xe images with a center slice SNR below 8.5 were excluded.Results
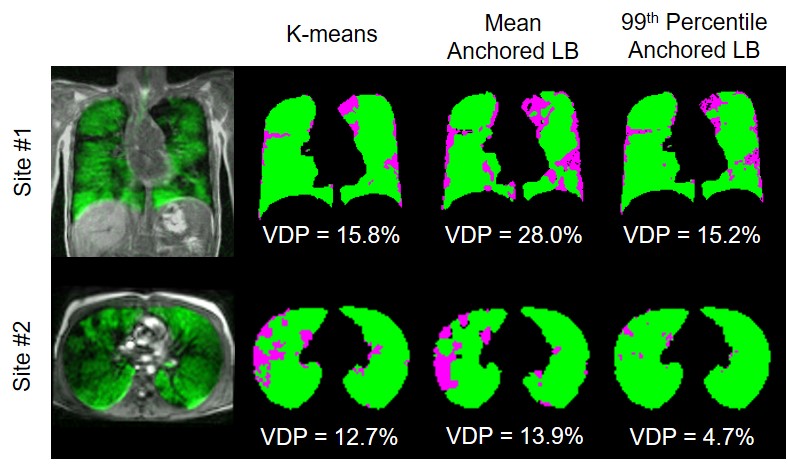
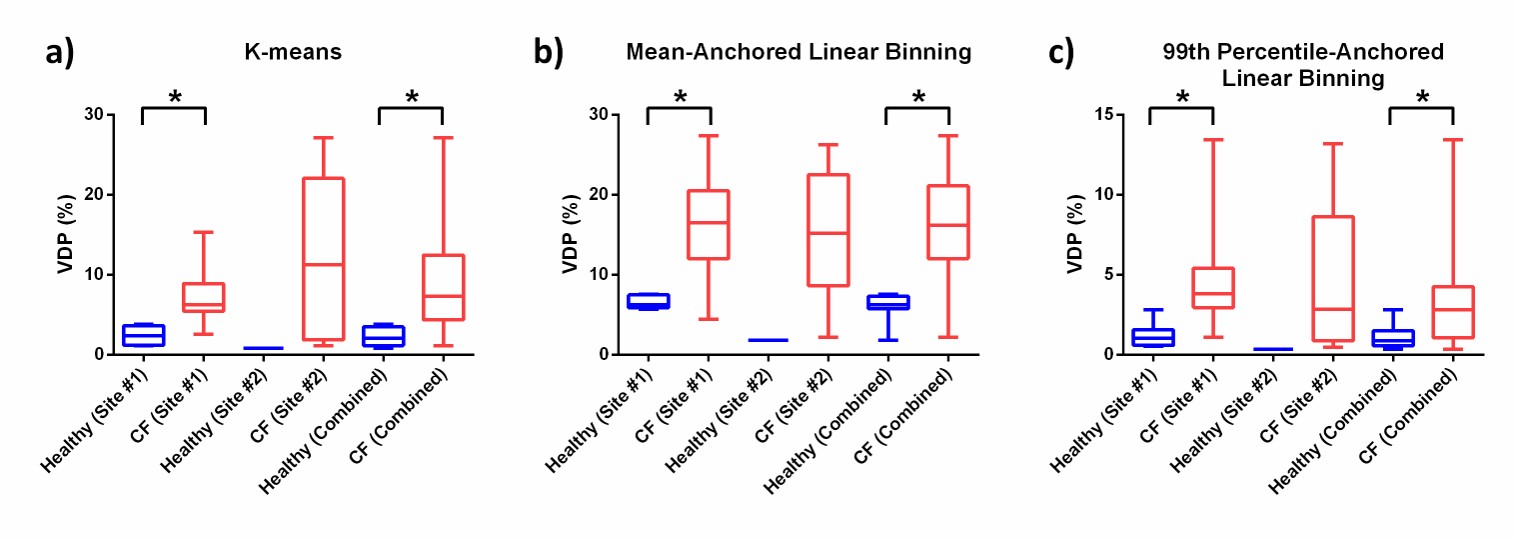
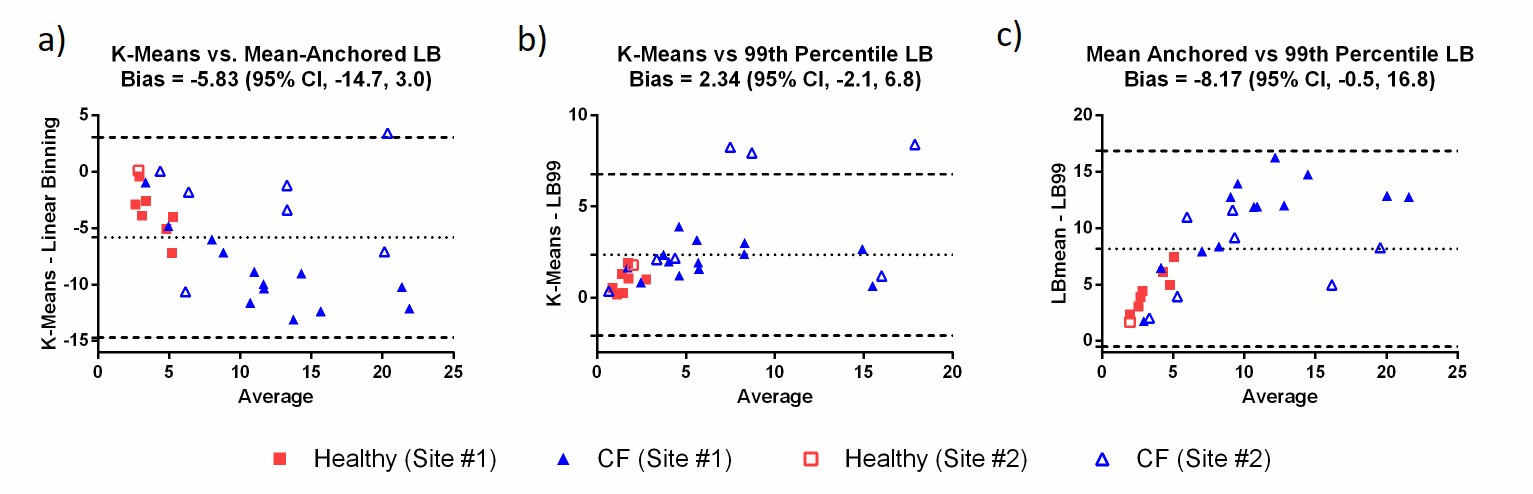
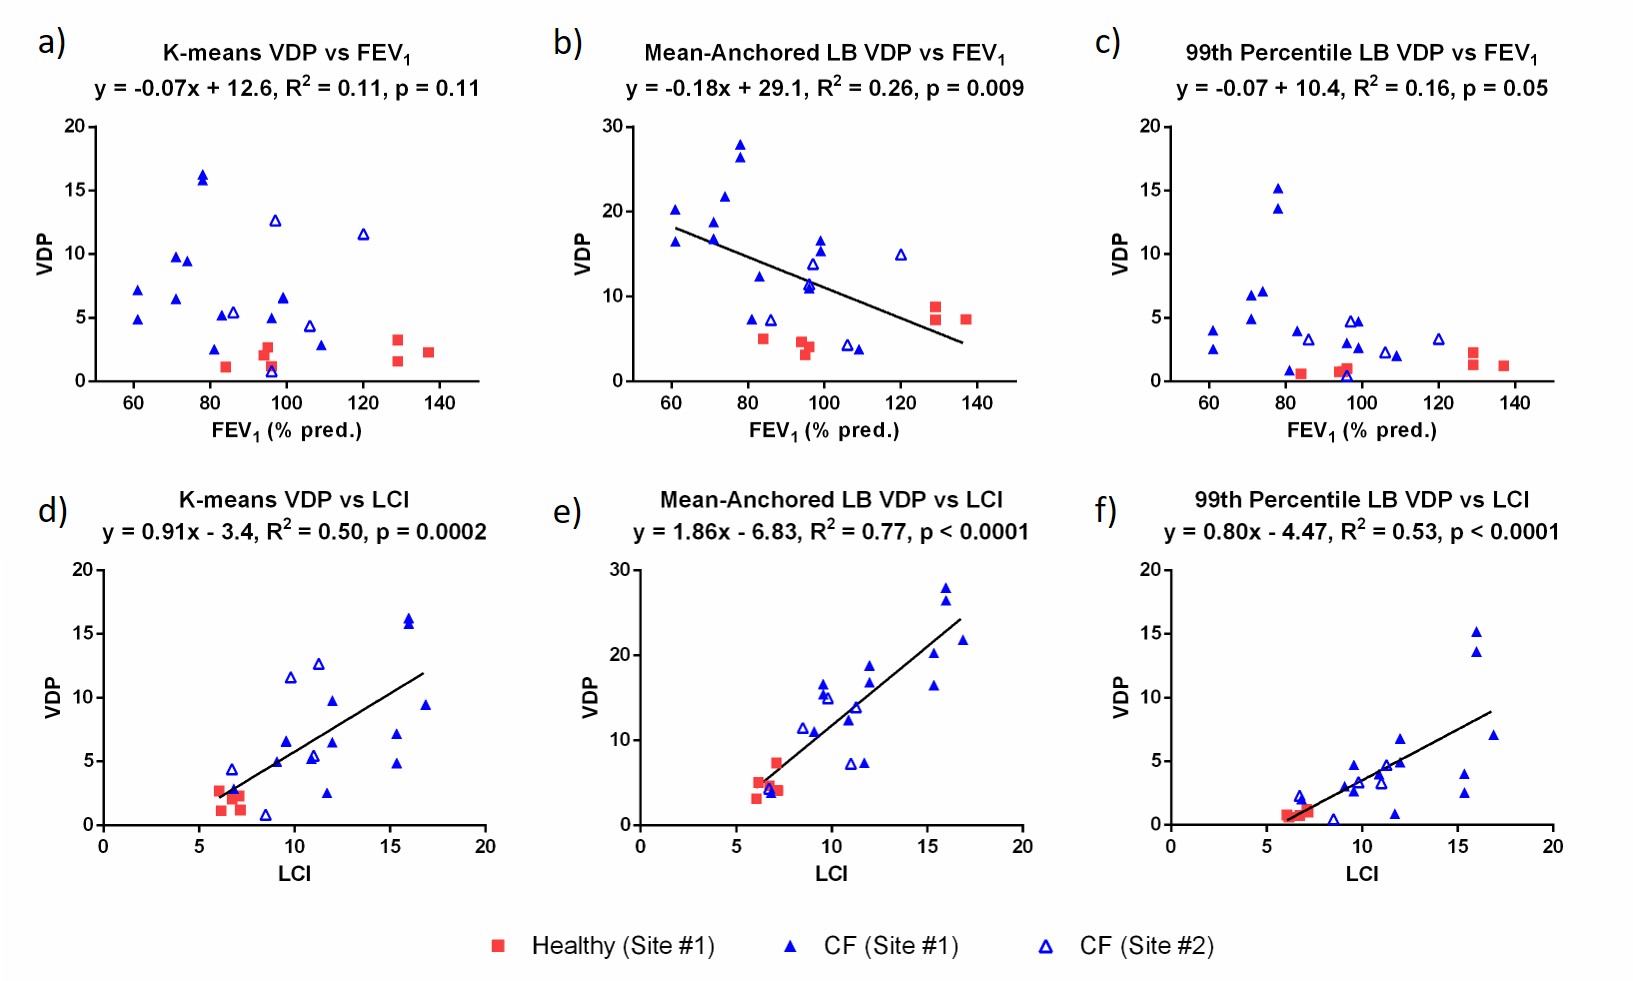
Figure 1 shows a comparison of segmented ventilation and defect maps obtained using all three VDP calculation methods in two representative CF patients at Site #1 and Site #2, respectively. Figure 2 summarizes the VDP results in box-and-whisker plots for each calculation method, where VDP results are shown separately for each site and also as a combined dataset. Figure 3 shows Bland-Altman analyses comparing VDP calculation methods for the combined data set from both sites. Generally, mean-anchored linear binning provided the highest average VDP, with 99th percentile-anchored linear binning providing the lowest average VDP. Figures 4(a) to 4(c) show VDP calculated for each method and plotted against FEV1, where only mean-anchored linear binning provides a weak but significant correlation. Figures 4(d) to 4(f) show VDP calculated for each method and plotted against LCI, and in all cases there was a moderate to strong correlation.Discussion
This retrospective study is the first to compare VDP measurements obtained from HP 129Xe MRI performed in stable pediatric CF subjects at two institutions. Both CF populations were of a similar age with a range of severities, as defined by LCI and VDP, providing a good clinical characterization of the disease. For all three analysis methods, the VDP values calculated for each subject were similar; however, mean-anchored linear binning resulted in a systematically higher VDP value compared to k-means and 99th percentile-anchored linear binning. Mean-anchored linear binning uses fixed segmentation thresholds that include poorly ventilated lung regions (i.e. up to 60% of the mean signal value), in addition to defect, which appears to provide robust VDP values despite minor acquisition differences between the two sites. On the other hand, k-means uses variable thresholds that consider defect only, and 99th percentile-anchored linear binning used a low threshold (5.6%) that was determined from healthy reference data. Mean-anchored linear binning was the only method that resulted in a significant correlation to FEV1, and of all three methods it had the strongest correlation with LCI.Conclusions
VDP determined using mean-anchored linear binning provides a robust measurement of ventilation heterogeneity in stable pediatric CF subjects at two sites. Since measurements performed at two sites using this analysis method yielded similar VDP values, implementation of the technique in future multi-center trials in CF appears feasible.Acknowledgements
The authors gratefully acknowledge helpful discussions with members of the 129Xe MRI Clinical Trials Consortium. The authors would like to thank the following individuals at SickKids for their help with data collection: Yonni Friedlander, Raymond Hu, Nikhil Kanhere, Michelle Klingel, Krzysztof Kowalik, Andras Lindenmaier, Tammy Rayner, Laura Seed, Elaine Stirrat, Ruth Weiss, David Wilson, and Brandon Zanette; in addition to the following at Cincinnati Children’s: Laura Walkup, Zackary Cleveland, Erin Watters, and Kelly Thornton. We would also like to thank the following sources of funding: The Hospital for Sick Children (Catalyst Grant from the Cystic Fibrosis Centre), Natural Sciences and Engineering Research Council of Canada (NSERC) Discovery grant (RGPIN 217015-2013), Canadian Institutes of Health Research (CIHR) operating and project grants (MOP 123431, PJT 153099), the Cincinnati Children’s Research Foundation, and the National Institutes of Health (T32 HL007752, R01 HL131012). MJC was funded by a Research Training Competition (Restracomp) Fellowship from the Hospital for Sick Children and a Mitacs Elevate Postdoctoral Fellowship.References
- Santyr G, Kanhere K, Morgado F, Rayment JH, Ratjen F, Couch MJ. Hyperpolarized Gas Magnetic Resonance Imaging of Pediatric Cystic Fibrosis Lung Disease. Acad Radiol 2018;DOI: 10.1016/j.acra.2018.04.024.
- Altes TA, Johnson M, Fidler M, Botfield M, Tustison NJ, Leiva-Salinas C, de Lange EE, Froh D, Mugler JP, 3rd. Use of hyperpolarized helium-3 MRI to assess response to ivacaftor treatment in patients with cystic fibrosis. J Cyst Fibros 2017;16(2):267-274.
- Kanhere N, Couch MJ, Kowalik K, Zanette B, Rayment JH, Manson D, Subbarao P, Ratjen F, Santyr G. Correlation of Lung Clearance Index with Hyperpolarized 129Xe Magnetic Resonance Imaging in Pediatric Subjects with Cystic Fibrosis. Am J Respir Crit Care Med 2017;196(8):1073-1075.
- Thomen RP, Walkup LL, Roach DJ, Cleveland ZI, Clancy JP, Woods JC. Hyperpolarized 129Xe for investigation of mild cystic fibrosis lung disease in pediatric patients. J Cyst Fibros 2017;16(2):275-282.
- Smith L, Marshall H, Aldag I, Horn F, Collier G, Hughes D, West N, Horsley A, Taylor CJ, Wild J. Longitudinal Assessment of Children with Mild Cystic Fibrosis Using Hyperpolarized Gas Lung Magnetic Resonance Imaging and Lung Clearance Index. Am J Respir Crit Care Med 2018;197(3):397-400.
- Kirby M, Heydarian M, Svenningsen S, Wheatley A, McCormack DG, Etemad-Rezai R, Parraga G. Hyperpolarized 3He magnetic resonance functional imaging semiautomated segmentation. Acad Radiol 2012;19(2):141-152.
- He M, Driehuys B, Que LG, Huang YT. Using Hyperpolarized 129Xe MRI to Quantify the Pulmonary Ventilation Distribution. Acad Radiol 2016;23(12):1521-1531.
- He M, Kaushik SS, Robertson SH, Freeman MS, Virgincar RS, McAdams HP, Driehuys B. Extending semiautomatic ventilation defect analysis for hyperpolarized (129)Xe ventilation MRI. Acad Radiol 2014;21(12):1530-1541.
- He M, Zha W, Tan F, Rankine L, Fain S, Driehuys B. A Comparison of Two Hyperpolarized (129)Xe MRI Ventilation Quantification Pipelines: The Effect of Signal to Noise Ratio. Acad Radiol 2018;DOI: 10.1016/j.acra.2018.08.015.
Figures
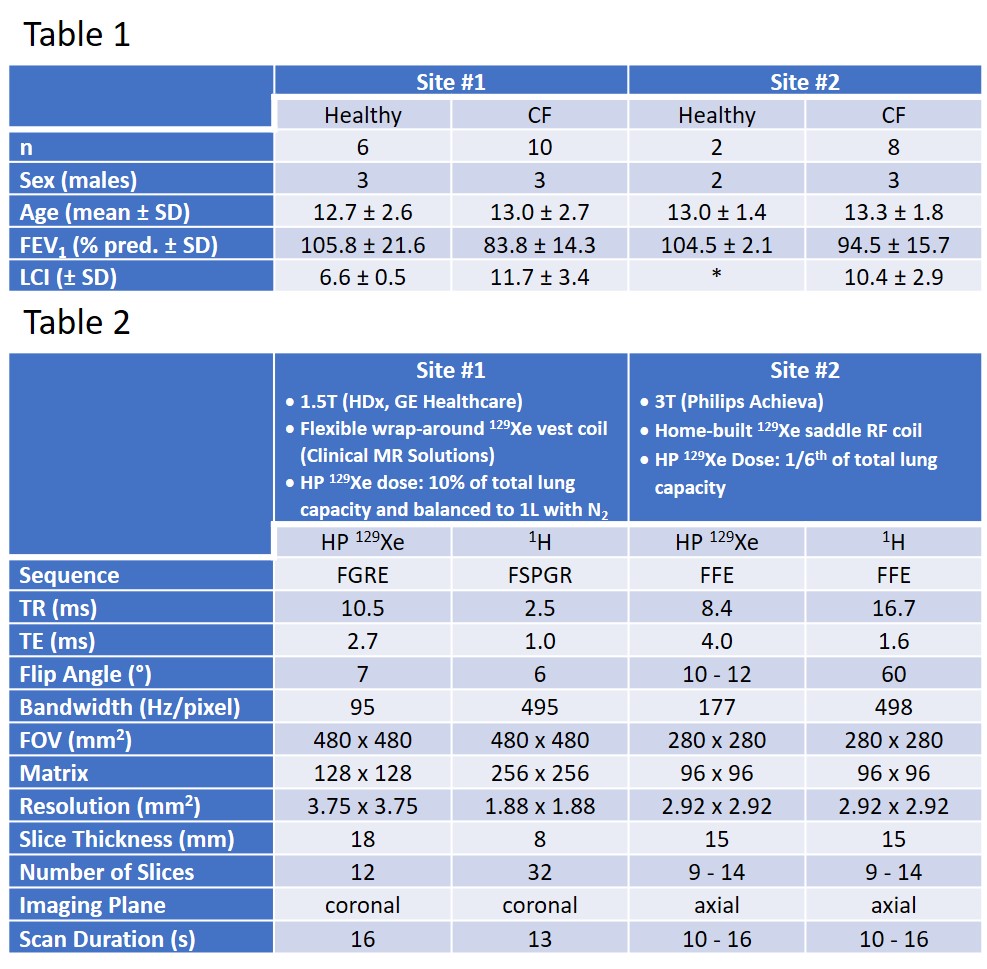
Table 1: Summary of subject demographics for all participants included in the retrospective study. The asterisk indicates that LCI was not available for the healthy participants from Site #2.
Table 2: Summary of HP 129Xe and conventional 1H MRI acquisition parameters for the two sites.