1707
Discrimination of Malignant and Benign Breast Lesions Using Machine Learning on Non-Gaussian Diffusion MRI Parameters1Center for Magnetic Resonance Research, University of Illinois at Chicago, Chicago, IL, United States, 2Department of Bioengineering, University of Illinois at Chicago, Chicago, IL, United States, 3The First Clinical Medical College, Zhejiang Chinese Medical University, Hangzhou, China, 4Department of Radiology, The 1st Affiliated Hospital of Zhejiang Chinese Medical University, Hangzhou, China, 5Departments of Radiology and Neurosurgery, University of Illinois at Chicago, Chicago, IL, United States
Synopsis
Breast cancer is the second leading cause of cancer death among women in the US. Recognizing the complexity of cancerous tissue, several non-Gaussian diffusion MRI models, such as the continuous-time random-walk (CTRW) model, were suggested to probe the underlying tissue environment. In this study, we employed a support-vector-machine-based analysis on the histogram features of CTRW model parameters to differentiate malignant and benign breast lesions. This multi-parameter multi-feature approach provided the best diagnostic performance compared to the conventional single-parameter or single-feature analysis techniques. The combination of machine-learning with non-Gaussian diffusion MRI can facilitate comparable diagnostic performance to that of dynamic-contrast-enhanced MRI.
Introduction:
Diffusion-weighted MRI (DWI) has been used to complement conventional MRI and dynamic contrast enhanced MRI (DCE-MRI) in breast cancer diagnosis1. While several studies demonstrated the potential of DWI with apparent diffusion coefficient (ADC) in differentiating breast lesions2,3, the clinical potential of DWI has not been fully realized. This is partly because many of these studies rely on parameters averaged over regions of interest (ROIs), compromising the sensitivity in heterogeneous breast tissues. Moreover, ADC derived from a mono-exponential model (i.e., Gaussian diffusion) does not adequately reflect the complexity of water diffusion process in biological systems4. In response to these limitations, multi-parametric non-Gaussian diffusion models and advanced statistical analysis techniques have emerged for cancer imaging5-10. The purpose of this study is therefore to apply a non-Gaussian DWI model – continuous-time random-walk (CTRW) model11 – to differentiate malignant and benign breast lesions by performing a machine learning-based analysis on the histogram features of the CTRW parameters.Methods:
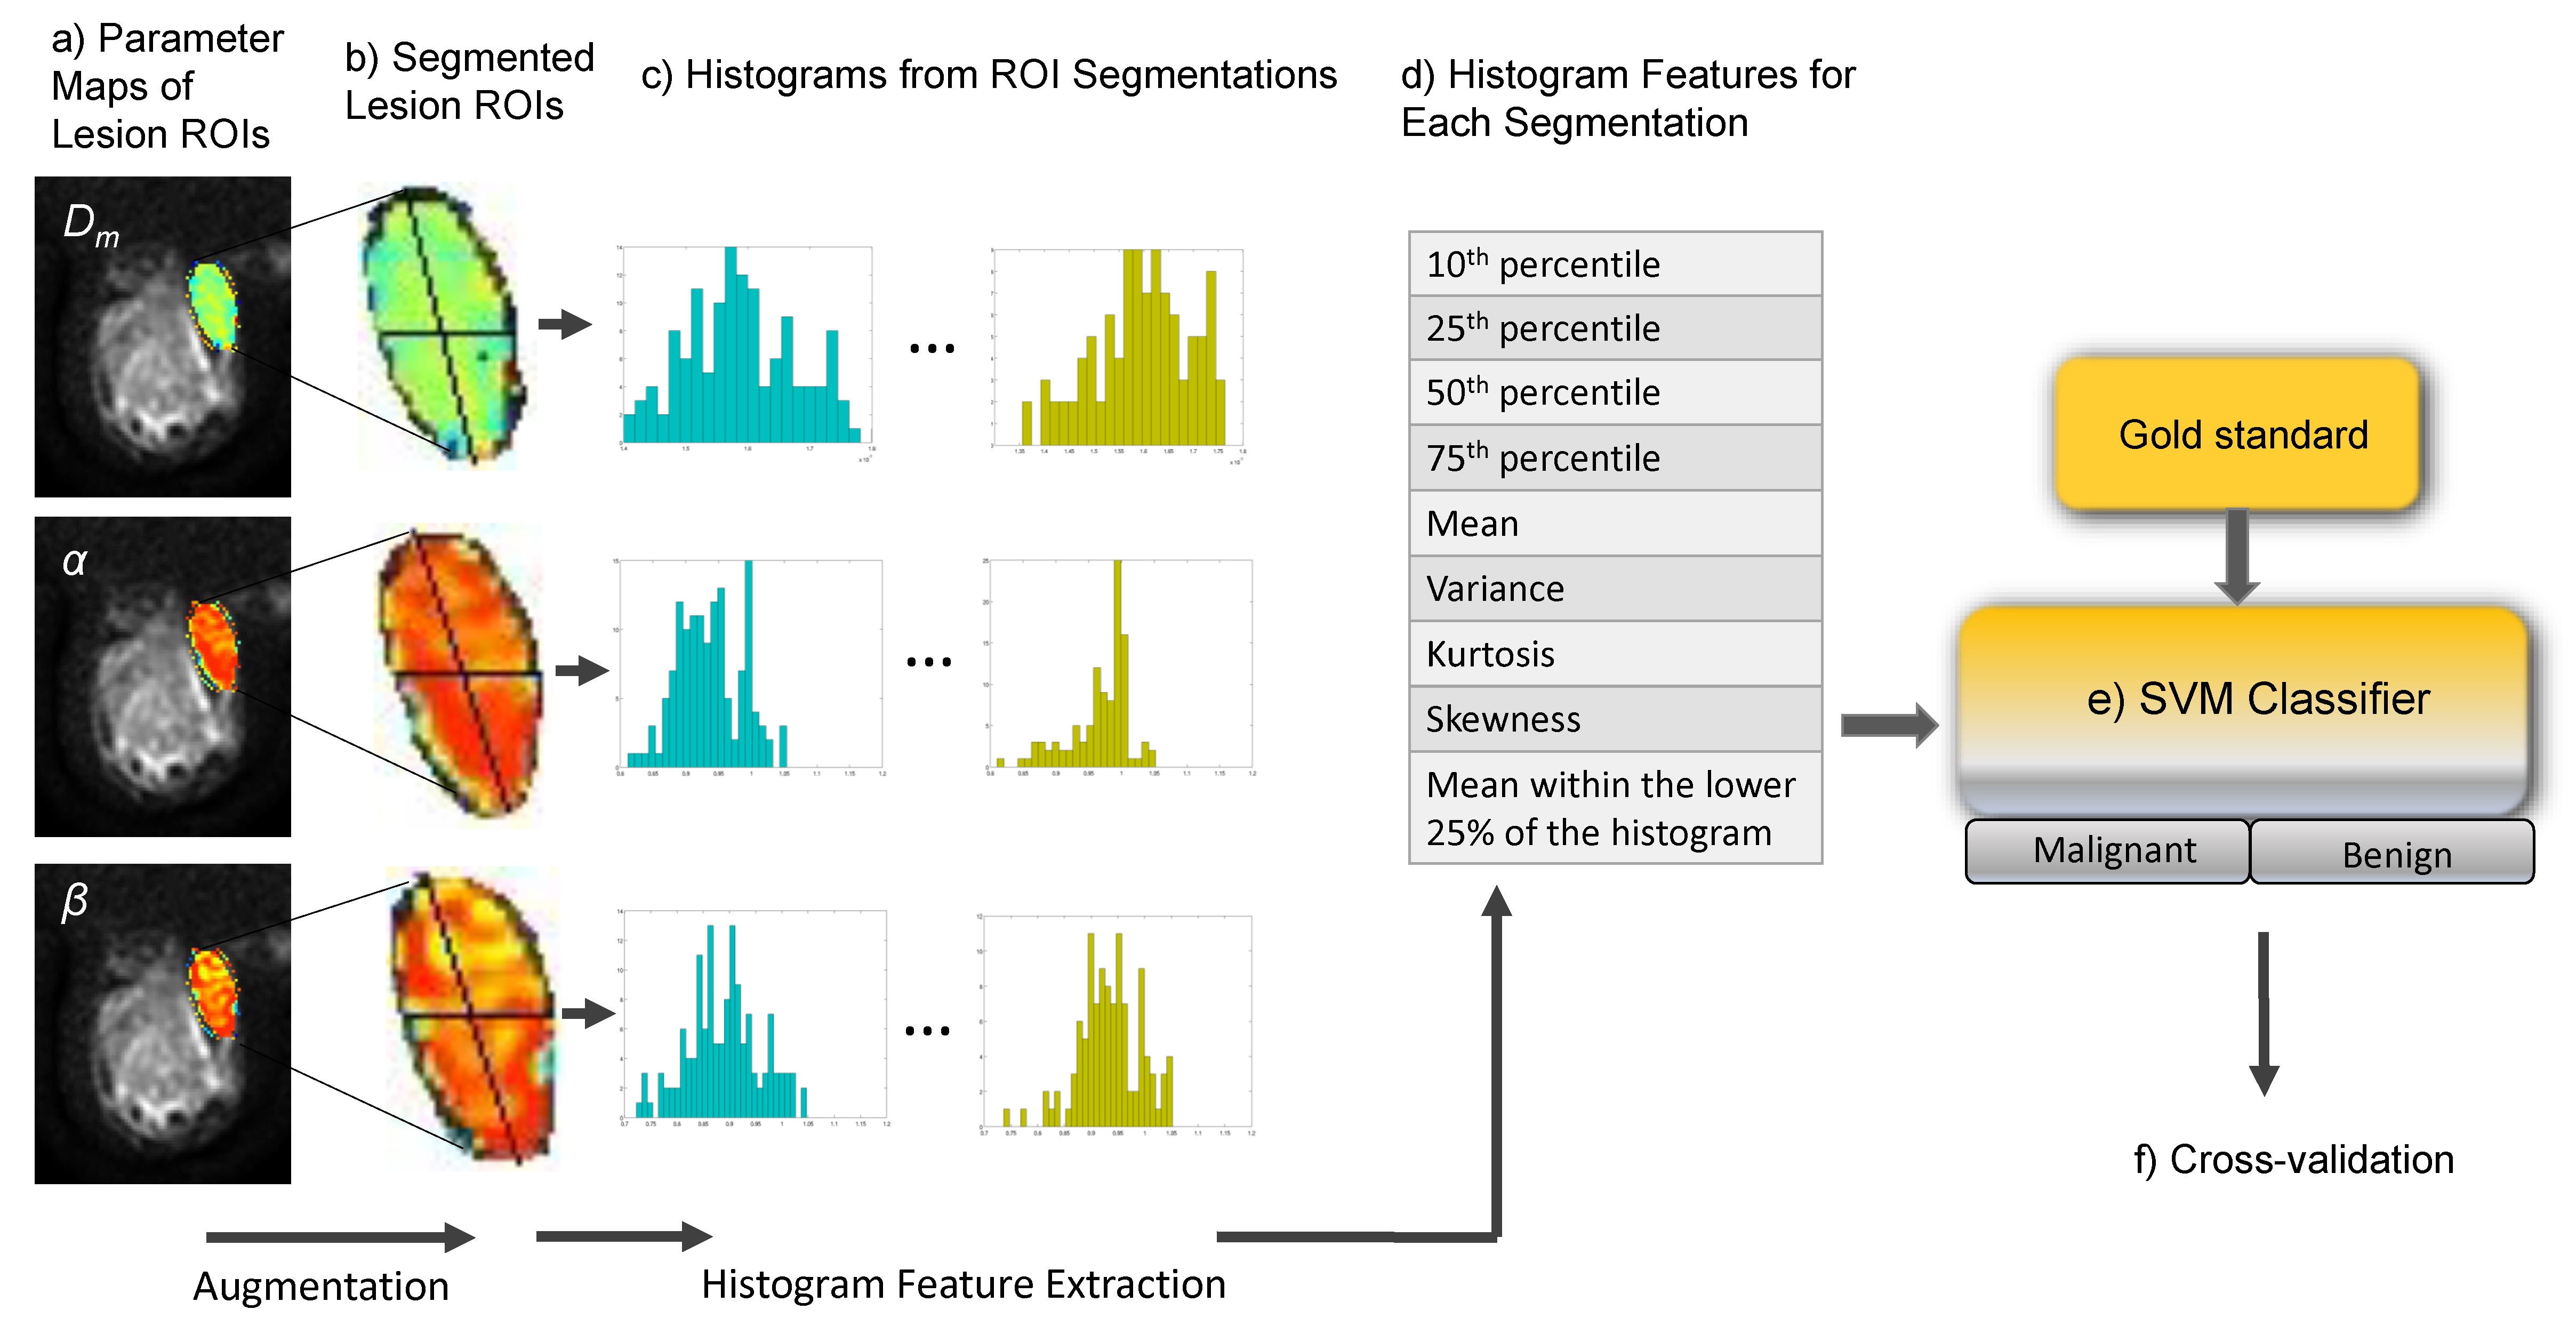
Image Acquisition: The study enrolled 33 women with histologically confirmed focal breast lesions (21 malignant, 12 benign). All patients underwent axial MRI scans at 3T (GE Healthcare, Discovery MR750) with an 8-channel breast coil. DWI was performed with 11 b-values (01, 501, 1002, 3002, 5002, 8004, 11004, 15006, 20006, 25008, 30008 s/mm2; subscripts denoting NEXs), TR/TE=7000/78ms, slice thickness=5mm, FOV=32cm×32cm, and matrix=256×256. Trace-weighted images were obtained to minimize the effect of diffusion anisotropy. Image Analysis: The multi-b-value diffusion images were analyzed with the CTRW model11,$$S/S_{0}=E_{\alpha}(-(bD_{m})^{\beta}), (1) $$ which yields a set of diffusion parameters: an anomalous diffusion coefficient Dm (in μm2/ms), and temporal and spatial diffusion heterogeneity parameters, α and β, respectively, where Eα is a Mittag-Leffler function. A least-squares nonlinear fitting algorithm was used to obtain the diffusion parameters. Machine Learning-based Analysis: As illustrated in Figure 1a, the ROIs that were drawn on the tumor-containing diffusion-weighted (DW) images of each patient were applied to the CTRW parameter maps obtained from Eq. (1). To increase the data size, each lesion ROI was segmented into 2, 3, or 4 sub-regions with similar size (Figure 1b). From these ROI segments, three CTRW parameter histograms were obtained (Figure 1c), and 9 histogram features for each parameter were extracted, resulting in 27 features for each ROI segments (Figure 1d). These features were then used to train a support vector machine (SVM) model to serve as a classifier (Figure 1e). This was followed by a performance validation through a receiver operating characteristic (ROC) analysis with a 5-fold cross-validation (Figure 1f). Comparisons: The diagnostic performance of the multi-parameter multi-feature classifier with 27 features was compared with those of the SVM classifiers that were trained with a) only the mean of all CTRW parameters, resulting in 3 features (multi-parameter single-feature); and b) only the mean Dm (similar to ADC), resulting in 1 feature (single-parameter single-feature).Results:
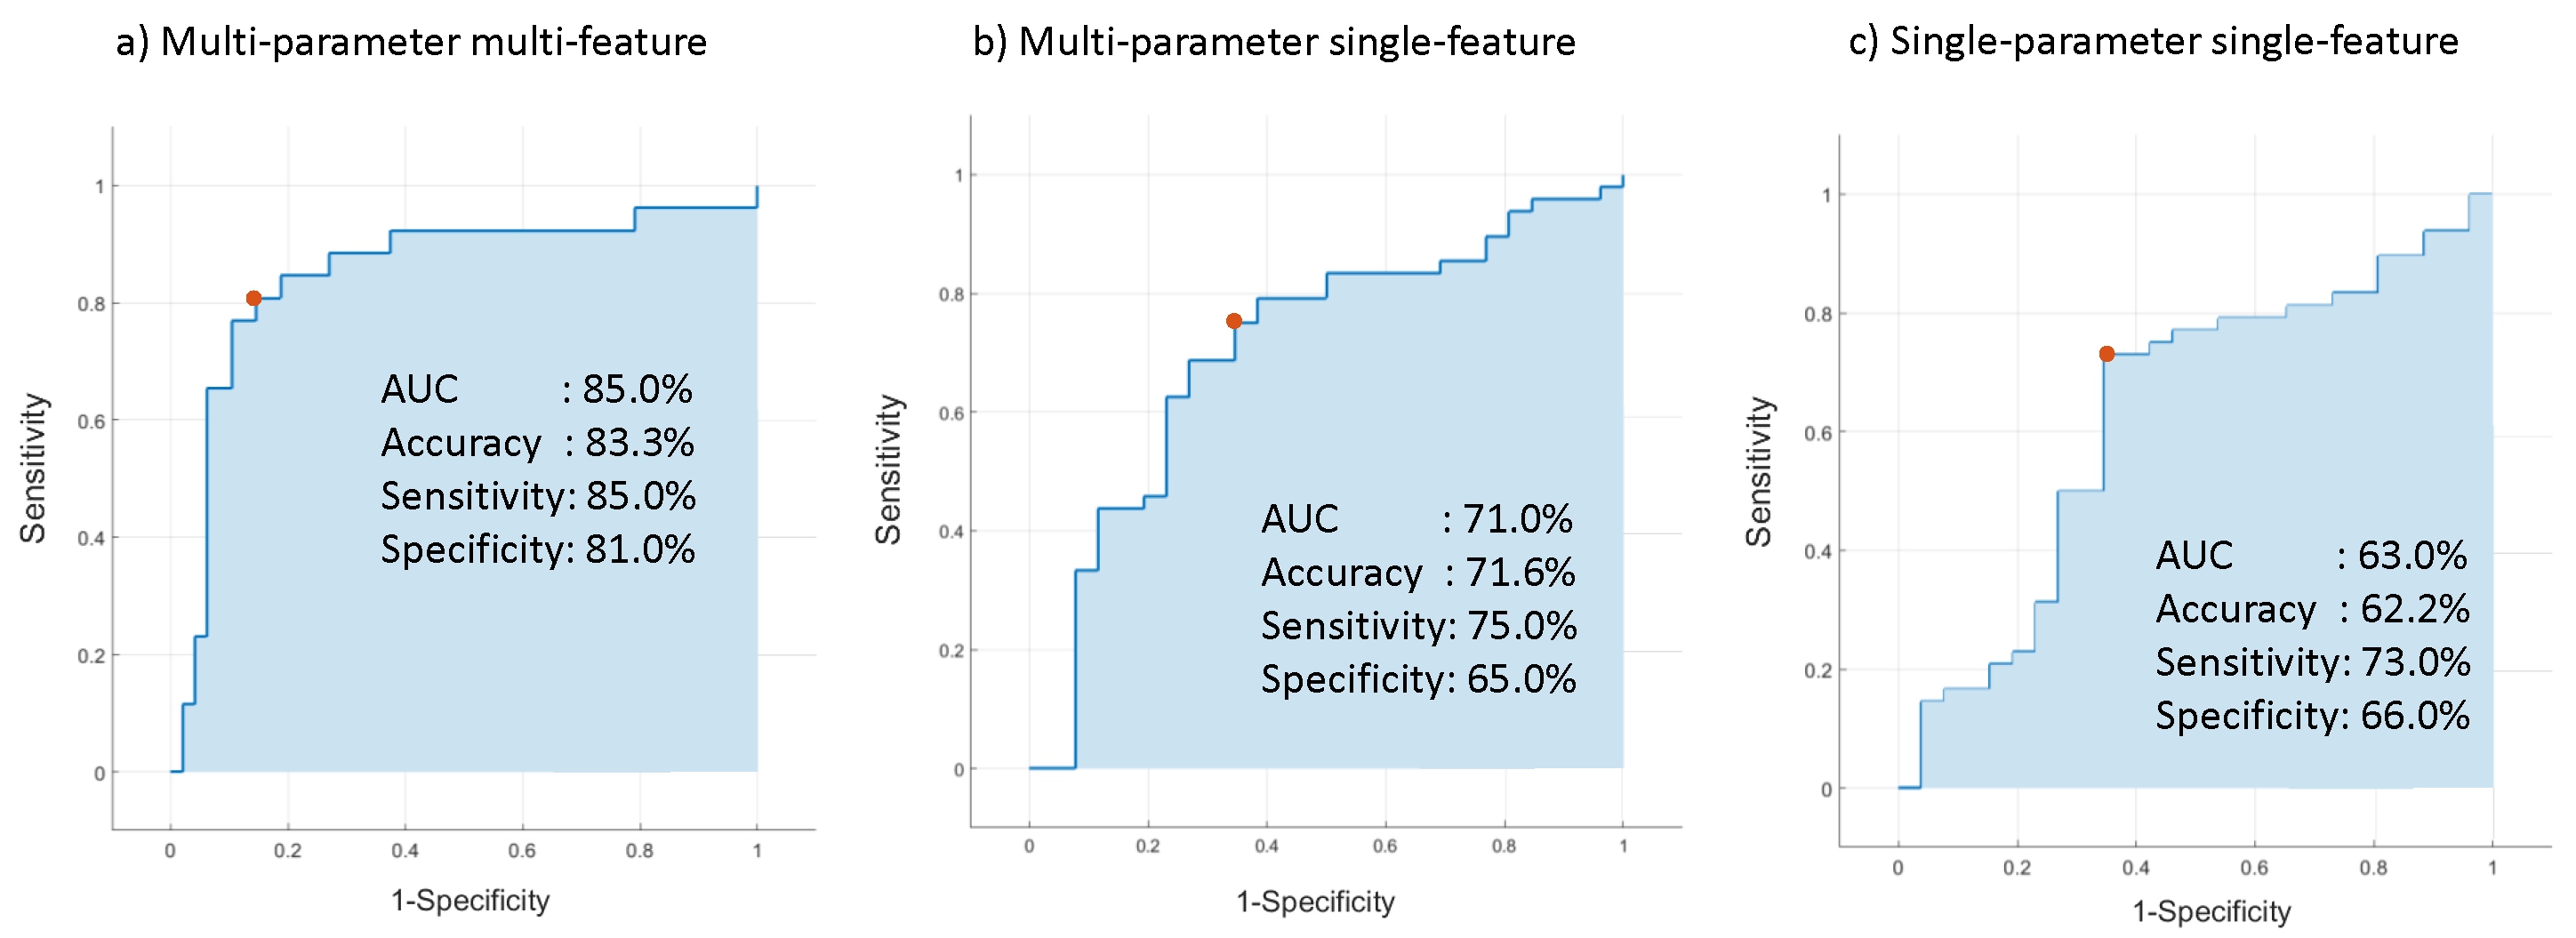
Figure 2 shows Dm, α, and β maps of a representative patient from the benign (Figures 2a-c) and malignant (Figures 2d-f) breast lesion groups. The mean CTRW parameters in the malignant lesion (Dm: 0.80±0.51 μm2/ms, α: 0.46±0.30, β: 0.65±0.34) were significantly lower than those in the benign lesion (Dm: 1.2±0.59 μm2/ms, α: 0.73±0.36, β: 0.70±0.34). The individual performances of the histogram features for differentiating benign and malignant lesions are displayed in Figure 3 using a heat map of the p-values. For each parameter, multiple features were significantly different (p-value<0.05) between the two groups, suggesting the potentially added value of combining multiple features for differentiation of the lesions. Figure 4 summarizes the ROC curves of the multi-parameter multi-feature classifier (Figure 4a), multi-parameter single-feature classifier (Figure 4b), and single-parameter single-feature classifier (Figure 4c) obtained through 5-fold cross-validations. The multi-parameter multi-feature SVM classifier yielded the best performance with an accuracy of 83.3% (vs. 71.6% in multi-parameter single-feature and 62.2% in single-parameter single-feature), area-under-the-curve of 85% (vs. 71% and 63%), sensitivity of 85% (vs. 75% and 73%), and specificity of 81% (vs. 65% and 66%).Discussion and Conclusion:
This study demonstrated the performance of the CTRW model for differentiating benign and malignant breast lesions through a multi-parameter, multi-feature, machine learning-based analysis technique. Combination of the histogram features from all three CTRW parameters provided the best diagnostic performance compared to the approaches with a single parameter (e.g., ADC) or a single feature. Importantly, the technique described herein yielded comparable performance to that of DCE-MRI which has a high sensitivity (reported range of 71%–100%)12, but varying specificity (reported range of 37%-97%)13,14. The proposed approach may provide a new avenue to breast cancer diagnosis, preventing unnecessary biopsies and/or reducing the use for contrast administration.Acknowledgements
This work was supported in part by NIH 1S10RR028898 and R01EB026716.References
- Rubesova E, Grell AS, de Maertelaer V, et al. Quantitative diffusion imaging in breast cancer: A clinical prospective study. J Magn Reson Imaging. 2006; 24:319-324.
- Guo Y, Cai YQ, Cai ZL, et al. Differentiation of clinically benign and malignant breast lesions using diffusion-weighted imaging. J Magn Reson Imaging. 2002; 16:172–178.
- Partridge SC, Demartini WB, Kurland BF, et al. Differential diagnosis of mammographically and clinically occult breast lesions on diffusion-weighted MRI. J Magn Reson Imaging. 2010; 31:562–570.
- Le Bihan D. Apparent diffusion coefficient and beyond: What diffusion MR imaging can tell us about tissue structure. Radiology. 2013; 268(2):318-322.
- Tang L. and Zhou XJ. Diffusion MRI of cancer: From low to high b-values. J Magn Reson Imaging 2018, online early view; PMID:30311988.
- Sigmund EE, Cho GY, Kim S, et al. Intravoxel incoherent motion imaging of tumor microenvironment in locally advanced breast cancer. Magn Reson Med. 2011; 65:1437–1447.
- Liu C, Liang C, Liu Z, et al. Intravoxel incoherent motion (IVIM) in evaluation of breast lesions: Comparison with conventional DWI. Eur J Radiol. 2013; 82:782–789.
- Cho GY, Gennaro L, Sutton EJ, et al. Intravoxel incoherent motion (IVIM) histogram biomarkers for prediction of neoadjuvant treatment response in breast cancer patients. Eur J Radiol Open. 2017; 4:101–107.
- Cai H, Peng Y, Ou C, et al. Diagnosis of breast masses from dynamic contrast-enhanced and diffusion-weighted MR: a machine learning approach. PLoS One. 2014; 9:e87387.
- Vidic I, Egnell L, Jerome N, et al. Support vector machine for breast cancer classification using diffusion-weighted MRI histogram features: Preliminary study. J Magn Reson Imaging. 2018; 47:1205-1216.
- Karaman MM, Sui Y, Wang H, et al. Differentiating low- and high-grade pediatric brain tumors using a continuous-time random-walk diffusion model at high b-values. Magn Reson Med. 2016; 76(4):1149-1157.
- DeMartini W, Lehman C, Partridge S. Breast MRI for cancer detection and characterization: A review of evidence-based clinical applications. Academic Radiology. 2008; 15(4): 408-416
- Schelfout K, van Goethem M, Kersschot E, et al. Contrast-enhanced MR imaging of breast lesions and effect on treatment. Eur J Surg Oncol. 2004; 30:501–507.
- Jansen SA, Fan X, Karczmar GS, et al. DCEMRI of breast lesions: Is kinetic analysis equally effective for both mass and nonmass-like enhancement? Med Phys. 2008; 35:3102–3109.
Figures